Loading subject page…

- Civil Engineering
- Fluid Kinematics
- Streamlines, Streaklines, and Pathlines
Micro-course: Fluid Kinematics
8,195 views
Learn key concepts and earn your certificate.


Streamlines, Streaklines, and Pathlines


00:00
01:18
Video Summary: What Is Streamlines Streaklines and Pathlines
Did you know that when NASA engineers track spacecraft trajectories or hurricane meteorologists follow storm paths, they're applying the same principles that govern water flowing through your home's plumbing? Understanding control volume and system representations begins with mastering streamlines, streaklines, and pathlines-three fundamental visualization methods in fluid mechanics. Consider how air flows around a Boeing 737's wing during takeoff at Chicago O'Hare Airport, where engineers use these concepts to optimize fuel efficiency and safety. Watch the full video on JoVE Coach to master this concept with expert-led visuals and step-by-step explanations.
- Understand what streamlines, streaklines, and pathlines represent in fluid flow visualization and their relationship to control volume and system representations
- Identify the key differences between streamlines (instantaneous flow direction), streaklines (particle history), and pathlines (individual particle trajectories)
- Analyze how these three flow visualization methods behave differently under steady versus unsteady flow conditions
- Compare the practical applications of each visualization technique in engineering design and analysis
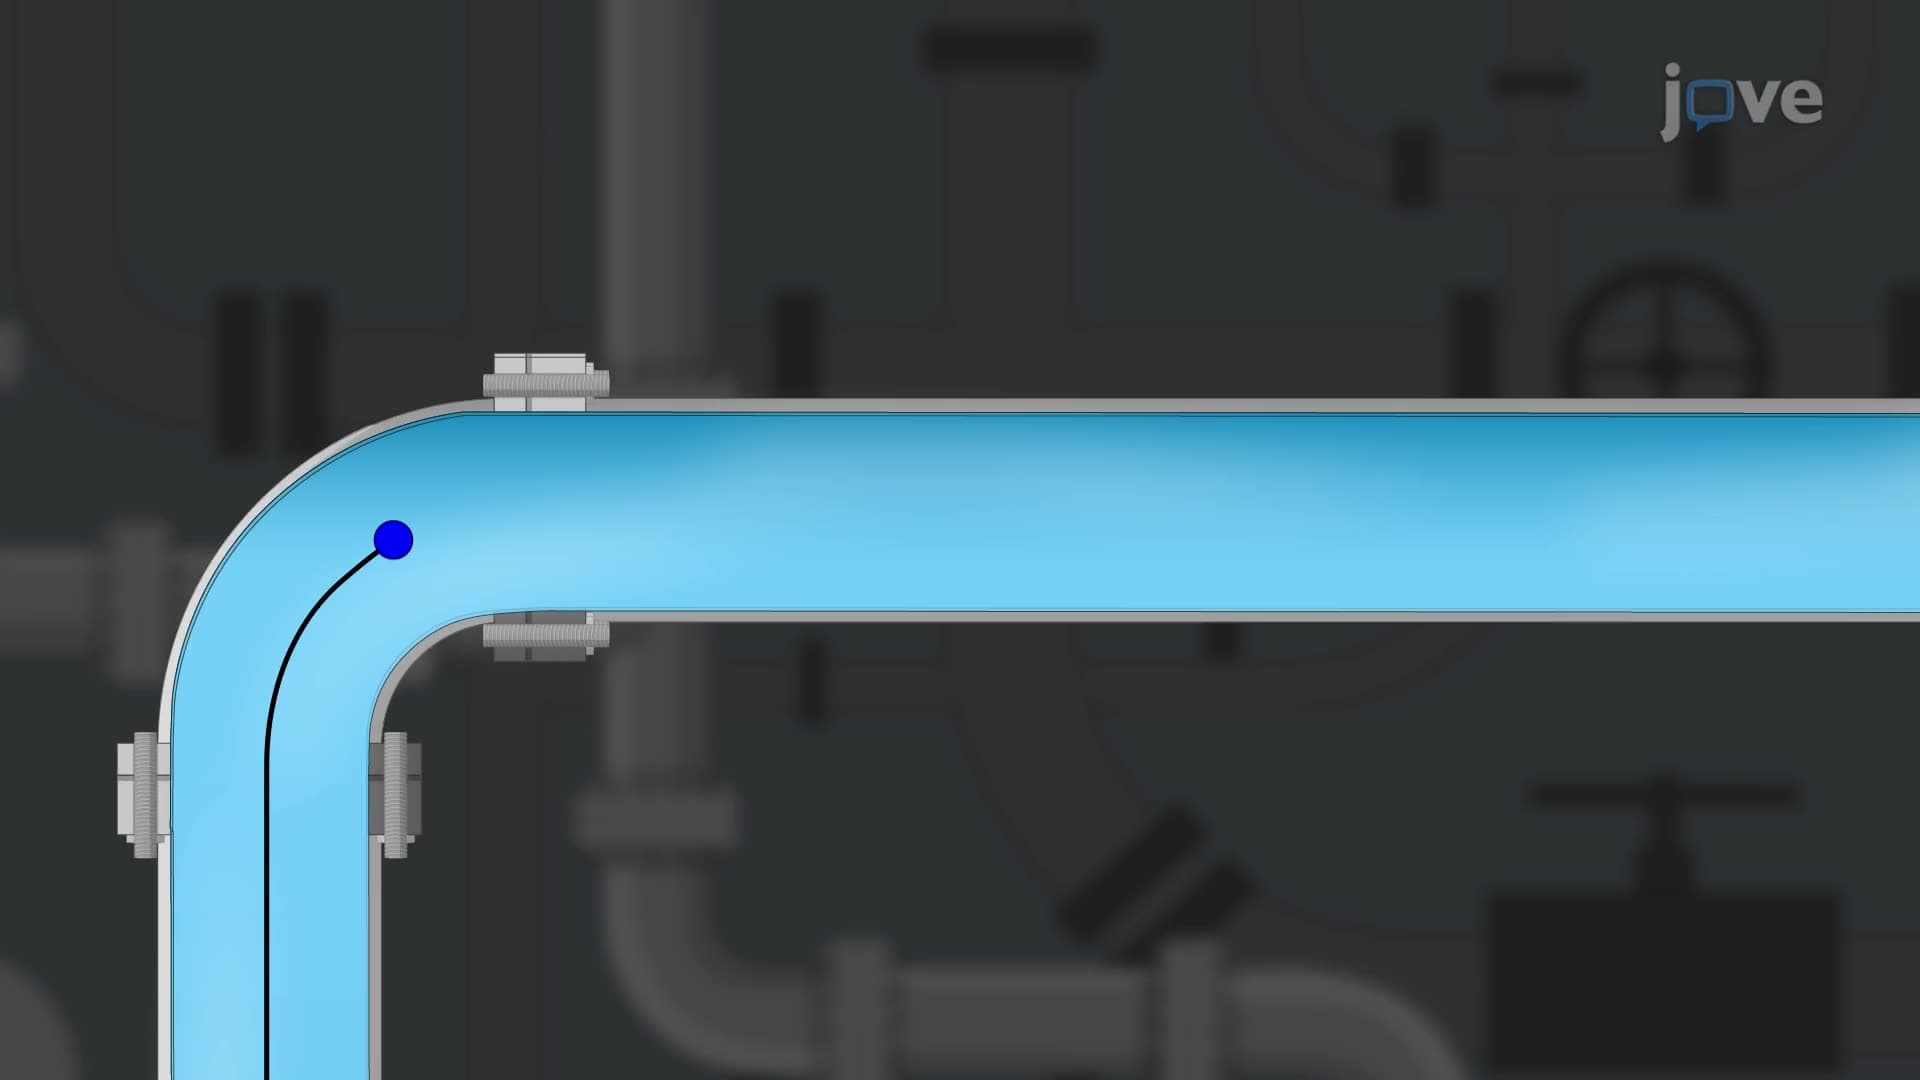
- Apply streamline concepts to solve problems involving curved pipes, nozzles, and other fluid flow systems
- Recognize when streamlines, streaklines, and pathlines coincide versus when they diverge in real-world scenarios
- Evaluate fluid flow patterns using appropriate visualization methods for specific engineering applications
- Explore how these fundamental concepts connect to broader control volume analysis in thermodynamics and fluid mechanics
Understanding Streamlines, Streaklines, and Pathlines in Fluid Mechanics
When engineers at General Electric design jet engines or researchers at MIT study ocean currents, they rely on three fundamental visualization techniques that form the backbone of control volume and system representations. These methods-streamlines, streaklines, and pathlines-provide different but complementary perspectives on how fluids move through space and time.
Streamlines: Capturing Instantaneous Flow Direction
A streamline represents the instantaneous direction of fluid velocity at every point in the flow field. Think of streamlines as invisible highways that particles would follow at any given moment. The key principle is that streamlines are always tangent to the velocity vector, meaning no fluid can cross a streamline. This concept proves invaluable in control volume and system representations tutorial applications, particularly when analyzing flow through complex geometries like turbine blades or automotive air intakes.
For AP Physics students, streamlines often appear in exam problems involving fluid flow through pipes or around obstacles. The mathematical beauty of streamlines lies in their ability to simplify complex three-dimensional flows into comprehensible two-dimensional patterns. Engineers at Boeing use streamline analysis to optimize wing designs, ensuring smooth airflow that minimizes drag and maximizes lift efficiency.
Streaklines: Tracking Particle History
Streaklines tell a different story-they show where all particles that have passed through a specific point are located at any given time. Imagine injecting blue dye into the Mississippi River at St. Louis; the resulting blue trail downstream represents a streakline. This visualization technique proves essential in control volume and system representations concept studies, particularly for understanding mixing processes and pollutant dispersion.
Environmental engineers rely heavily on streakline analysis when studying how contaminants spread through groundwater systems or how emissions from industrial plants affect air quality. For college students preparing for the MCAT, understanding streaklines helps explain how blood flow patterns change in diseased arteries or how pharmaceutical compounds distribute through the cardiovascular system.
Pathlines: Following Individual Particle Journeys
Pathlines trace the actual path of individual fluid particles over time, similar to tracking a specific leaf floating down the Colorado River. While conceptually straightforward, pathlines provide the most detailed information about particle motion, making them crucial for understanding control volume and system representations in dynamic systems.
In unsteady flows-such as ocean waves, atmospheric turbulence, or pulsating blood flow-pathlines, streamlines, and streaklines diverge significantly. However, in steady flows like water through a constant-diameter pipe, all three visualization methods align perfectly. This convergence principle frequently appears in fluid mechanics exams and forms the foundation for more advanced control volume analysis techniques.
Frequently Asked Questions
Streamlines show instantaneous flow direction at every point, streaklines track where particles from one location end up over time, and pathlines follow individual particle paths. In steady flow, all three coincide, but in unsteady flow, they differ significantly. Understanding these distinctions is crucial for control volume analysis in engineering applications.
These concepts frequently appear in AP Physics 2 fluid mechanics problems, particularly when analyzing flow through pipes, around obstacles, or in Bernoulli's equation applications. Students must identify which visualization method applies to specific scenarios and explain why streamlines cannot cross each other in steady flow situations.
MCAT passages often feature cardiovascular system problems involving blood flow visualization, respiratory mechanics with airflow patterns, and kidney function with filtration flows. Understanding how these visualization techniques apply to biological systems helps answer passage-based questions about fluid transport in living organisms.
NASA engineers use streamline analysis for spacecraft reentry heat shield design, while automotive companies like Ford apply these principles to reduce vehicle drag coefficients. Chemical plant designers rely on streamline visualization to optimize reactor mixing and heat exchanger performance, directly impacting safety and efficiency.
These concepts are very accessible with proper visualization tools and real-world examples. Most students grasp the basics quickly when comparing streamlines to traffic flow patterns or pathlines to GPS tracking. The mathematical complexity increases at the college level, but fundamental understanding requires only basic vector concepts.
Practice drawing streamlines around simple objects like cylinders and airfoils, then progress to more complex geometries. Use online flow visualization simulations to see how streamlines, streaklines, and pathlines behave differently in unsteady flows. Create comparison charts highlighting when these three methods align versus diverge.
Streamlines provide the framework for applying Bernoulli's equation along flow paths, with higher velocity regions (closer streamlines) corresponding to lower pressure areas. This relationship explains lift generation on airplane wings and the Venturi effect in pipe flow, forming essential connections for advanced fluid mechanics study.
Control volume analysis, computational fluid dynamics (CFD), turbulence modeling, and heat transfer analysis all rely heavily on these fundamental visualization techniques. Students planning engineering careers should master these concepts before tackling advanced coursework in thermodynamics, transport phenomena, or aerospace engineering.
Related Micro-courses

9 Concepts

10 Concepts
