Loading subject page…

10,971 views

Video Summary: What Is Bacterial Growth Curve
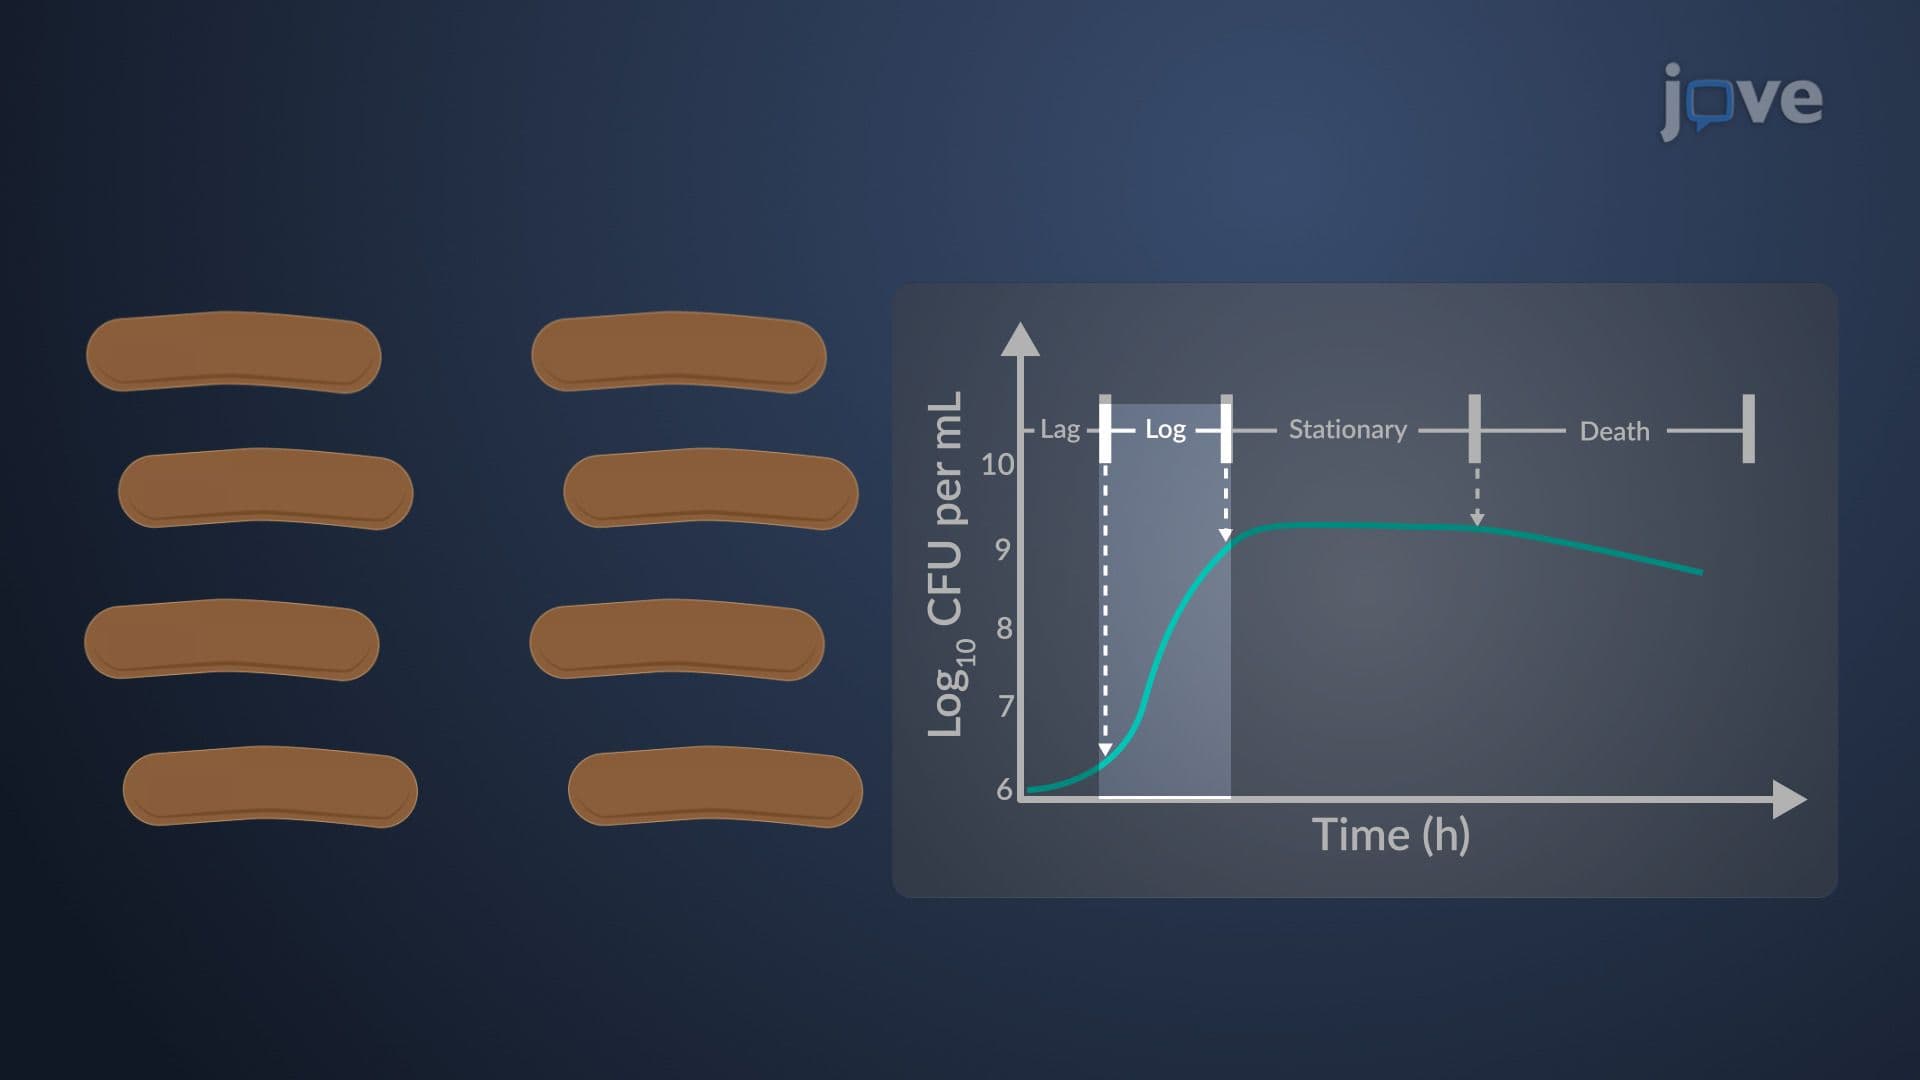
Did you know that harmful bacteria like E. coli can double their population every 20 minutes under ideal conditions? The bacterial growth curve reveals exactly how bacterial populations expand through four distinct phases in controlled environments. Understanding this concept is crucial for fields ranging from food safety at companies like General Mills to antibiotic development at pharmaceutical giants such as Pfizer. Watch the full video on JoVE Coach to master this concept with expert-led visuals and step-by-step explanations.
The bacterial growth curve serves as a fundamental model in microbiology, describing how bacterial populations change over time in closed laboratory systems. This standardized growth pattern appears consistently across diverse bacterial species when researchers control temperature, pH, and nutrient conditions. Students encountering this concept in AP Biology or college microbiology courses should recognize that this curve represents idealized conditions-real-world bacterial growth often involves more complex variables.
During the lag phase, bacterial cells prioritize adaptation over reproduction. Think of this as bacteria "getting their bearings" in a new environment. Cells synthesize essential enzymes, repair any cellular damage, and accumulate necessary nutrients for upcoming division cycles. For example, when Salmonella bacteria contaminate fresh produce in California farms, they initially enter a lag phase while adjusting to the plant surface environment. This phase duration varies dramatically-from minutes to hours-depending on factors like temperature differences between the previous and current environment.
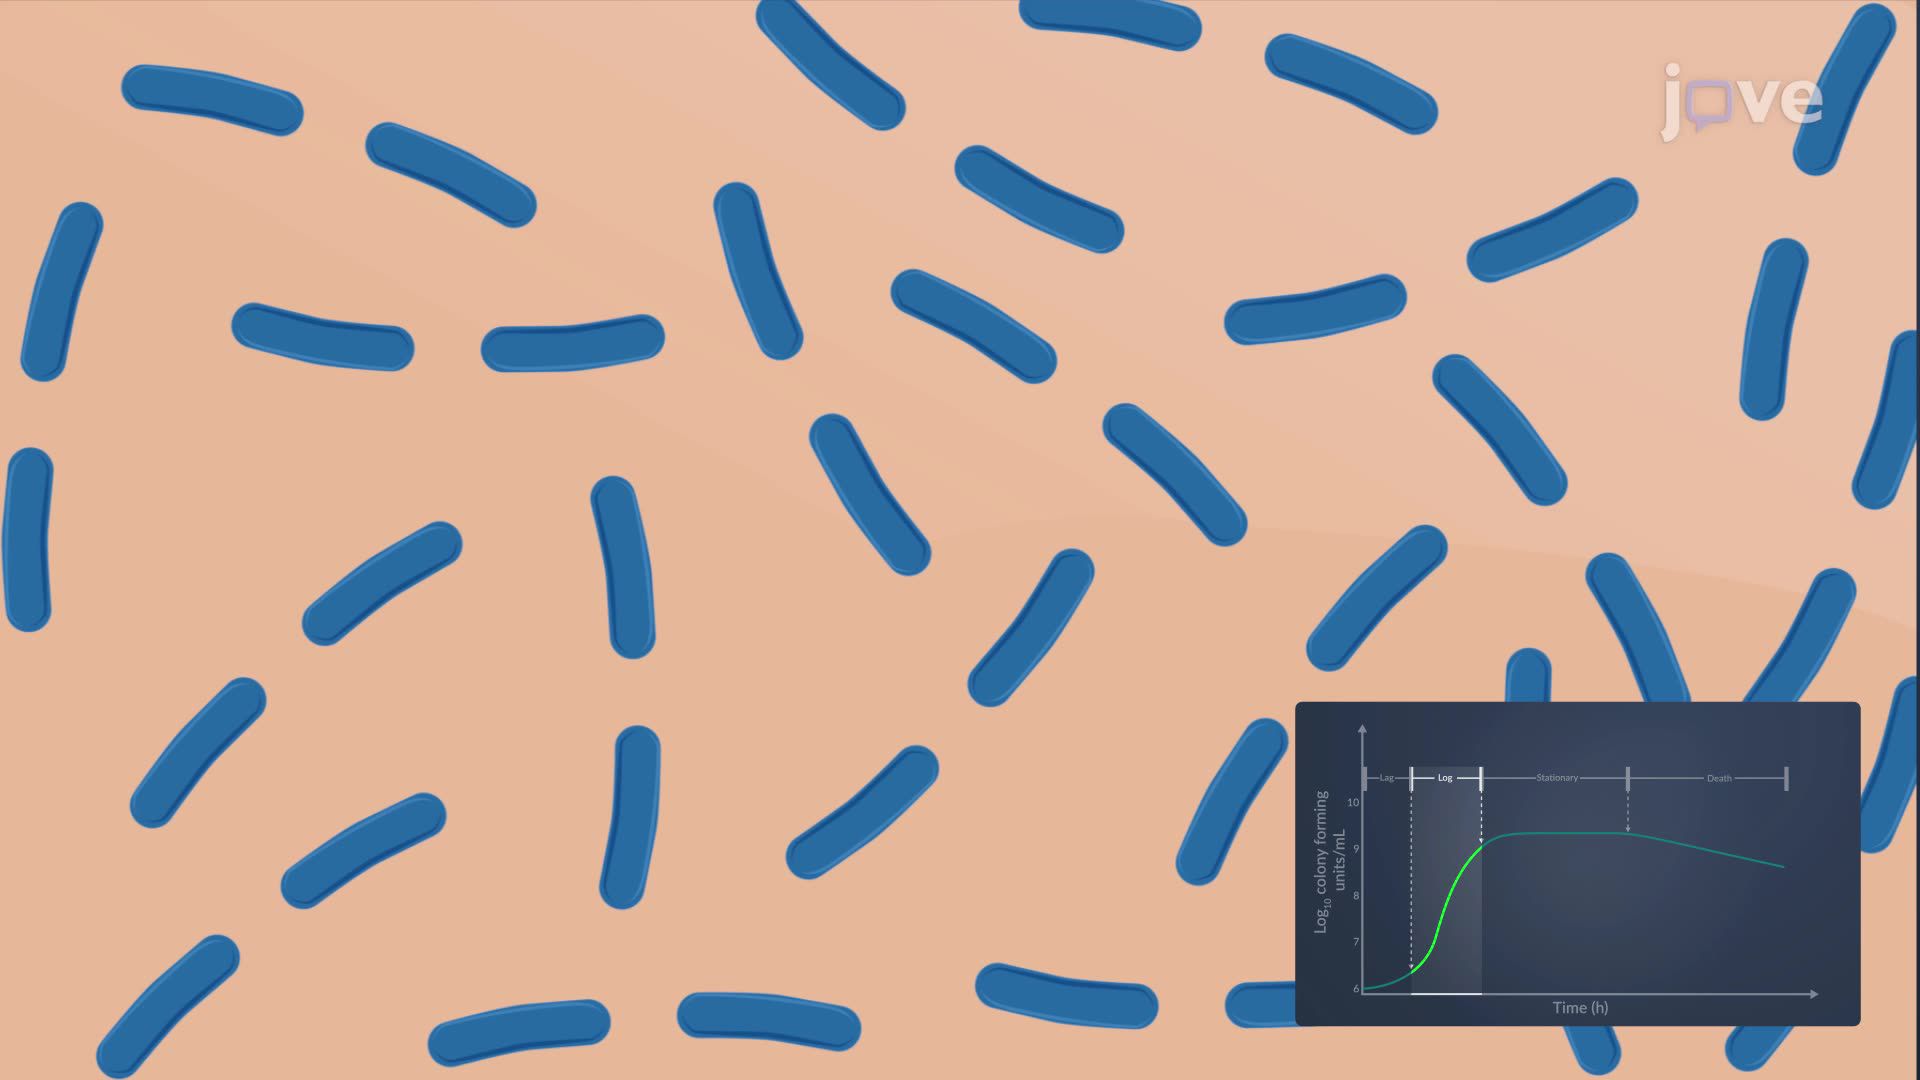
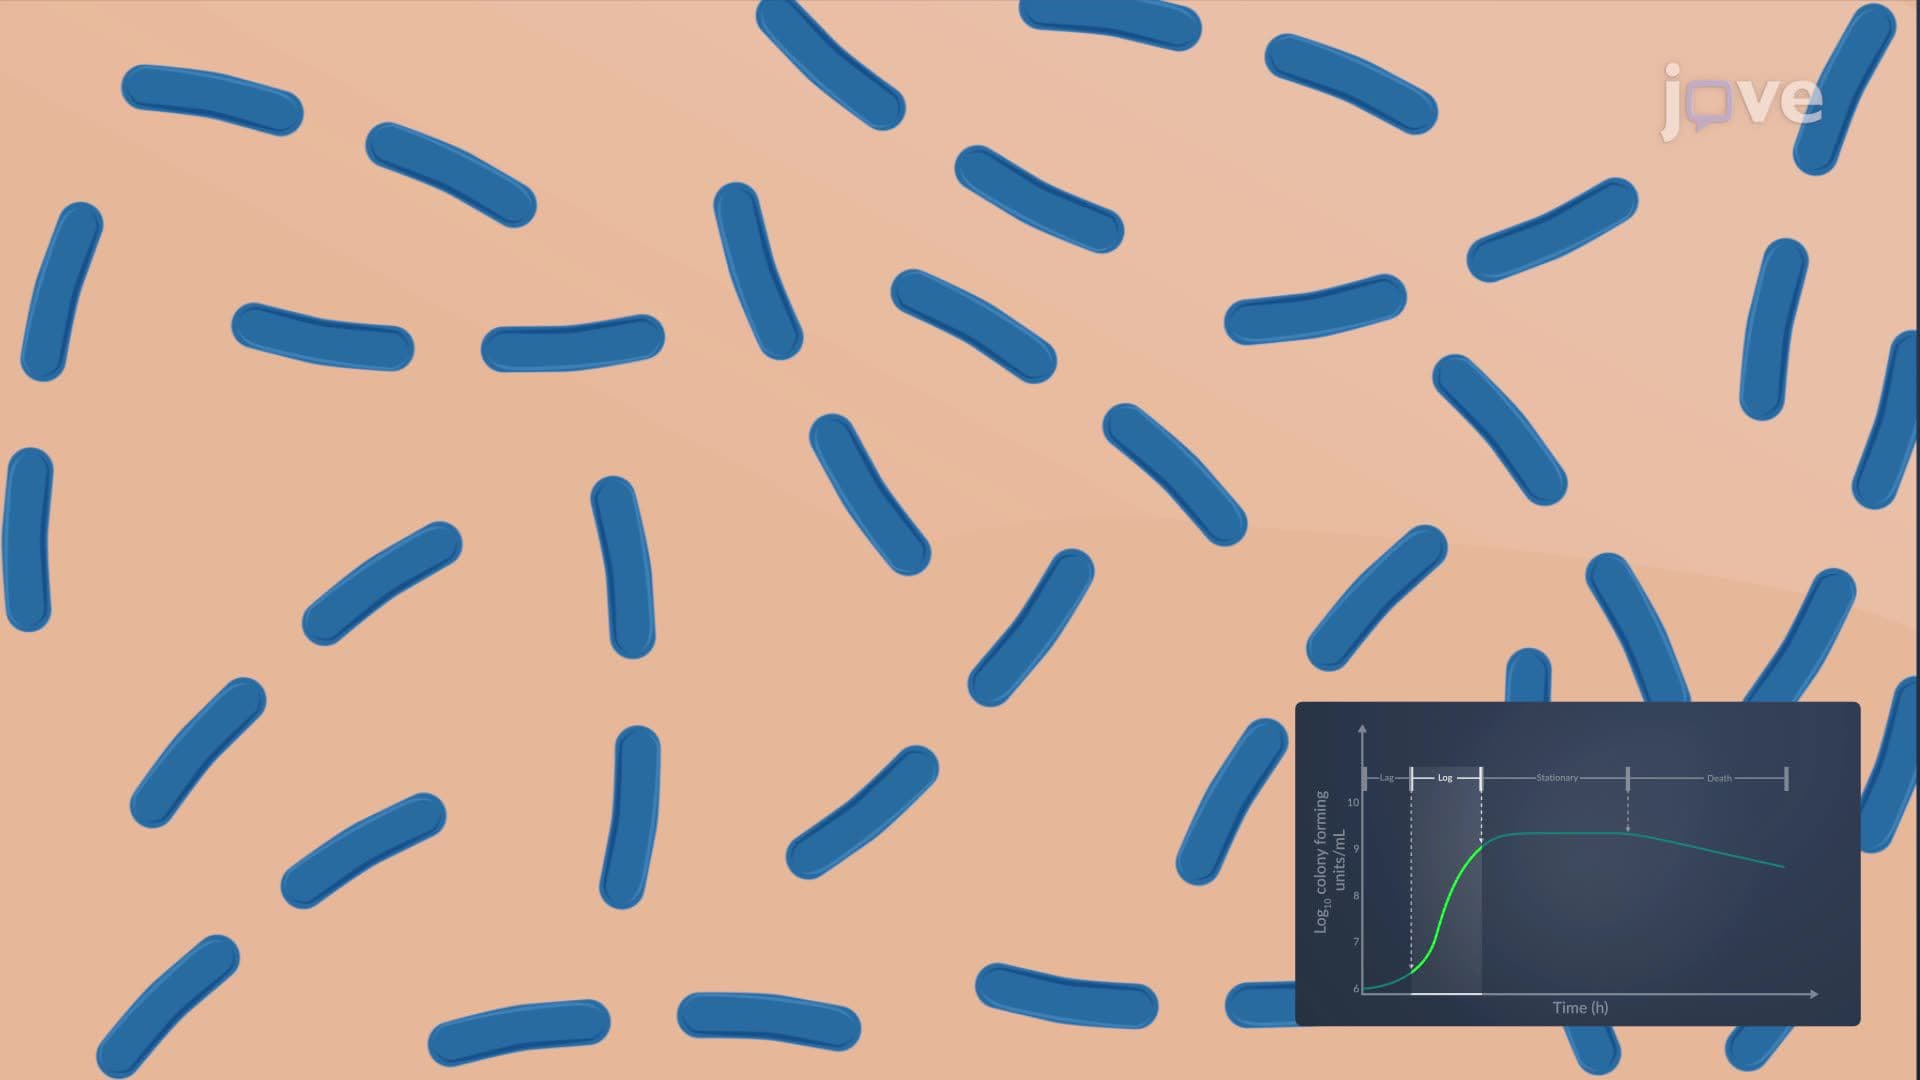
The exponential phase represents bacterial reproduction at its peak efficiency. Population doubles occur at regular intervals, creating the characteristic steep upward curve on growth charts. During this phase, E. coli bacteria can divide every 20 minutes under optimal laboratory conditions at 37°C. This rapid growth explains why foodborne illness outbreaks can escalate quickly-a single contaminated hamburger at a Texas restaurant chain could theoretically produce millions of bacteria within hours if stored at improper temperatures.
As nutrients become scarce and toxic metabolic byproducts accumulate, growth rates decline until cell division equals cell death. This equilibrium creates a plateau on the growth curve. Pharmaceutical companies like Merck exploit this phase when producing antibiotics-many bacteria produce secondary metabolites (including antibiotics) primarily during stationary phase as a survival strategy.
When environmental conditions become unsustainable, viable cell numbers decrease exponentially. However, some bacteria enter dormant states or form resistant spores rather than dying outright. Understanding this phase helps explain why sterilization protocols in US hospitals require specific time-temperature combinations to ensure complete pathogen elimination.
Students preparing for MCAT biology sections should focus on connecting growth curve phases to metabolic processes and environmental factors that influence bacterial behavior in clinical settings.
Related Micro-courses