Loading subject page…


5,987 views


Video Summary: What Is Mathematical Representation Supply Curve
Ever wonder why gas stations raise prices during hurricanes, or why concert tickets cost more for popular artists? The mathematical representation supply curve explains these patterns using a simple linear equation: Qs = mP + b. This formula predicts exactly how much producers will supply at different prices-like how California farmers might increase tomato production by 200 pounds for every dollar increase in price. Watch the full video on JoVE Coach to master this concept with expert-led visuals and step-by-step explanations.
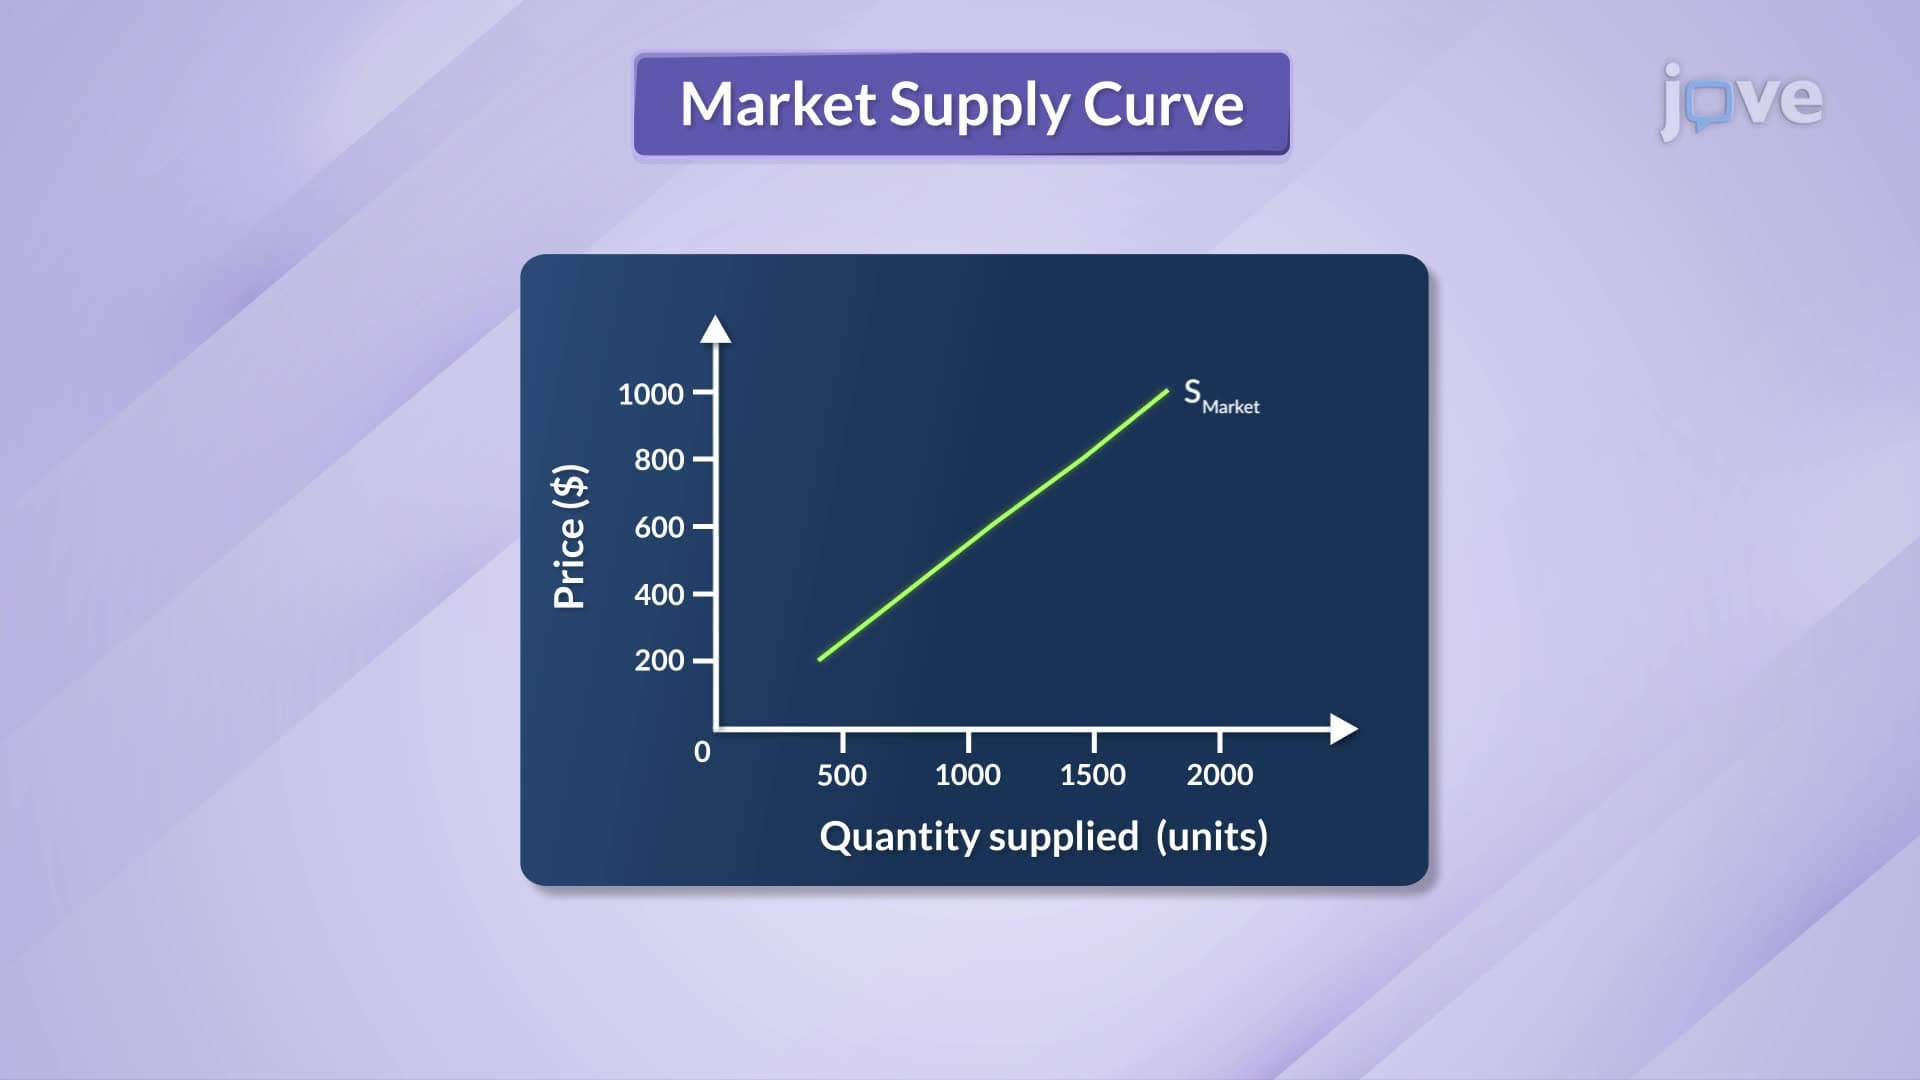
The mathematical representation supply curve transforms economic theory into precise, predictable formulas. While economists describe supply as the relationship between price and quantity, mathematics gives us the tools to quantify exactly how producers respond to market changes. The basic linear supply function Qs = mP + b serves as the foundation for understanding producer behavior across industries-from Apple's iPhone production to ExxonMobil's oil extraction.
Every supply equation contains four critical elements. The quantity supplied (Qs) represents how much producers offer at specific prices. The slope coefficient (m) reveals producer responsiveness-a steep slope means producers dramatically increase output when prices rise, while a flat slope indicates limited responsiveness. Price (P) serves as the independent variable driving production decisions. The y-intercept (b) often appears negative, representing the quantity that would theoretically be supplied if the price were zero (usually negative because producers need positive prices to cover costs).
Converting supply functions into inverse form (P as a function of Qs) reveals crucial market insights. When farmers' tomato supply follows Qs = 200P - 200, the inverse function P = (Qs + 200)/200 shows they won't supply tomatoes below $1 per pound. This minimum price-called the supply choke price-represents the vertical intercept where quantity supplied equals zero. Understanding inverse functions proves essential for AP Economics students and helps explain why concert venues set minimum ticket prices or why Uber implements surge pricing during peak demand.
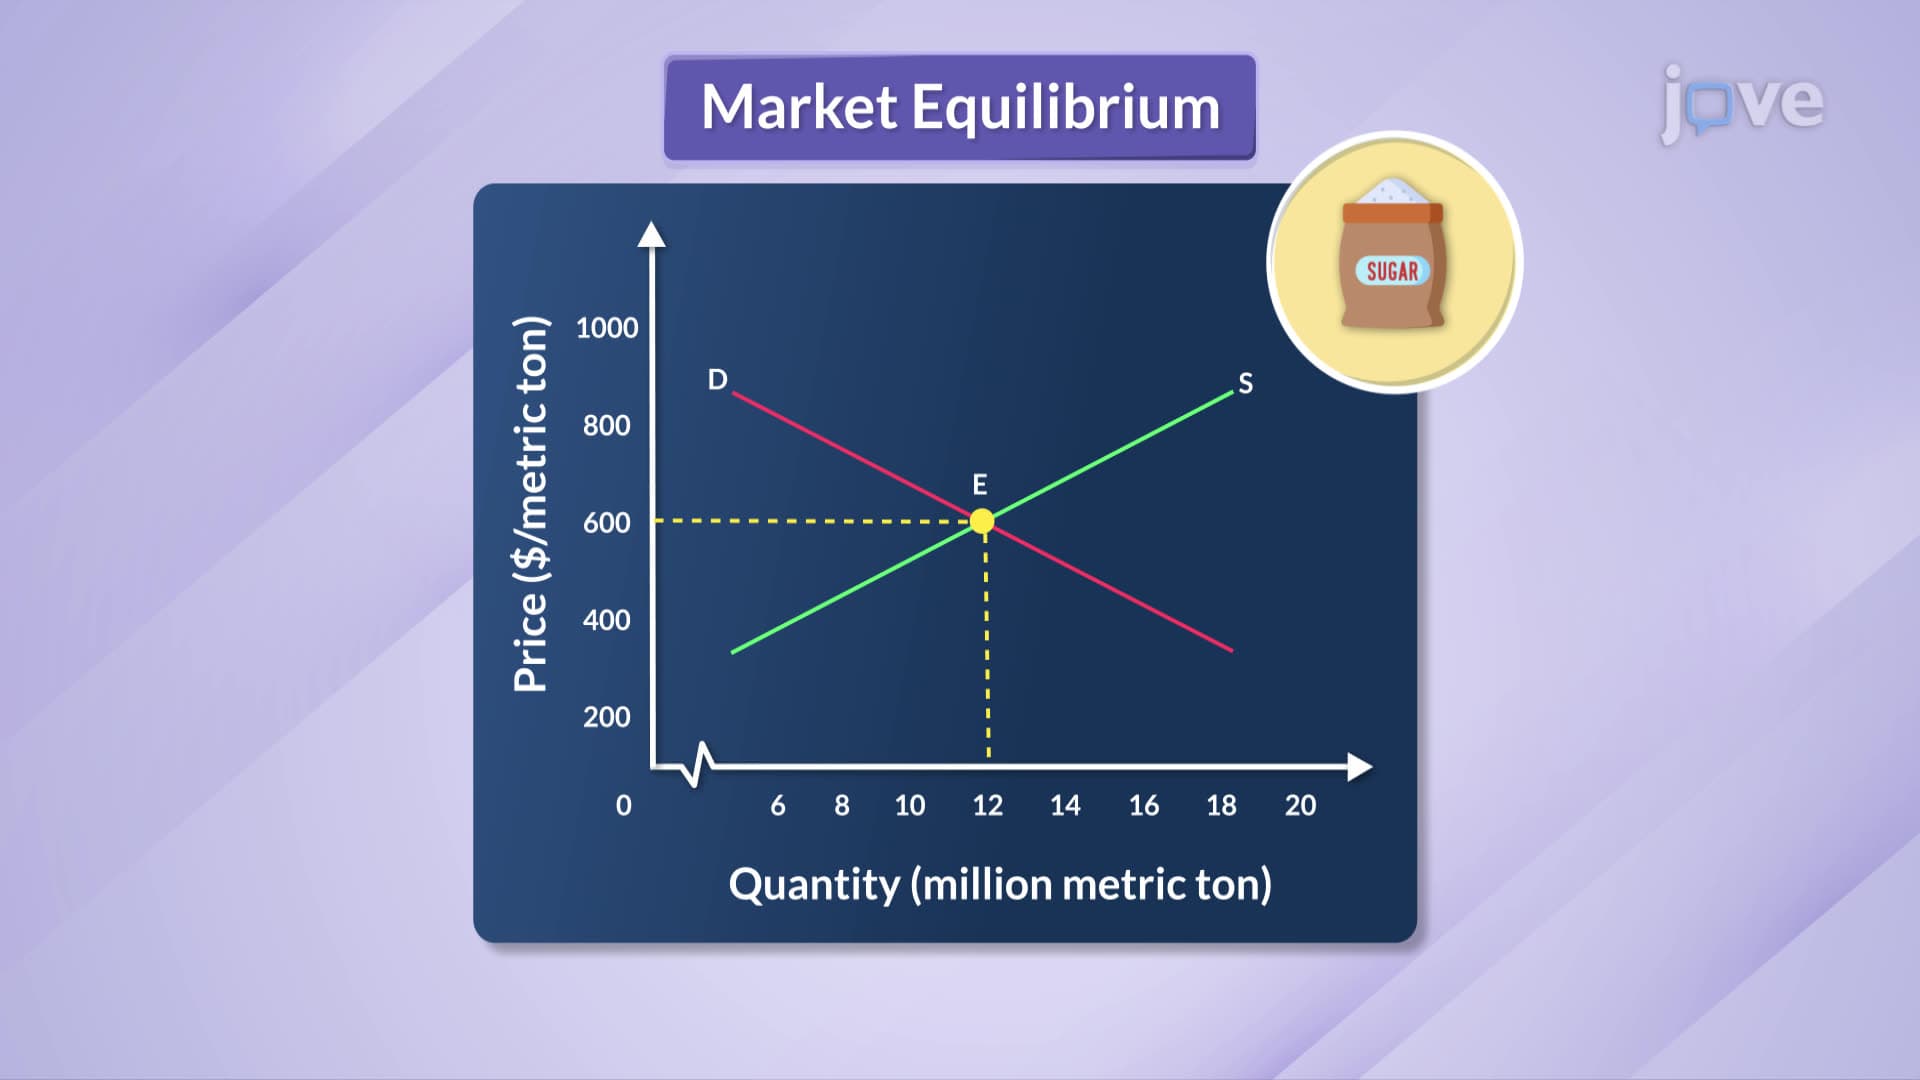
Supply curve mathematics appears frequently in standardized tests, from AP Microeconomics to college economics courses. Students might encounter problems asking them to calculate producer surplus using supply functions, determine equilibrium points where supply meets demand, or analyze how supply shifts affect market outcomes. In practice, companies like Amazon use sophisticated supply models to optimize inventory levels, while agricultural commodity traders rely on supply functions to predict seasonal price movements. The mathematical representation bridges theoretical economics with practical business decision-making, making it a cornerstone concept for students pursuing business, economics, or policy careers.
Related Micro-courses