10 Concepts
21 Concepts
12 Concepts
8 Concepts
22 Concepts
20 Concepts
14 Concepts
12 Concepts
11 Concepts
7 Concepts
14 Concepts
8 Concepts
11 Concepts
22 Concepts
21 Concepts
21 Concepts
15 Concepts
22 Concepts
9 Concepts
6 Concepts
Consumer behavior examines how individuals make purchasing decisions within budget constraints to maximize satisfaction. This comprehensive course covers utility maximization theory, exploring how consumers balance preferences through indifference curves, budget constraints, and marginal utility principles. Students learn to analyze real-world American consumer choices using economic models taught by JoVE Coach.
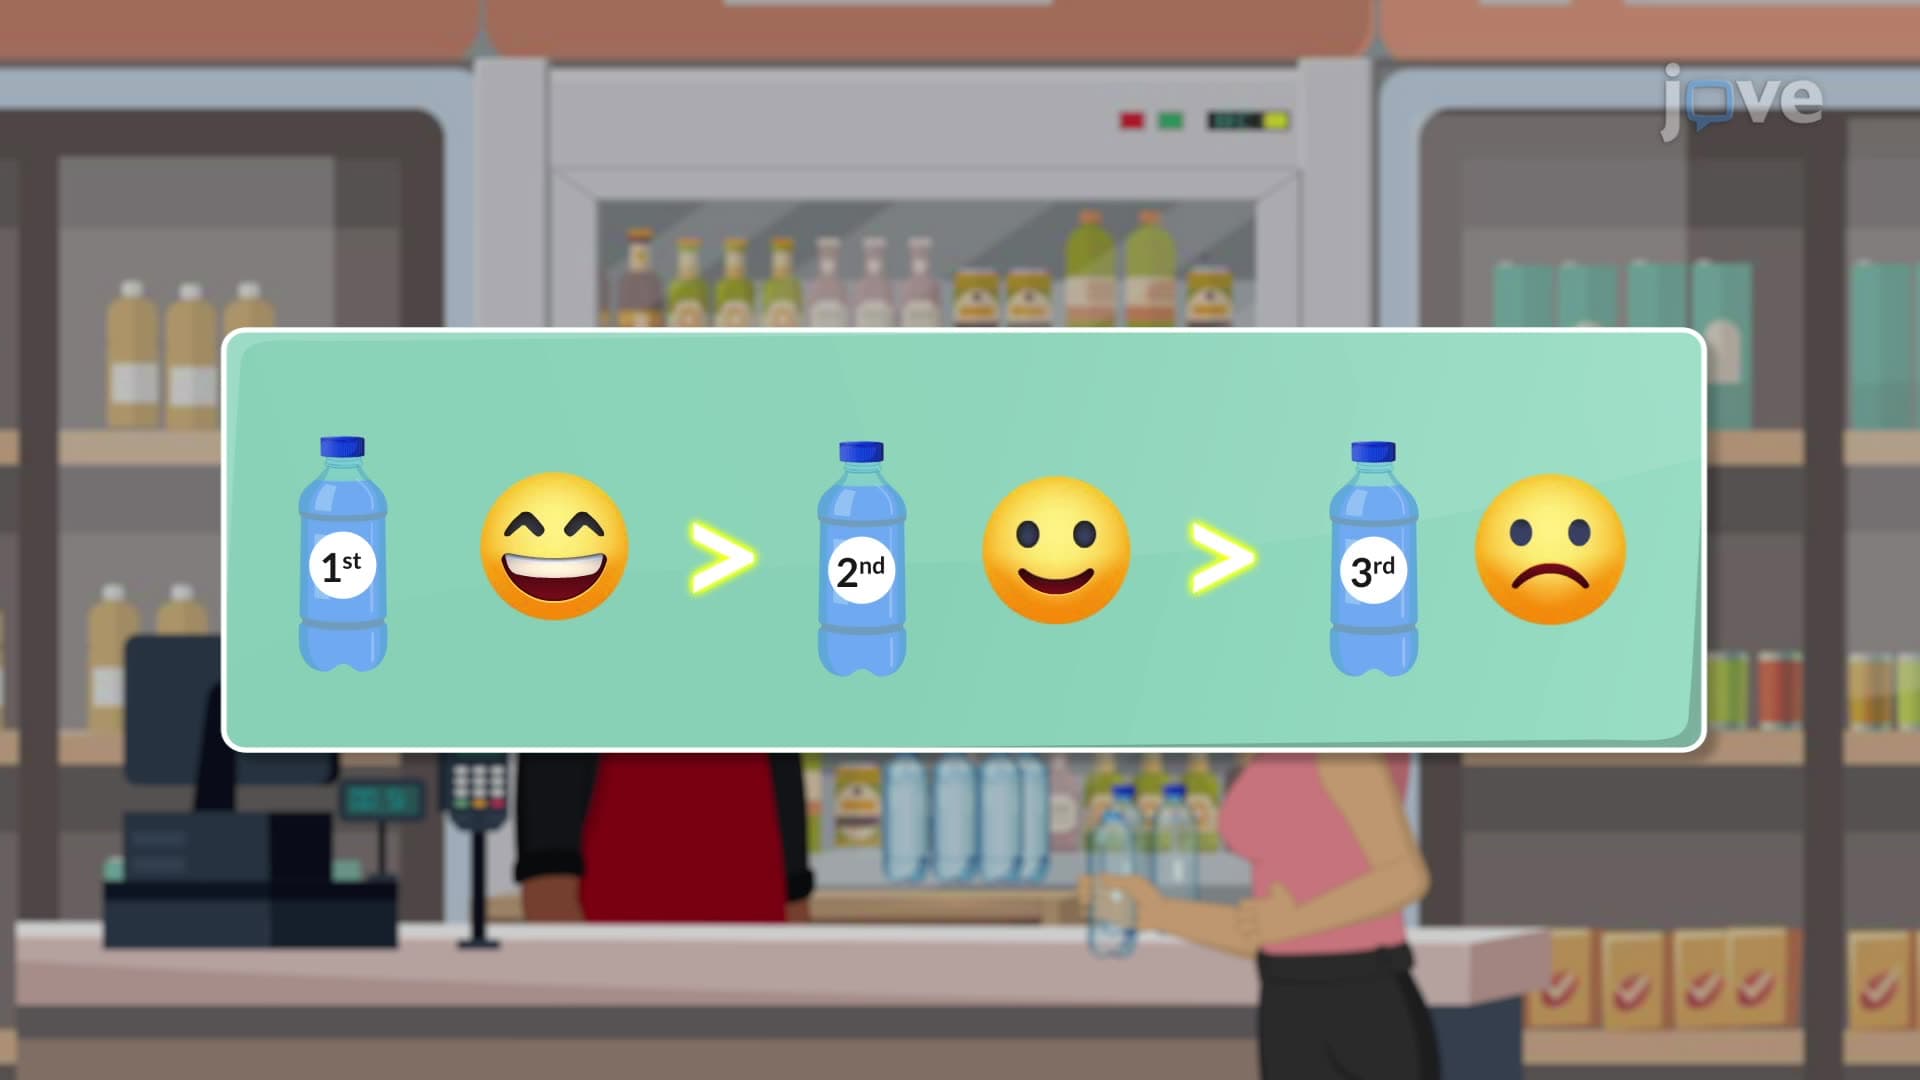
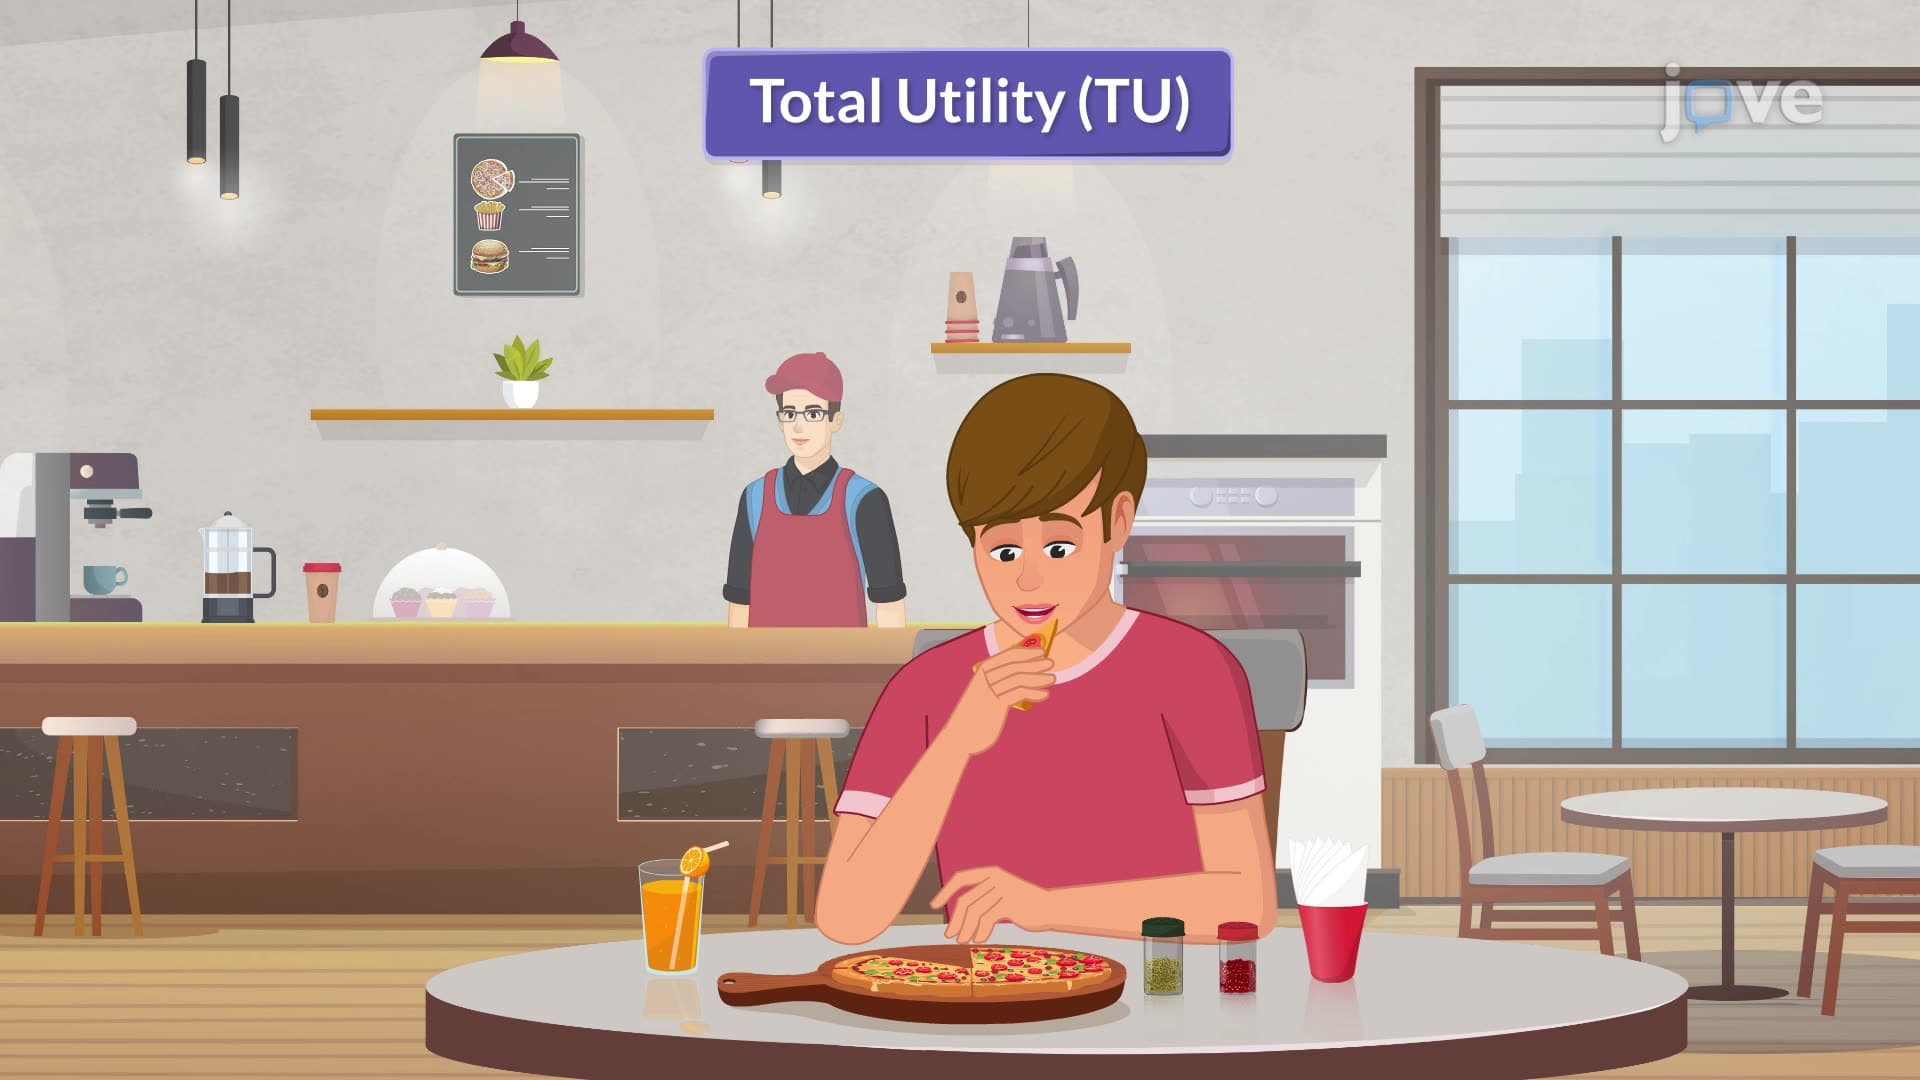
1. Utility Theory and Consumer Satisfaction Utility represents the satisfaction consumers derive from goods and services, measured through cardinal (quantifiable utils) or ordinal (ranked preferences) approaches. Modern economics favors ordinal measurement, where consumers rank preferences without specifying exact satisfaction differences. For example, an American college student might prefer Netflix subscriptions over movie theater visits but cannot quantify the exact utility difference. The law of diminishing marginal utility explains why each additional unit of consumption provides decreasing satisfaction, like how the fifth slice of pizza provides less enjoyment than the first.
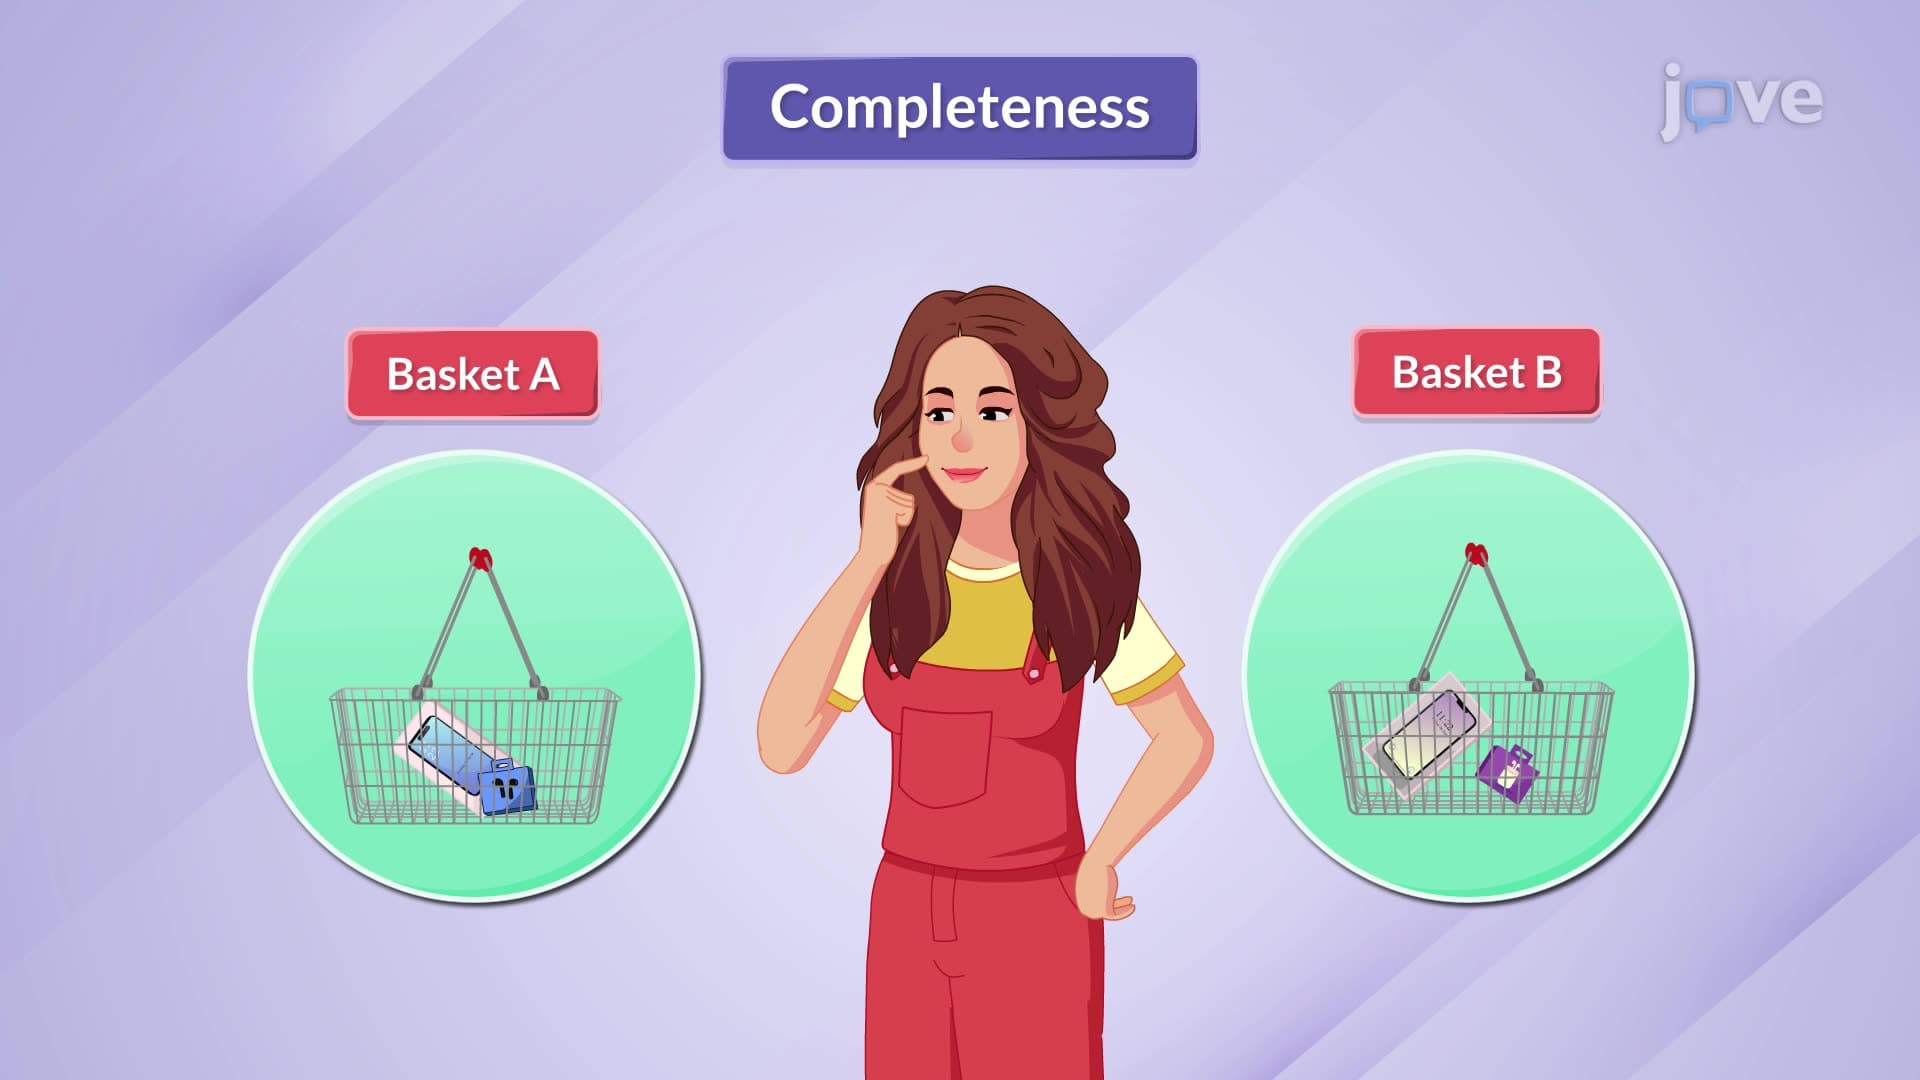
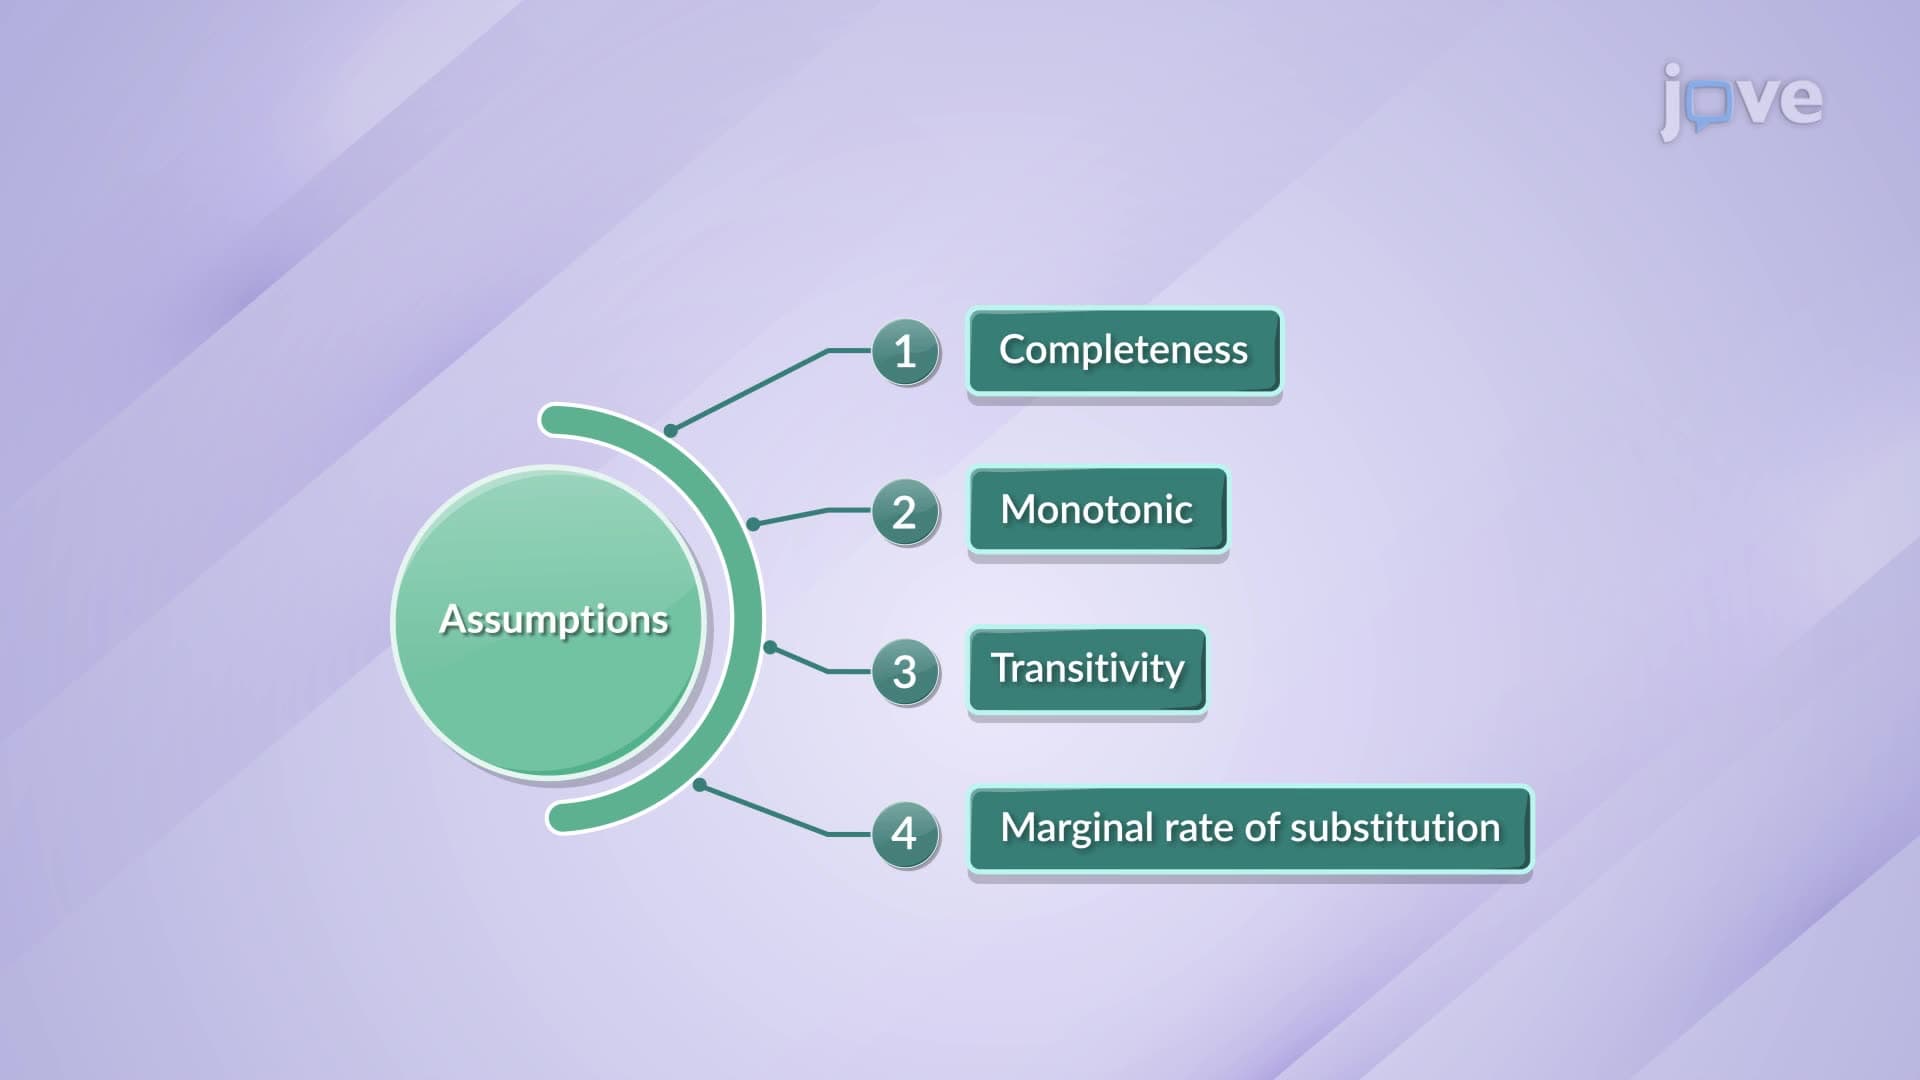
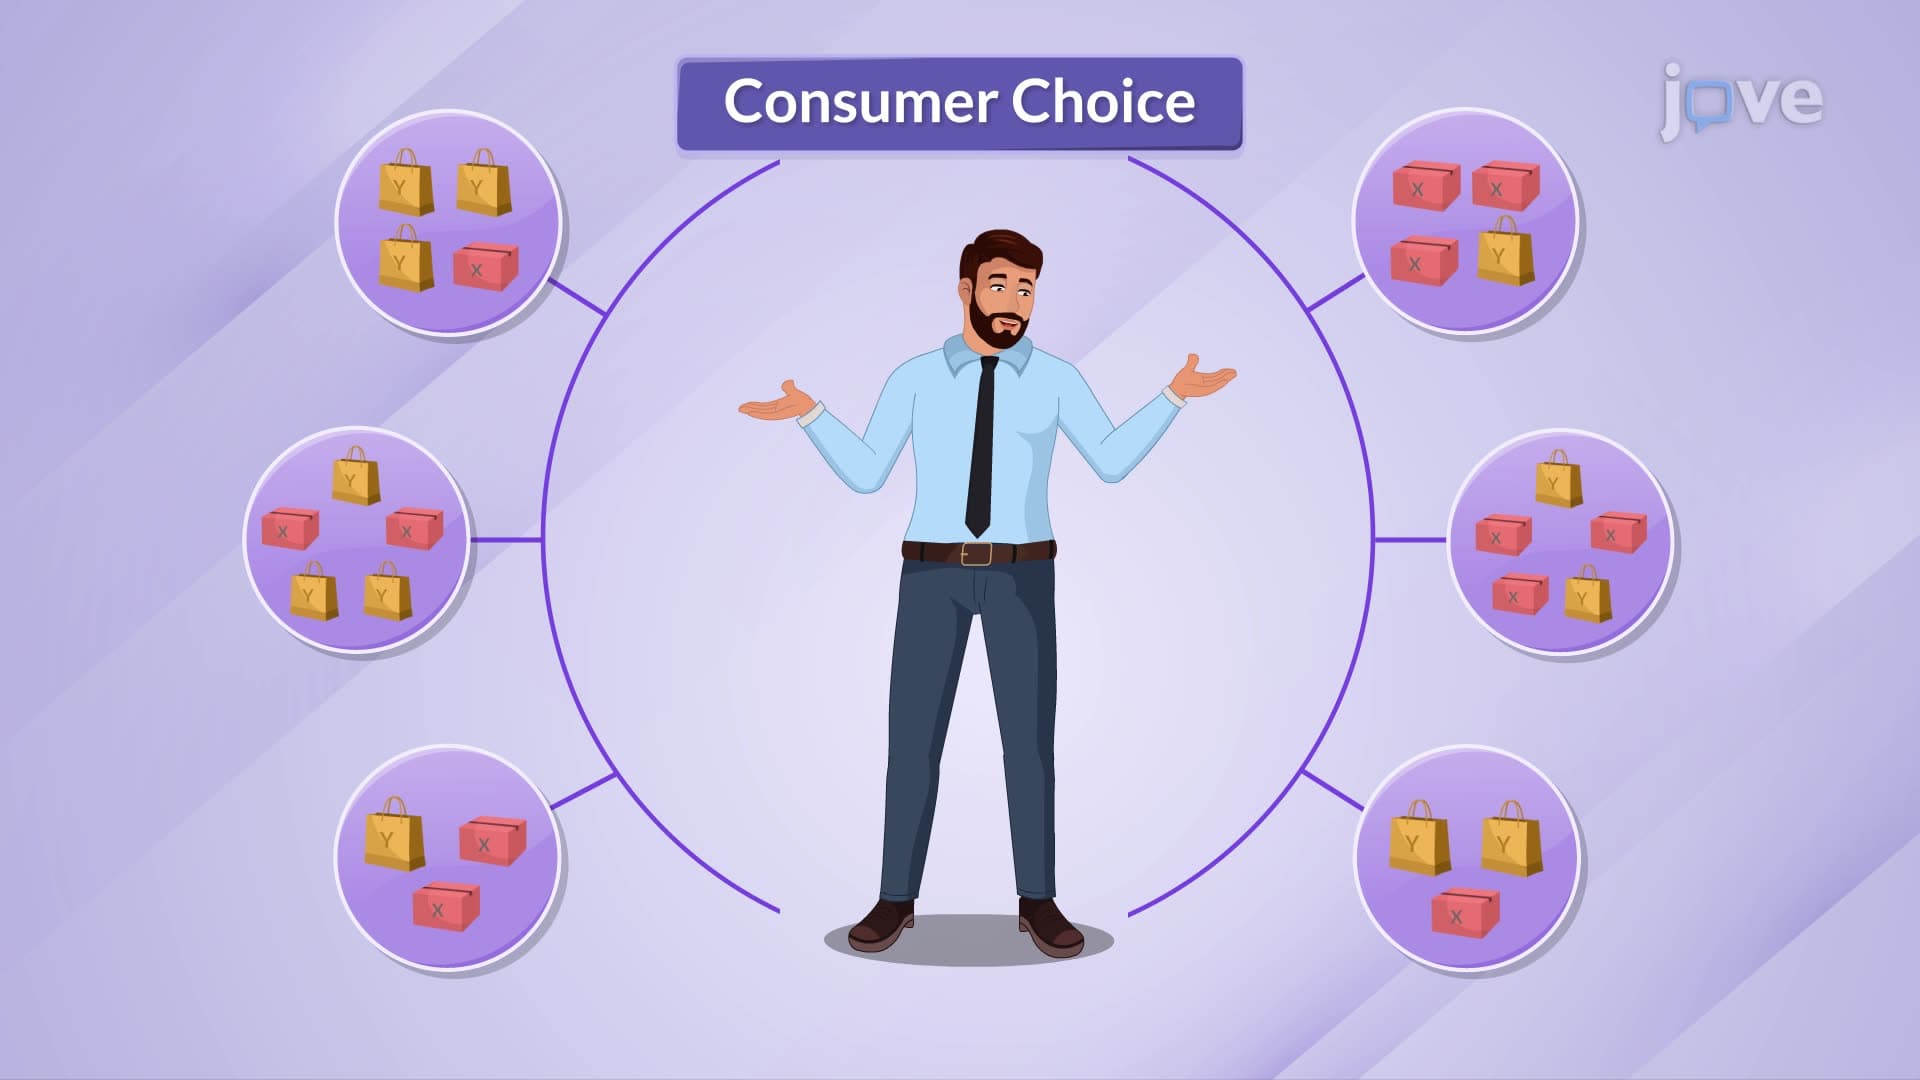
2. Consumer Preferences and Market Baskets Consumer preferences follow key assumptions enabling economic modeling. Completeness allows consumers to compare any two market baskets containing different good combinations. Transitivity ensures logical consistency-if someone prefers iPhone over Samsung and Samsung over Google Pixel, they must prefer iPhone over Google Pixel. Monotonic preferences assume consumers prefer more goods to fewer, explaining why American shoppers choose larger quantities when prices equal. These assumptions help economists predict consumer behavior in real markets, from grocery stores to online retailers like Amazon.
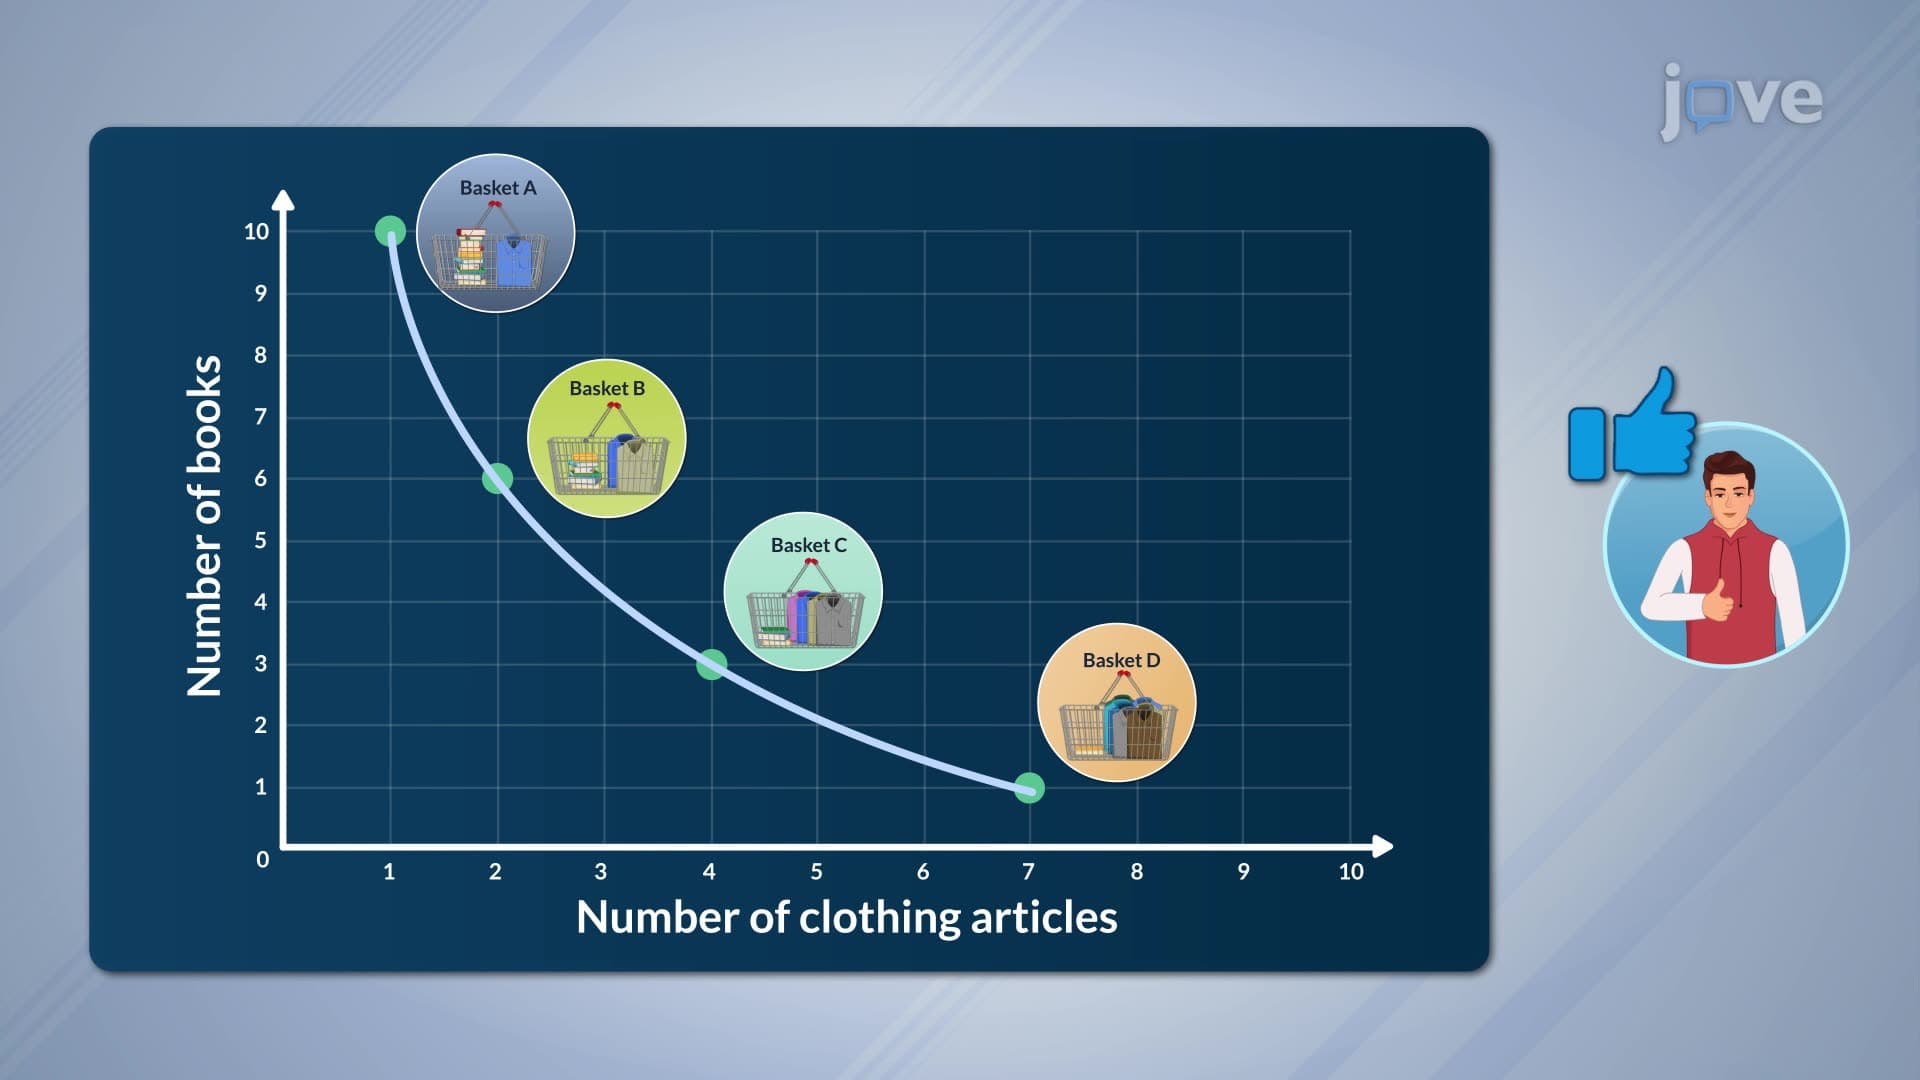
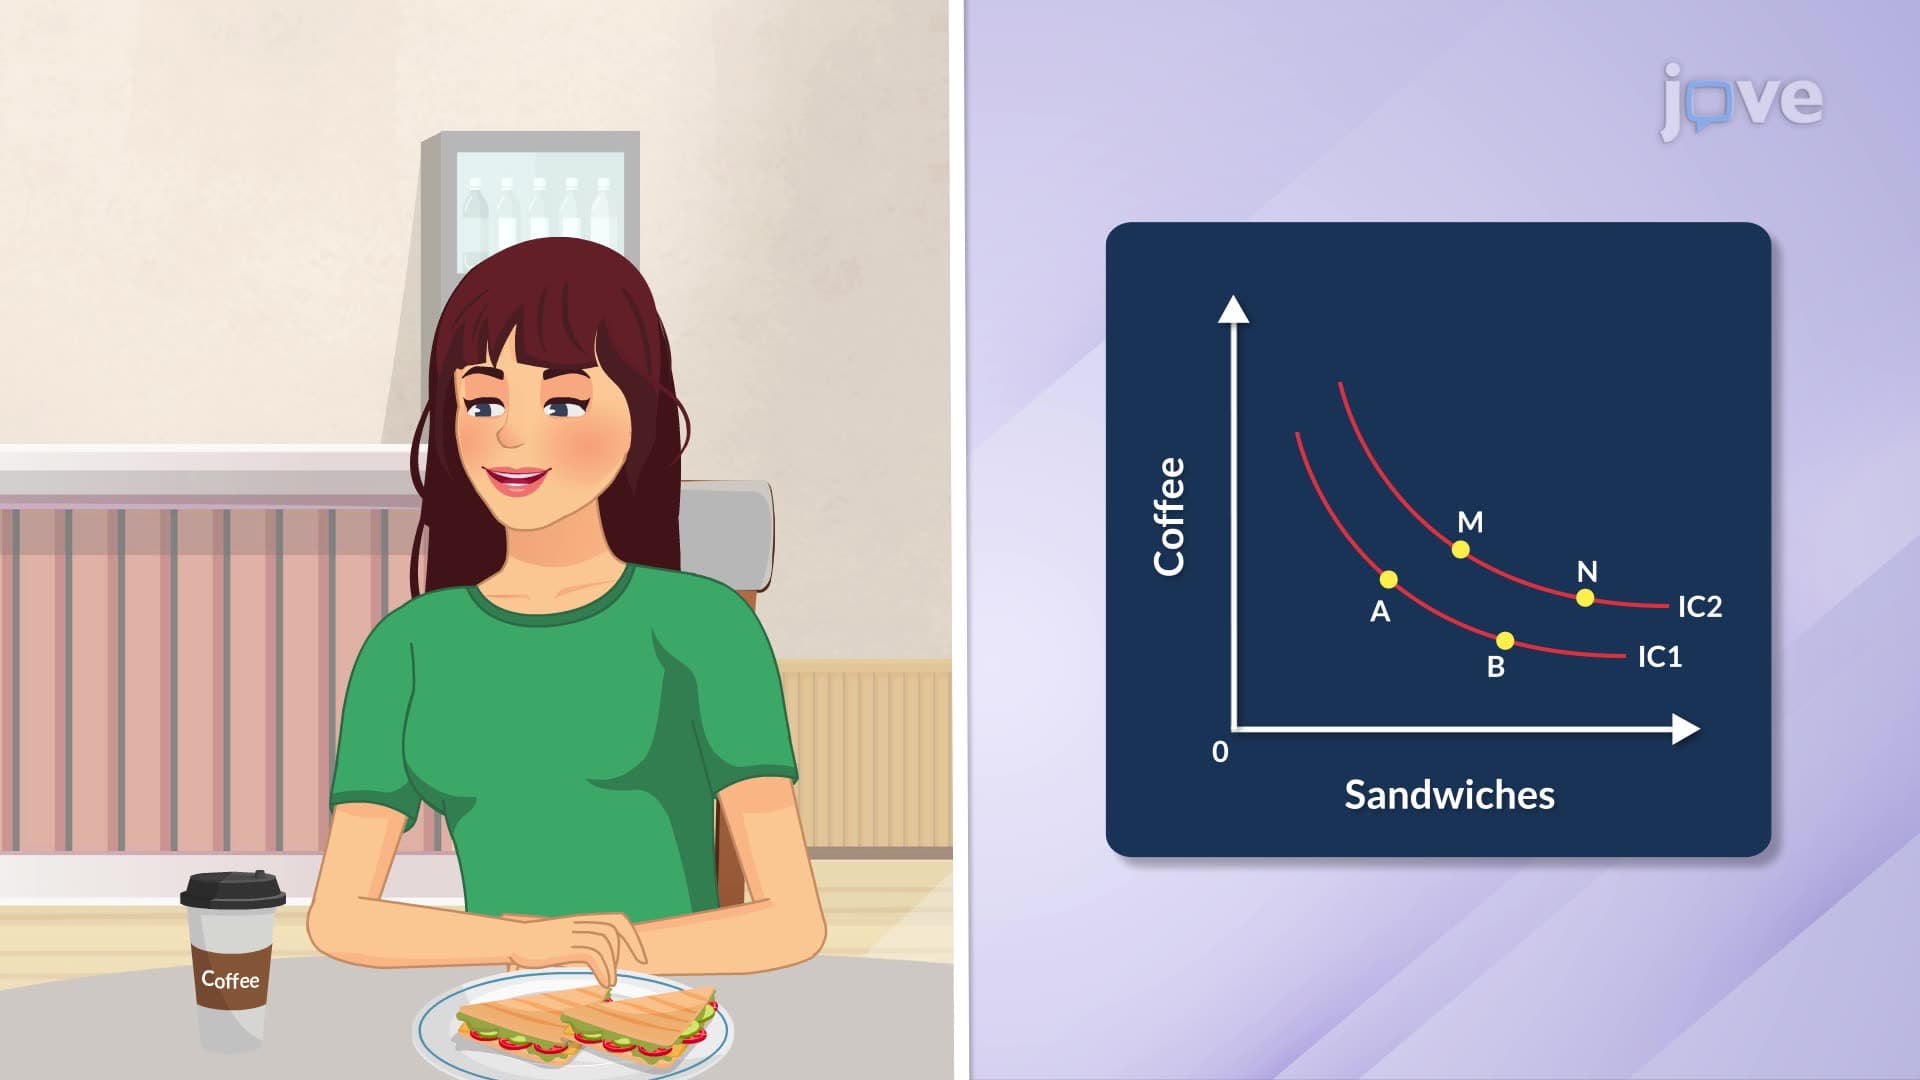
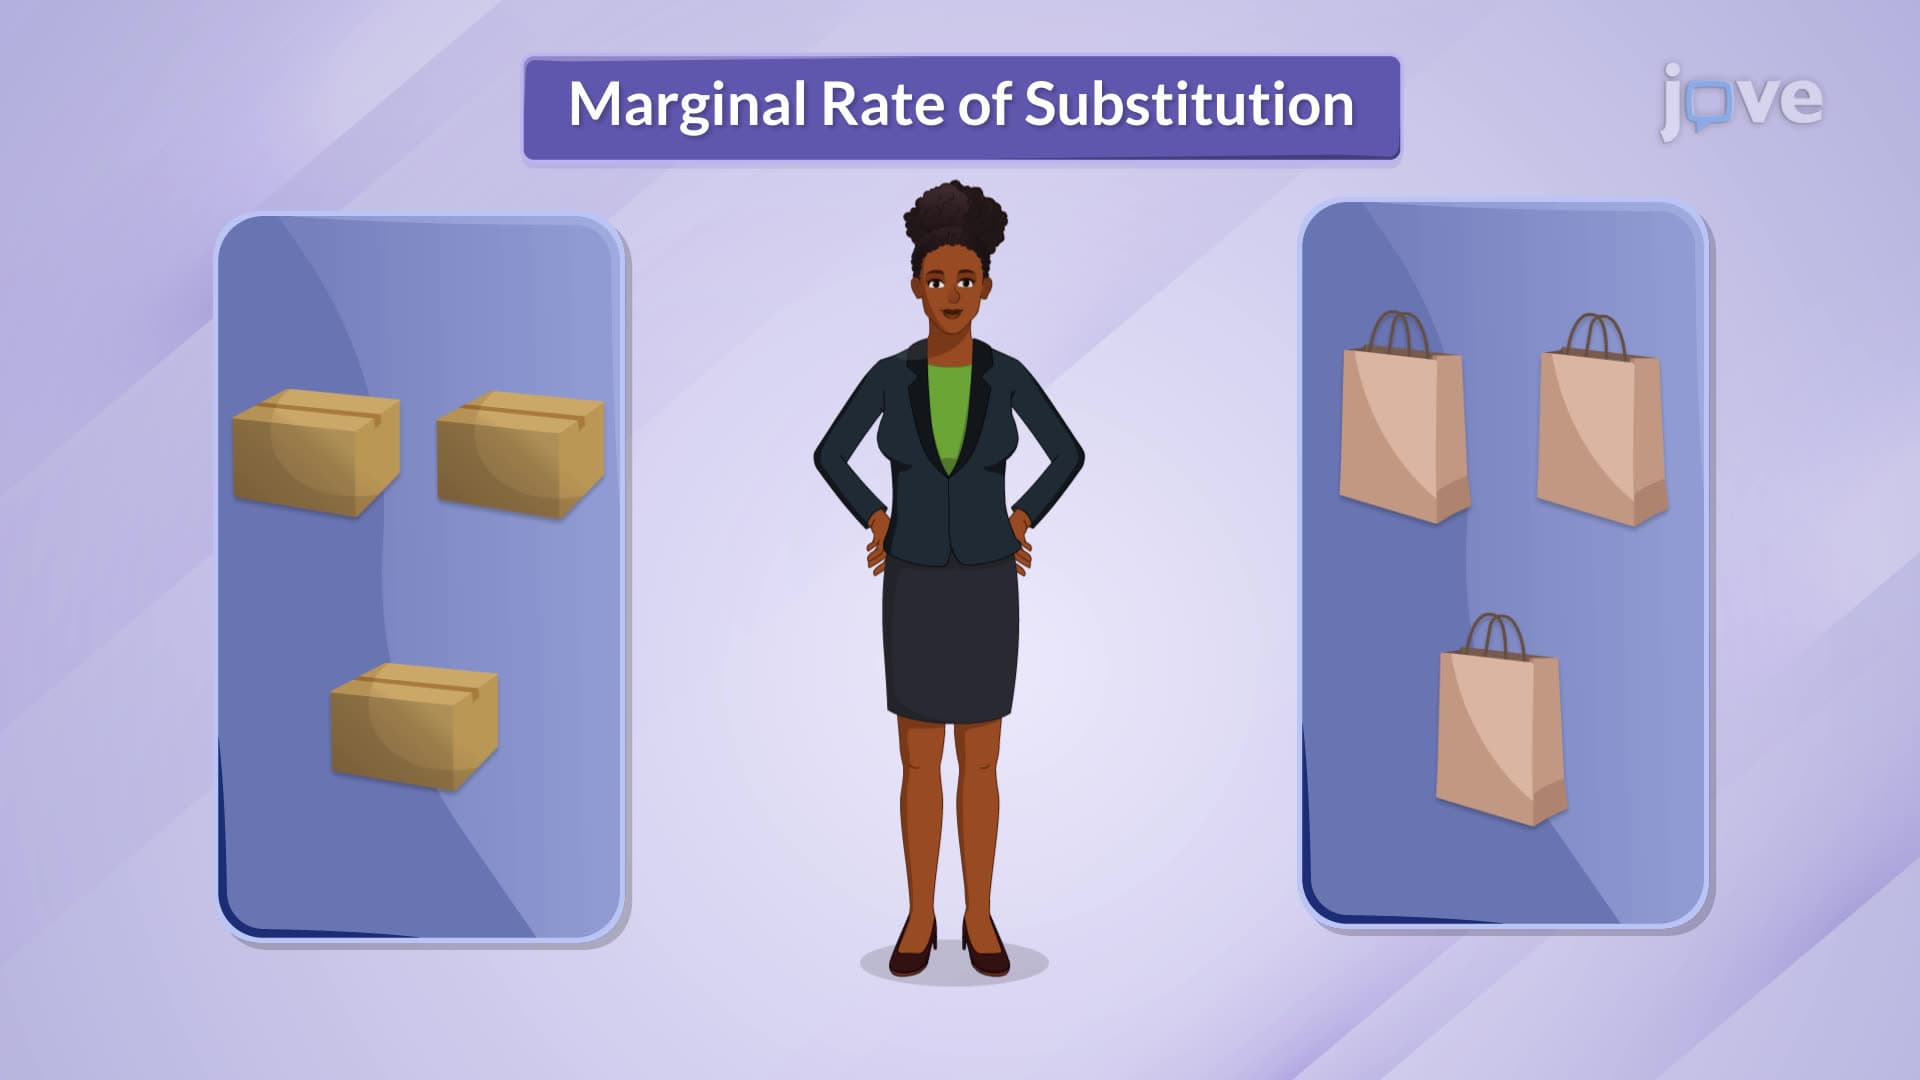
3. Indifference Curves and Consumer Choice Indifference curves graphically represent combinations of two goods providing equal satisfaction to consumers. These curves slope downward, showing trade-offs between goods while maintaining constant utility. For instance, an American teenager might be equally satisfied with various combinations of video games and concert tickets. The curves' convex shape reflects diminishing marginal rate of substitution-consumers become less willing to trade away goods they possess in smaller quantities. Perfect substitutes create straight-line curves, while perfect complements form right-angled curves, like smartphones and phone cases.
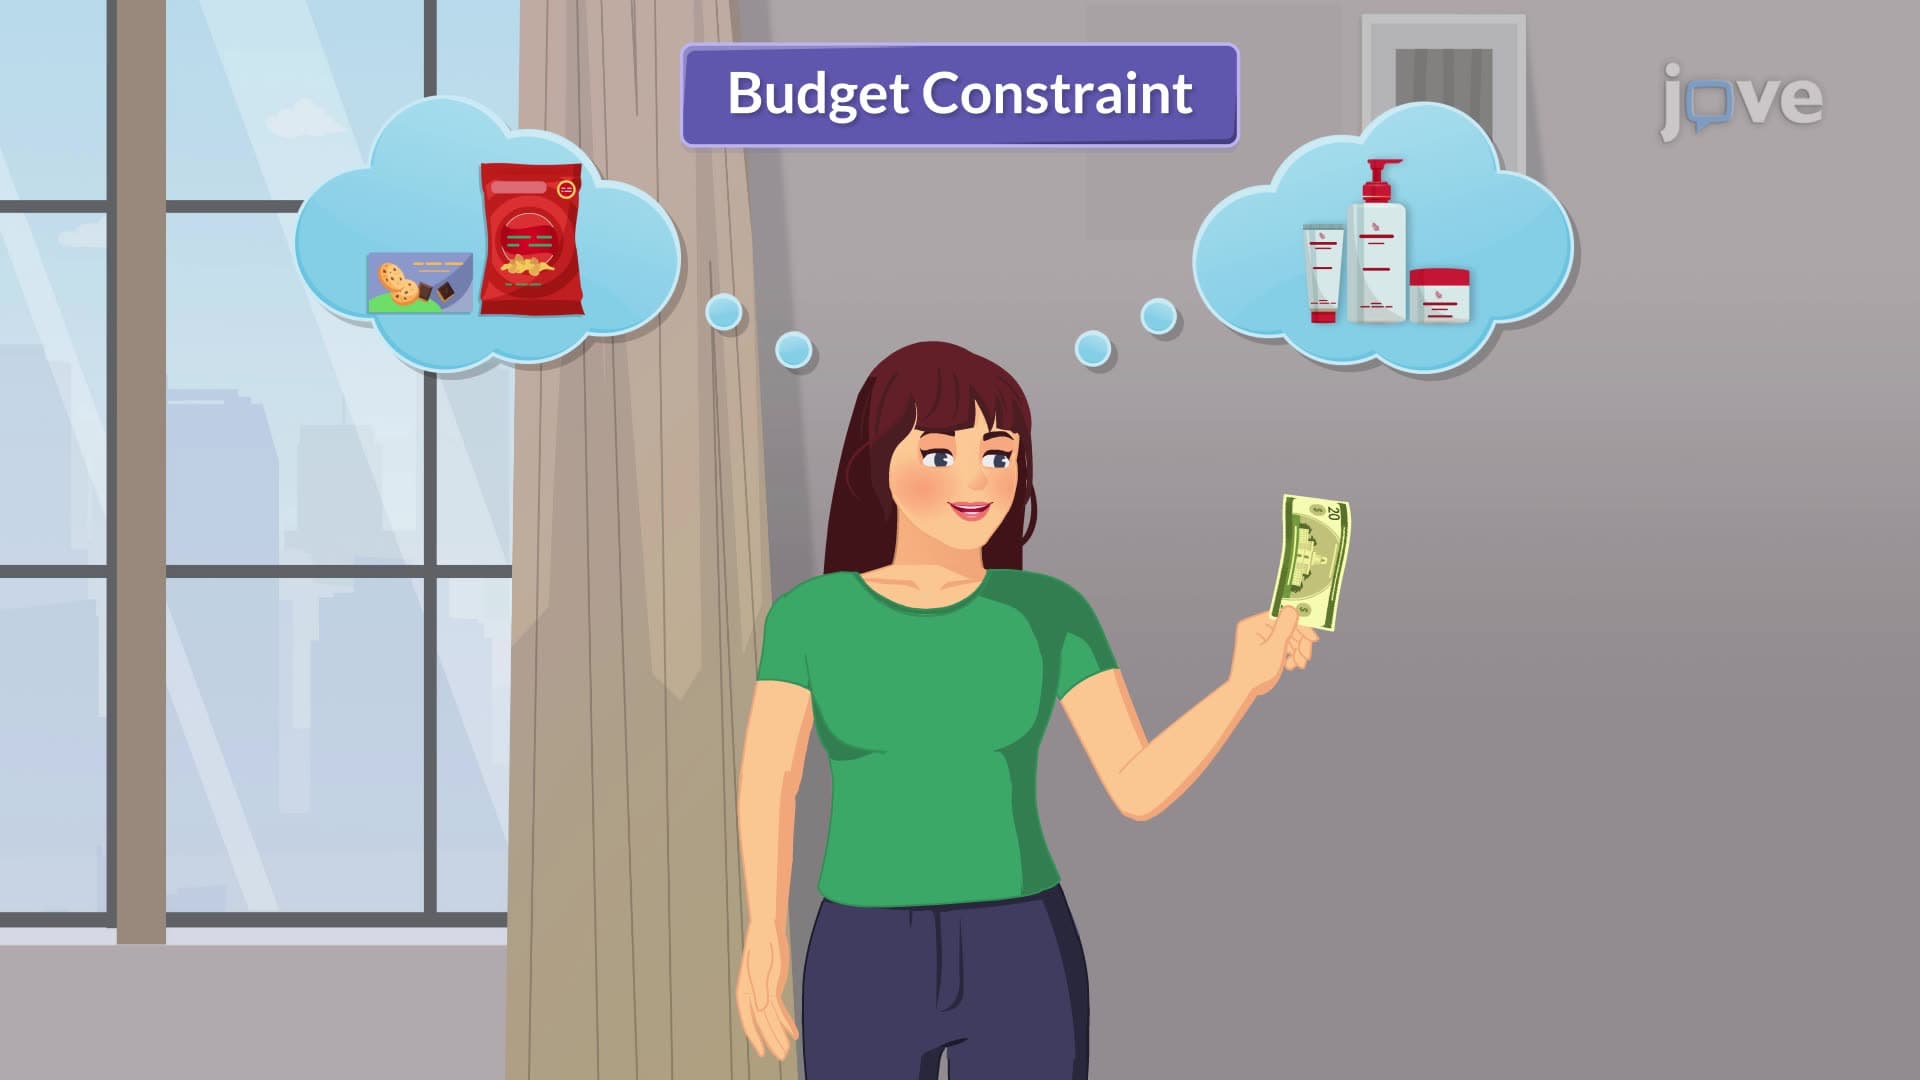
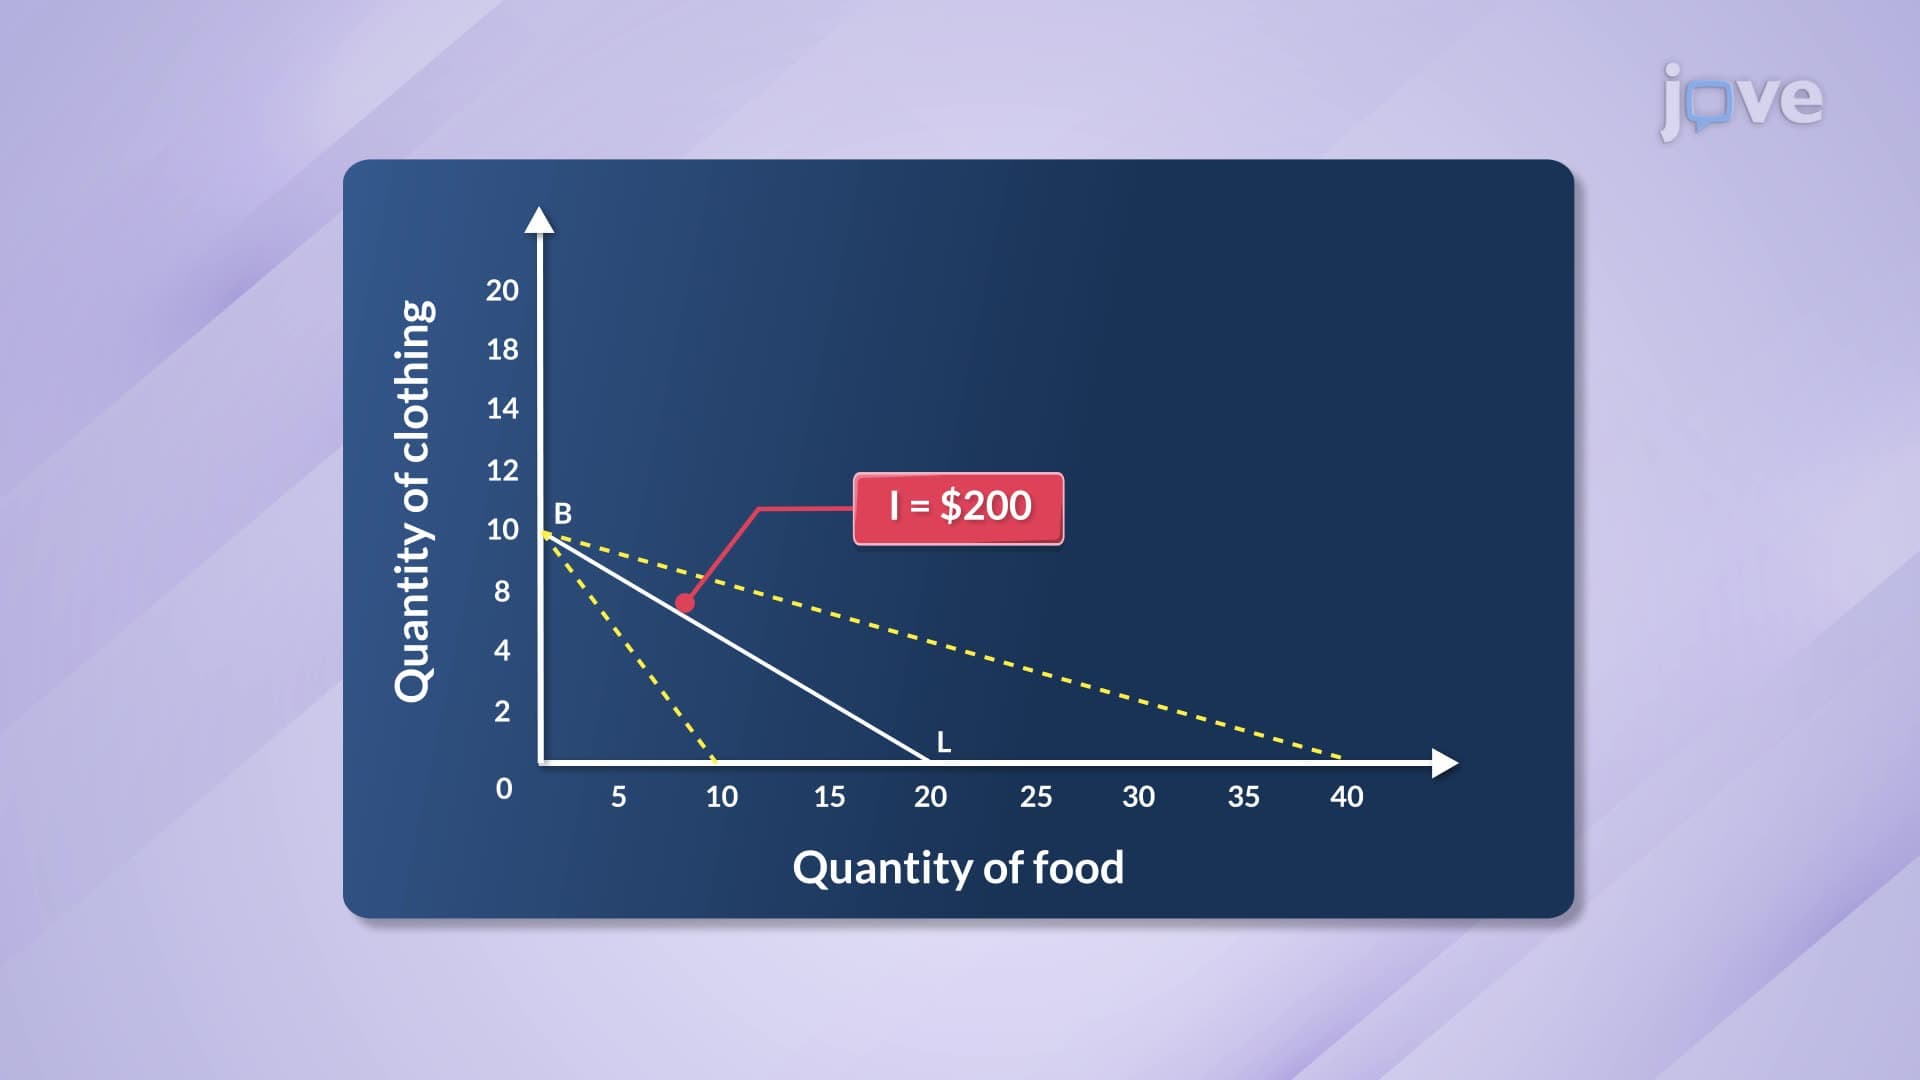
4. Budget Constraints and Consumer Purchasing Power Budget constraints represent affordable good combinations given income and prices, typically shown as straight budget lines on graphs. The line's slope equals the price ratio of two goods, indicating trade-off rates. When prices change, budget lines rotate-decreasing food prices allow consumers to afford more food with the same income. Income changes shift the entire budget line parallel, expanding or contracting purchasing possibilities. For example, when gasoline prices rise, American families adjust spending on transportation versus other goods, demonstrating how budget constraints influence consumer choices in real markets.
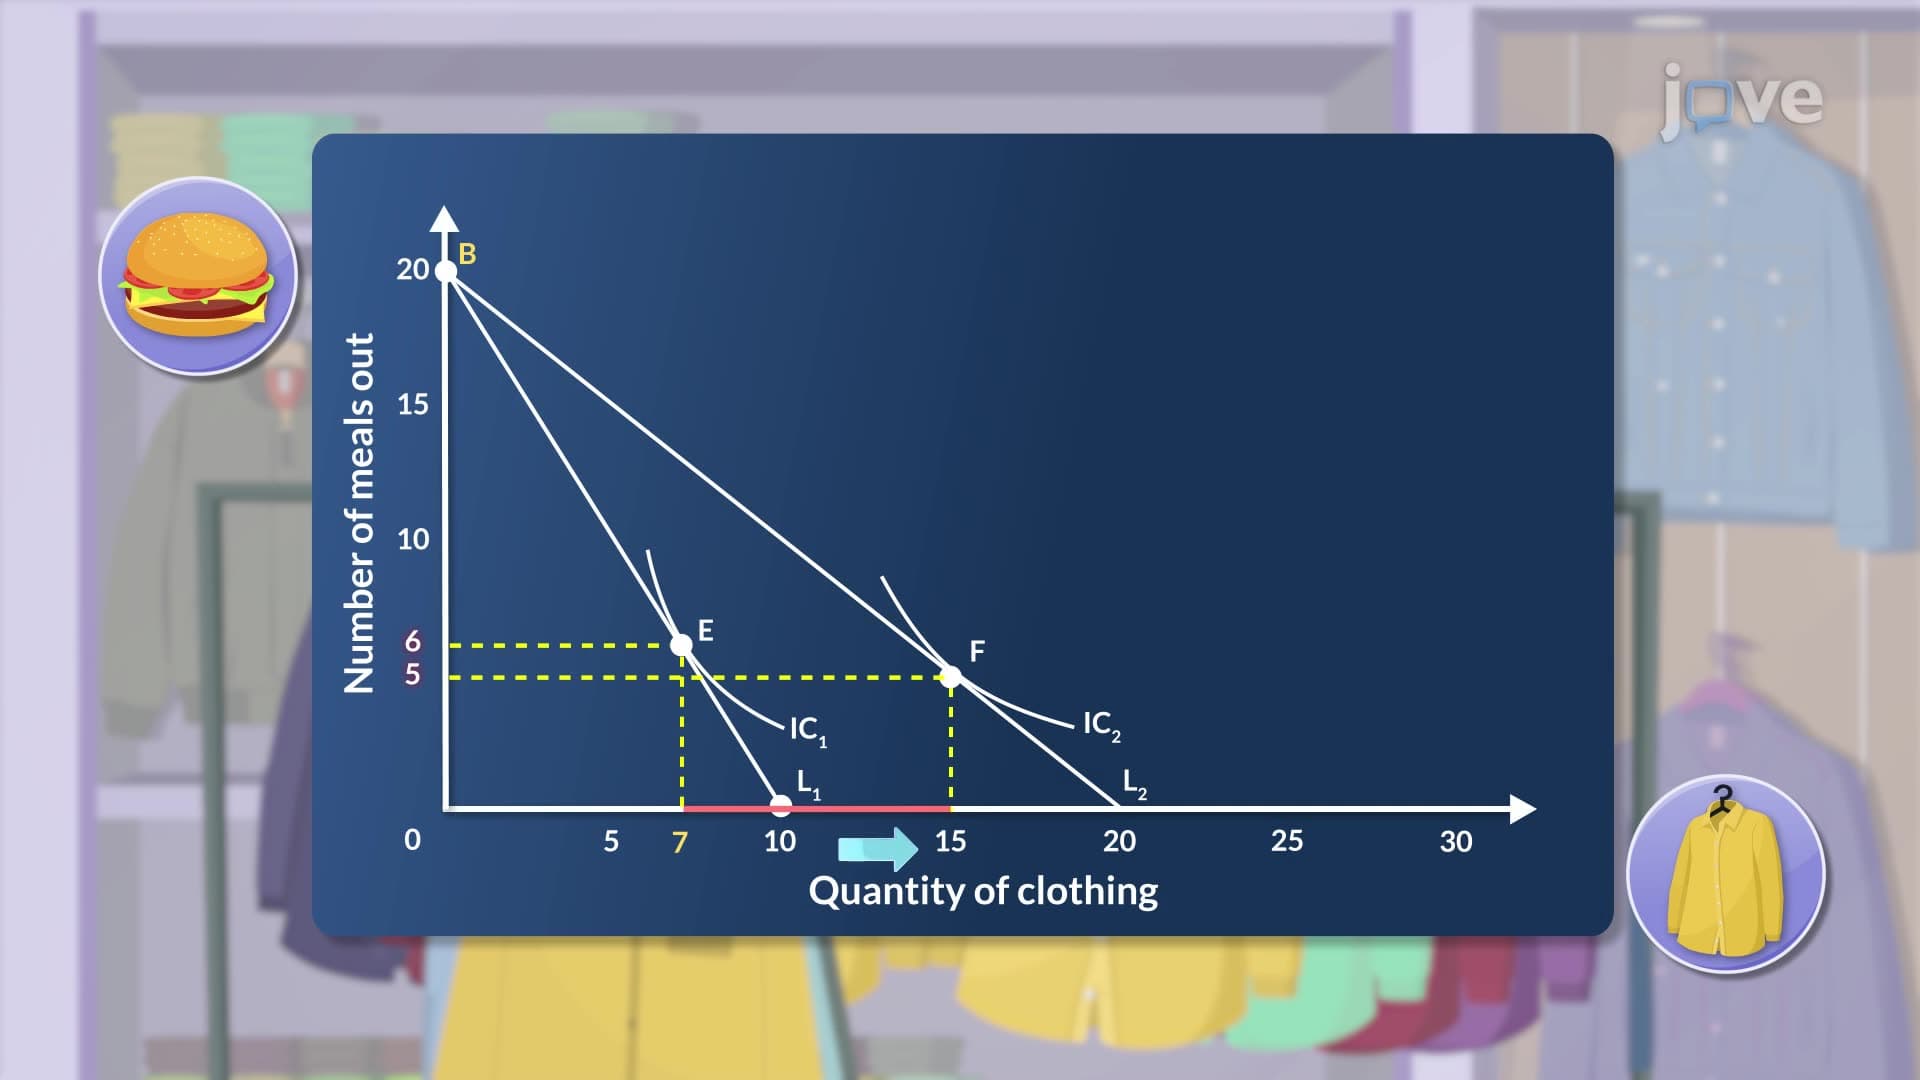
5. Utility Maximization and Optimal Consumer Choice Consumers maximize satisfaction by choosing combinations where their highest affordable indifference curve touches the budget line. At this tangency point, the marginal rate of substitution equals the price ratio, indicating optimal resource allocation. This equilibrium represents the best possible outcome given budget limitations. American consumers demonstrate this principle when comparison shopping-they seek combinations of quality, price, and features that provide maximum value within their spending limits. Understanding this optimization helps explain purchasing patterns across different income levels and market conditions.
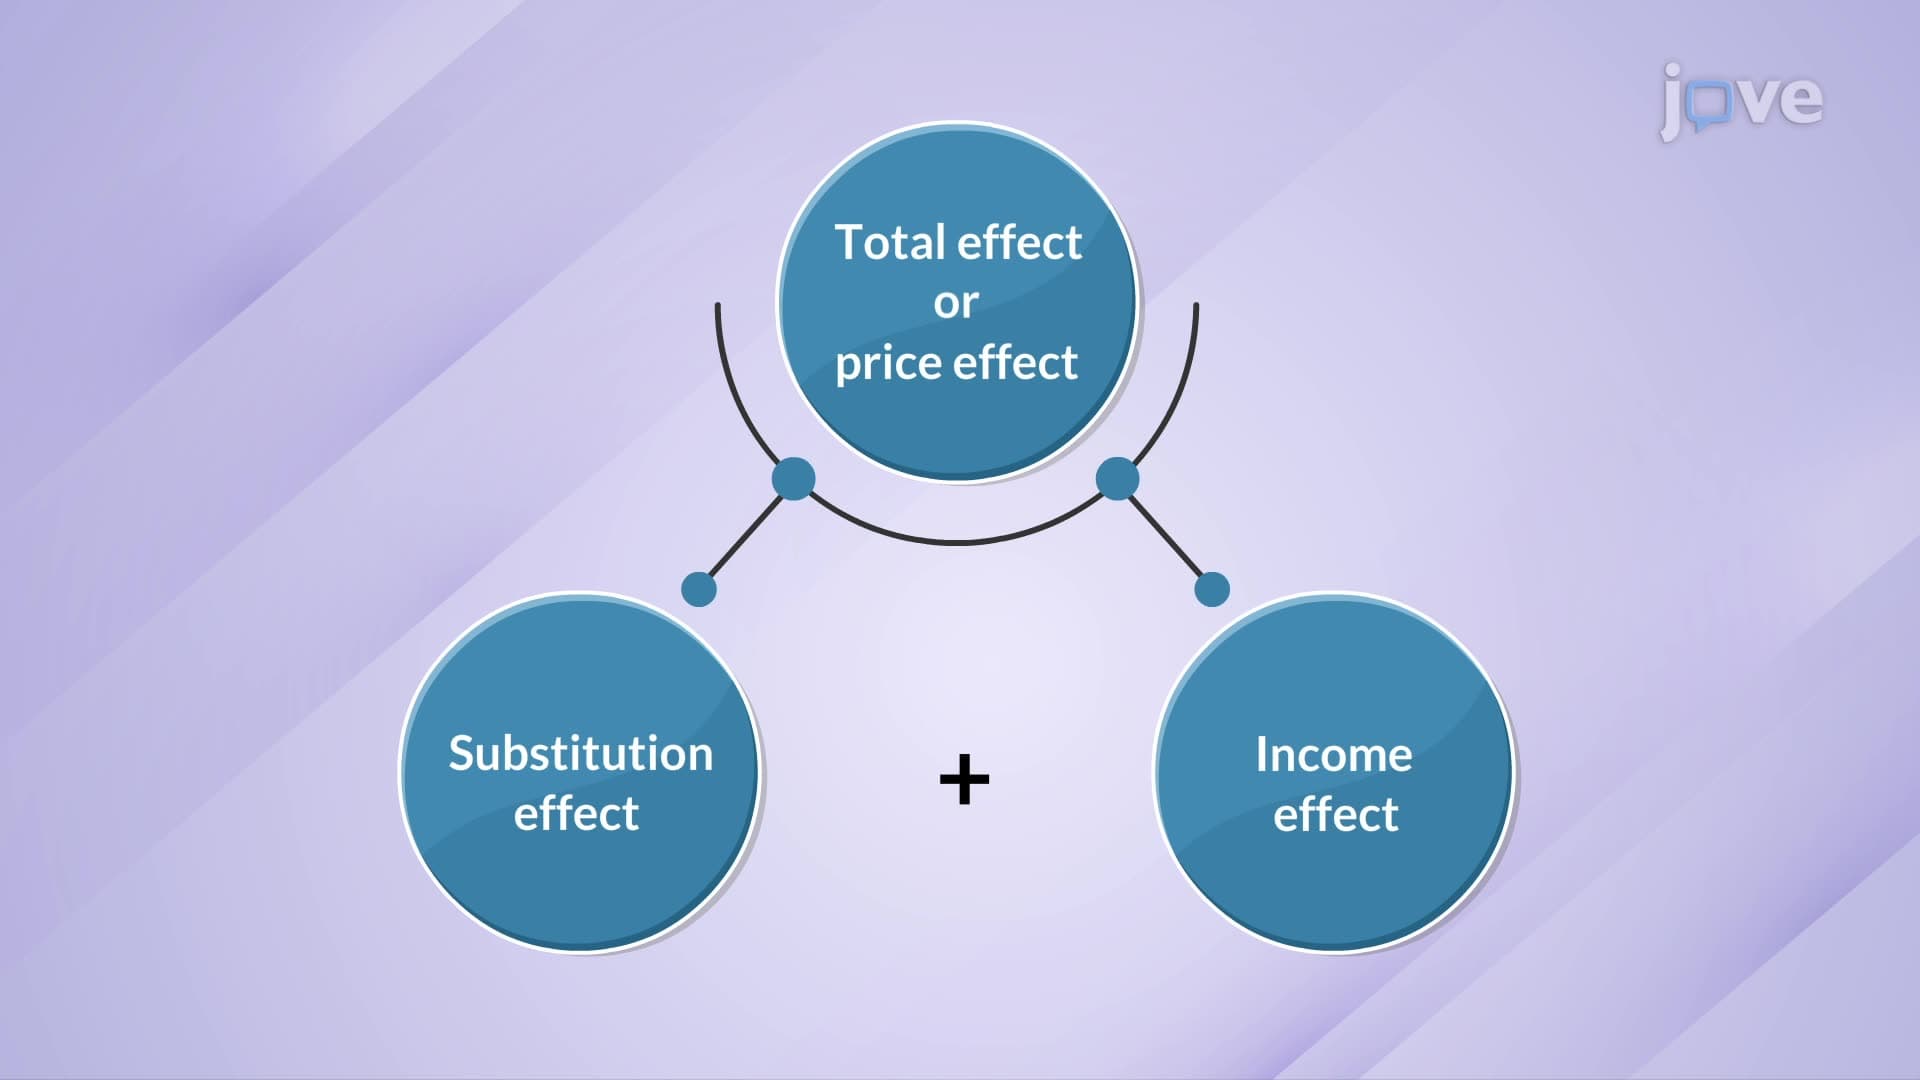
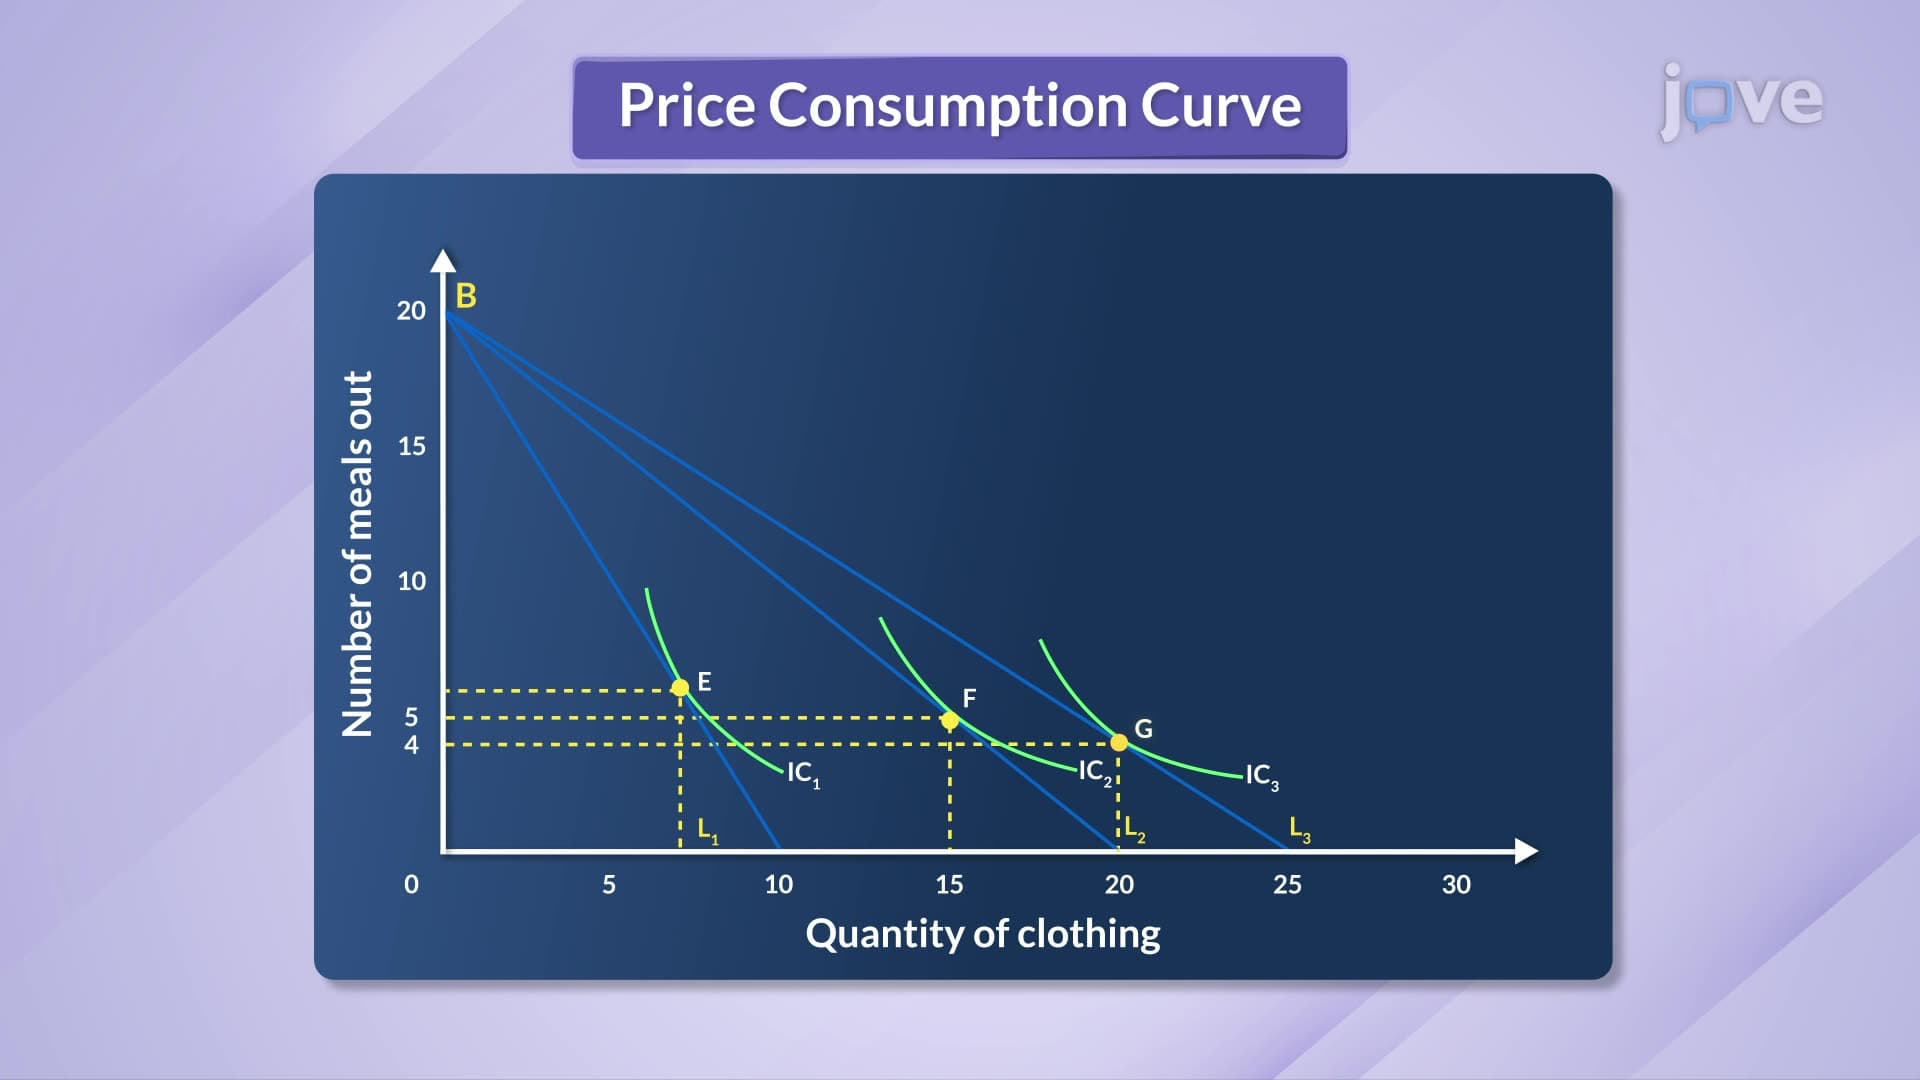
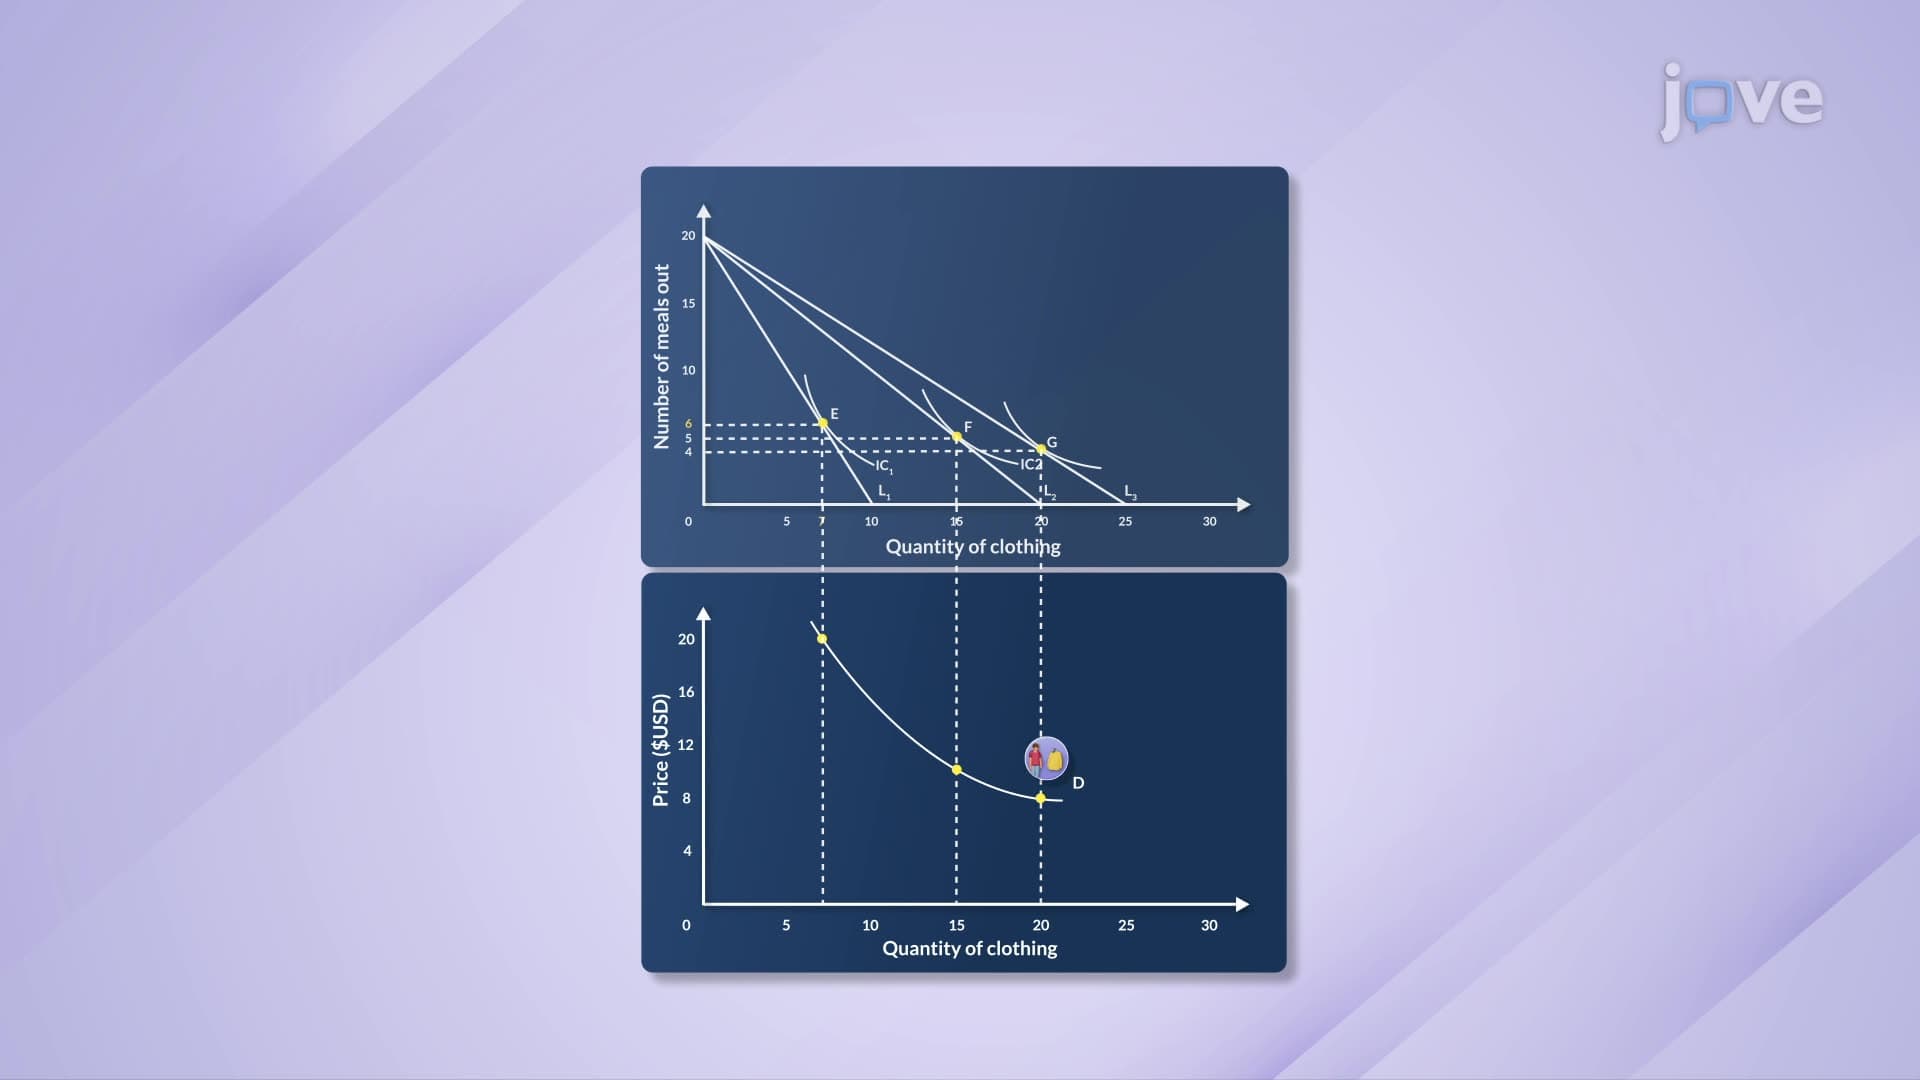
6. Price Effects and Consumer Response Price changes create total effects combining substitution and income effects on consumer behavior. Substitution effects occur when relative price changes make one good more attractive than alternatives. Income effects result from changes in purchasing power when prices shift. For example, when iPhone prices decrease, American consumers might buy more iPhones due to better relative value (substitution effect) and increased purchasing power (income effect). The price consumption curve connects equilibrium points at different prices, forming the foundation for individual demand curves that show quantity-price relationships.