Demand elasticity measures how consumer purchasing behavior responds to price changes and other market factors. This comprehensive course, delivered through JoVE Coach, explores price elasticity of demand, income elasticity, cross-price elasticity, and demand curve analysis using real-world examples from US markets including gasoline, smartphones, and ride-sharing services.
Understand the fundamental concept of demand and the law of demand using mathematical representations
Analyze how substitute and complementary goods affect demand curves in US markets
Identify the difference between normal goods, luxury goods, and inferior goods based on income changes
Learn to calculate price elasticity of demand using percentage and midpoint methods
Explore the five degrees of demand elasticity from perfectly elastic to perfectly inelastic
Apply cross-price elasticity concepts to understand relationships between products
Analyze income elasticity of demand to classify goods and predict consumer behavior
Understand how factors like time horizon, substitutes, and necessity vs. luxury affect elasticity
1. Demand Fundamentals and Mathematical Representation
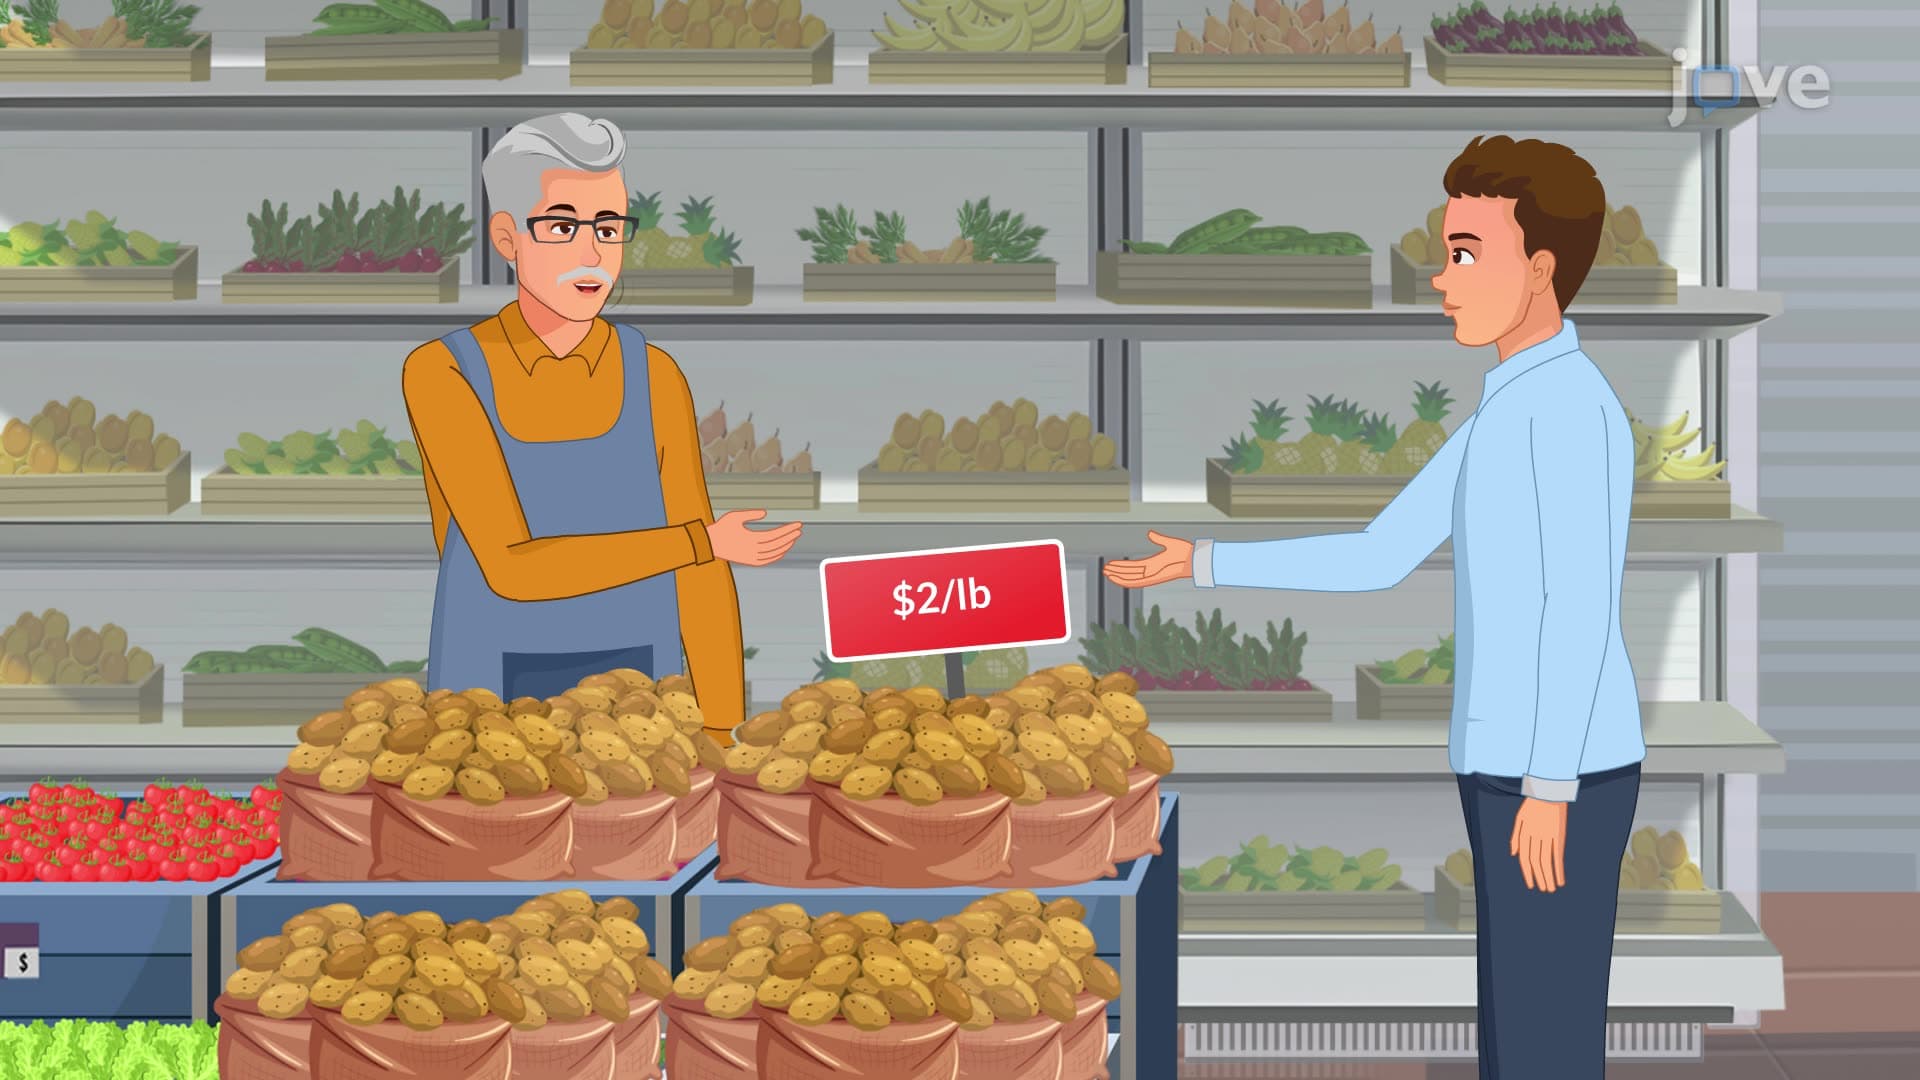
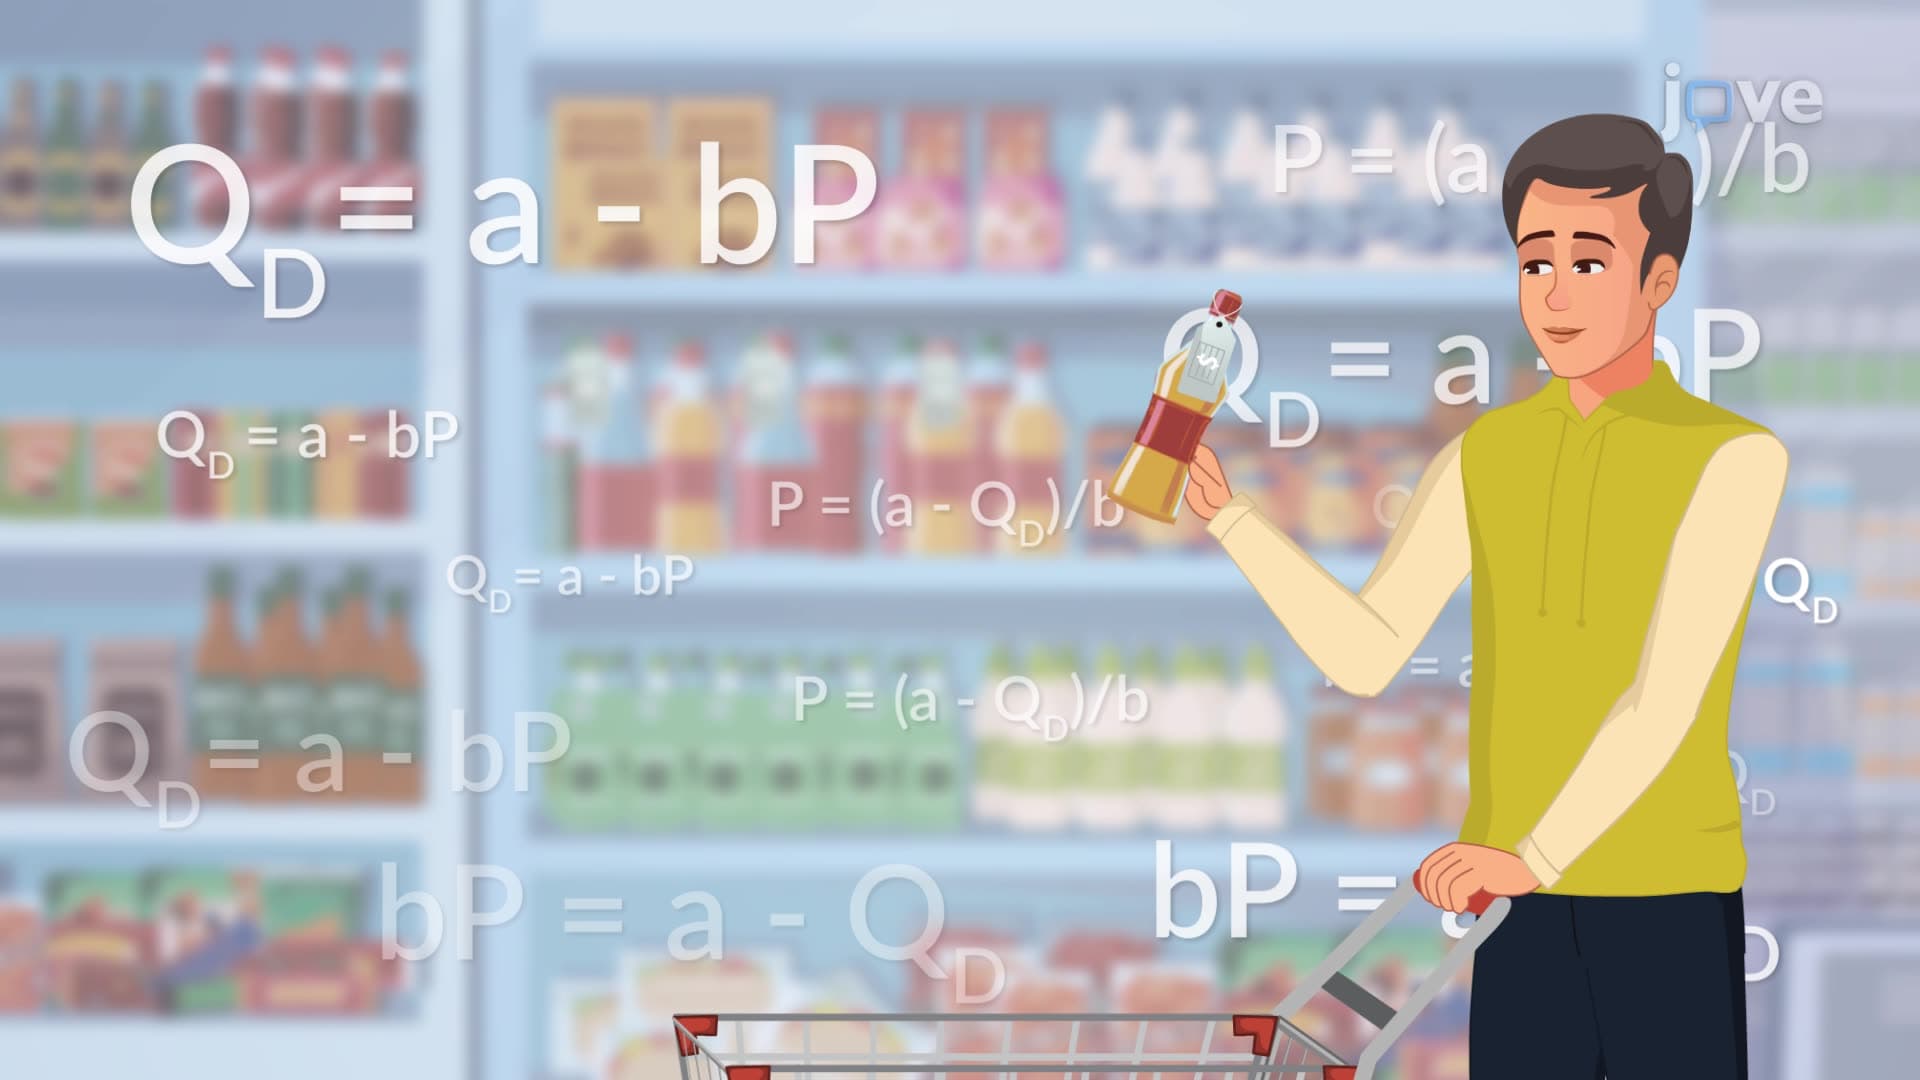
Consumer demand represents both willingness and ability to purchase goods at specific prices. The law of demand demonstrates the inverse relationship between price and quantity demanded, illustrated through demand curves that slope downward. Mathematical representation using linear equations like QD = a - bP helps quantify consumer behavior. US examples include cafe owners purchasing potatoes at varying prices, demonstrating how businesses respond to cost changes. Market demand combines individual consumer demands, showing aggregate purchasing behavior across entire markets like the US smartphone or automotive industries.
2. Types and Measurement of Demand Elasticities
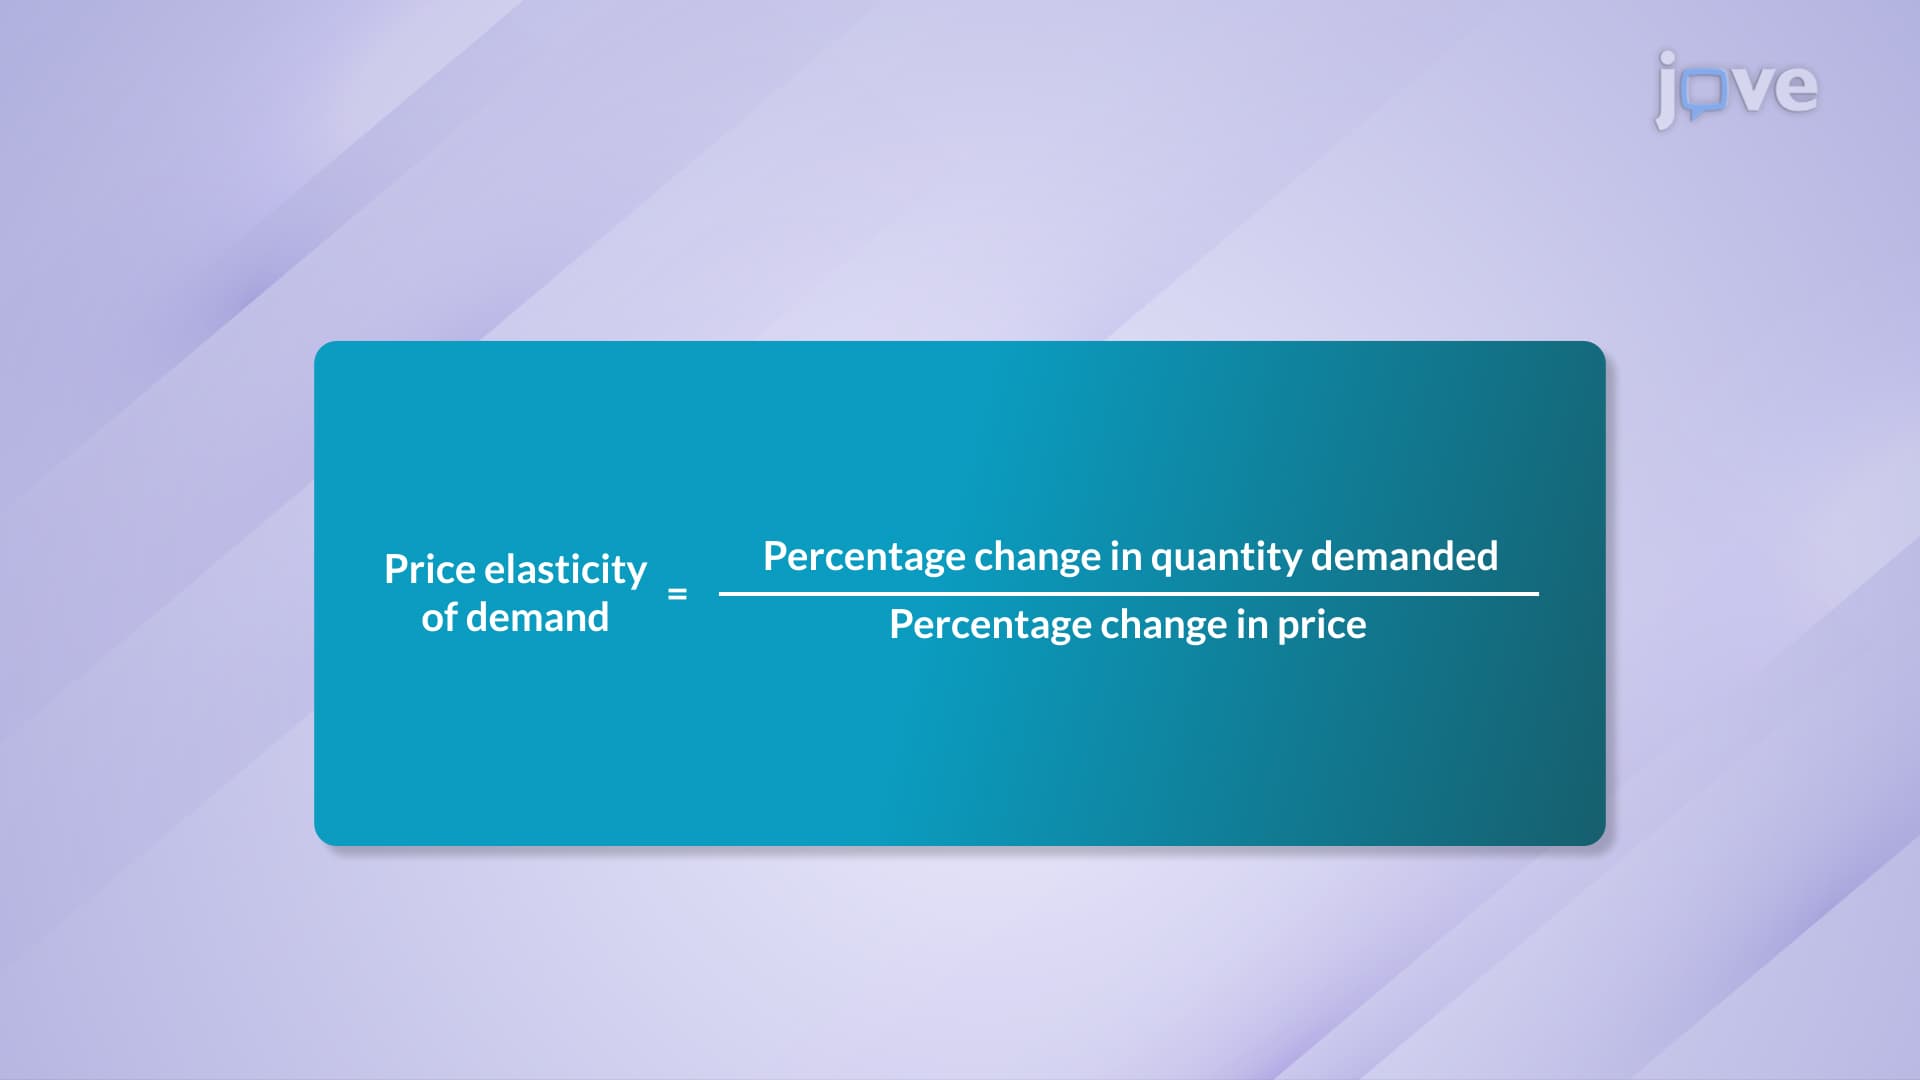
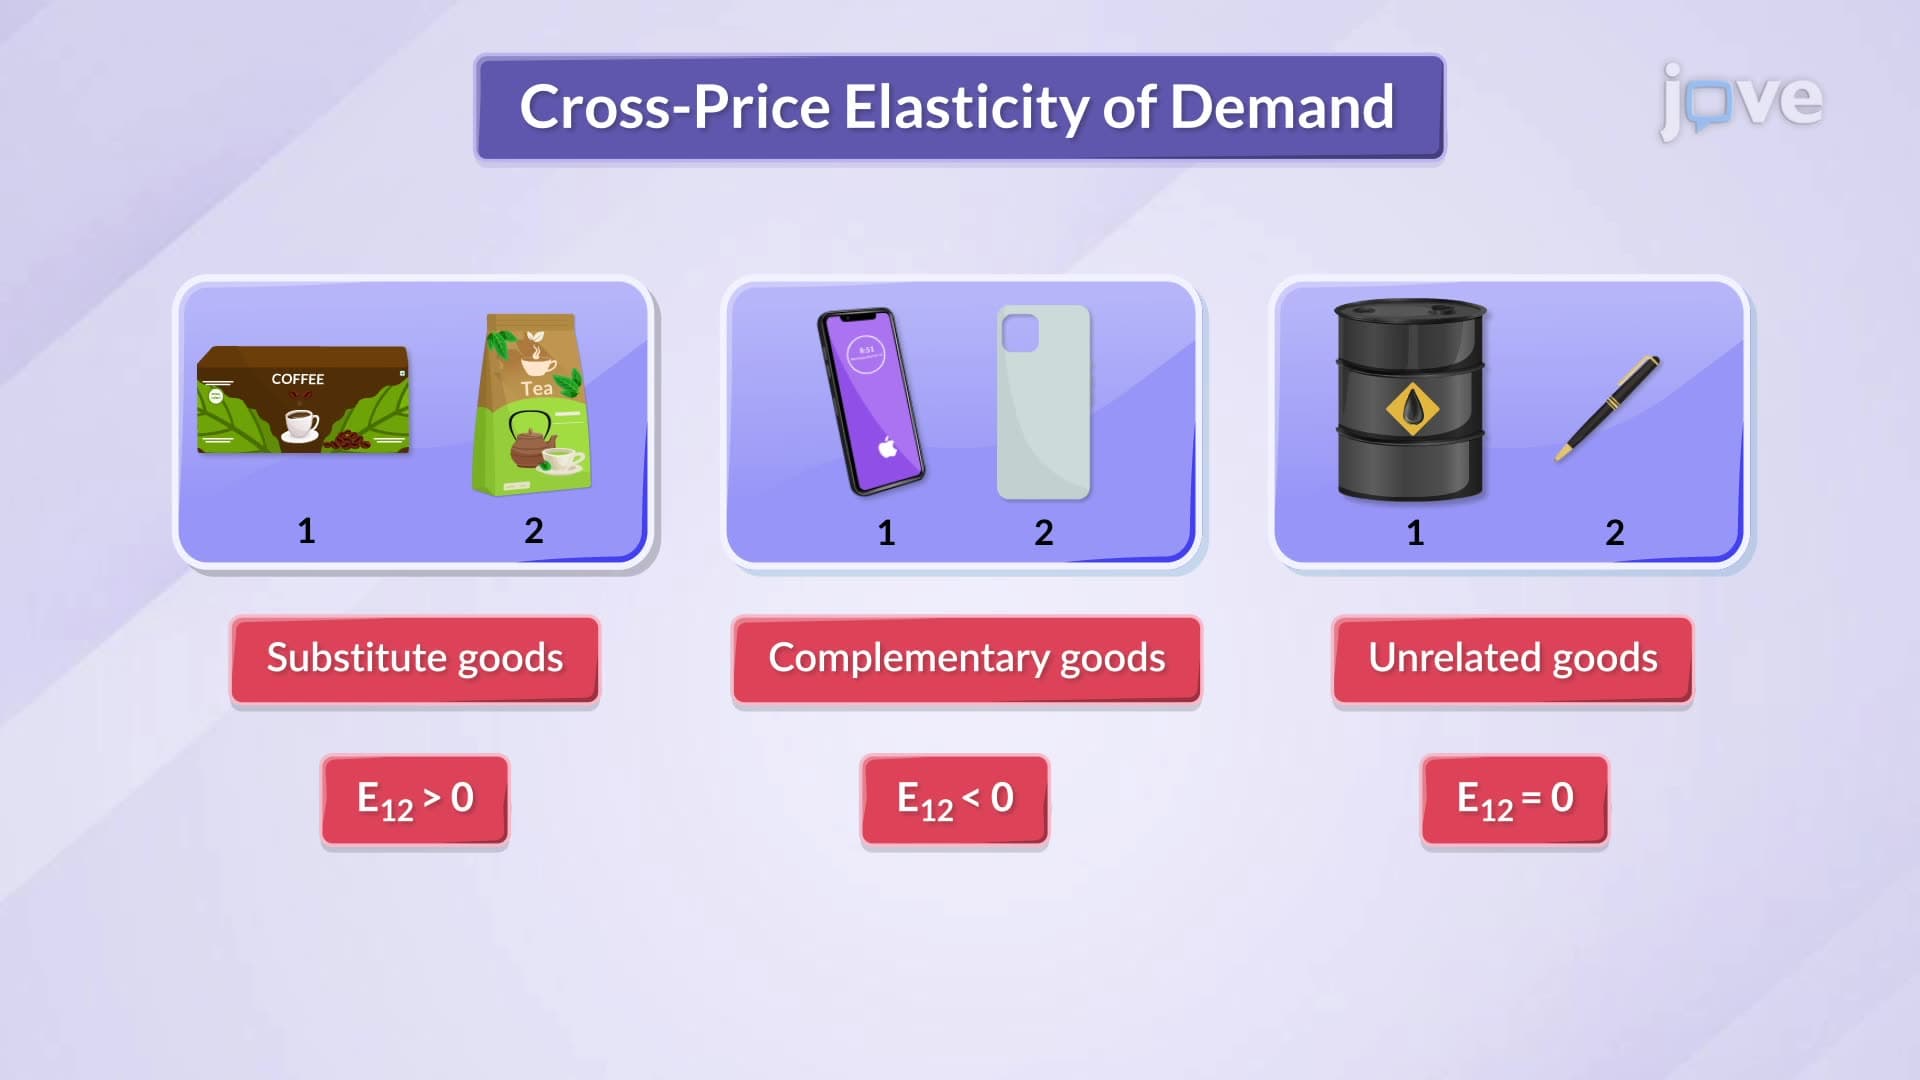
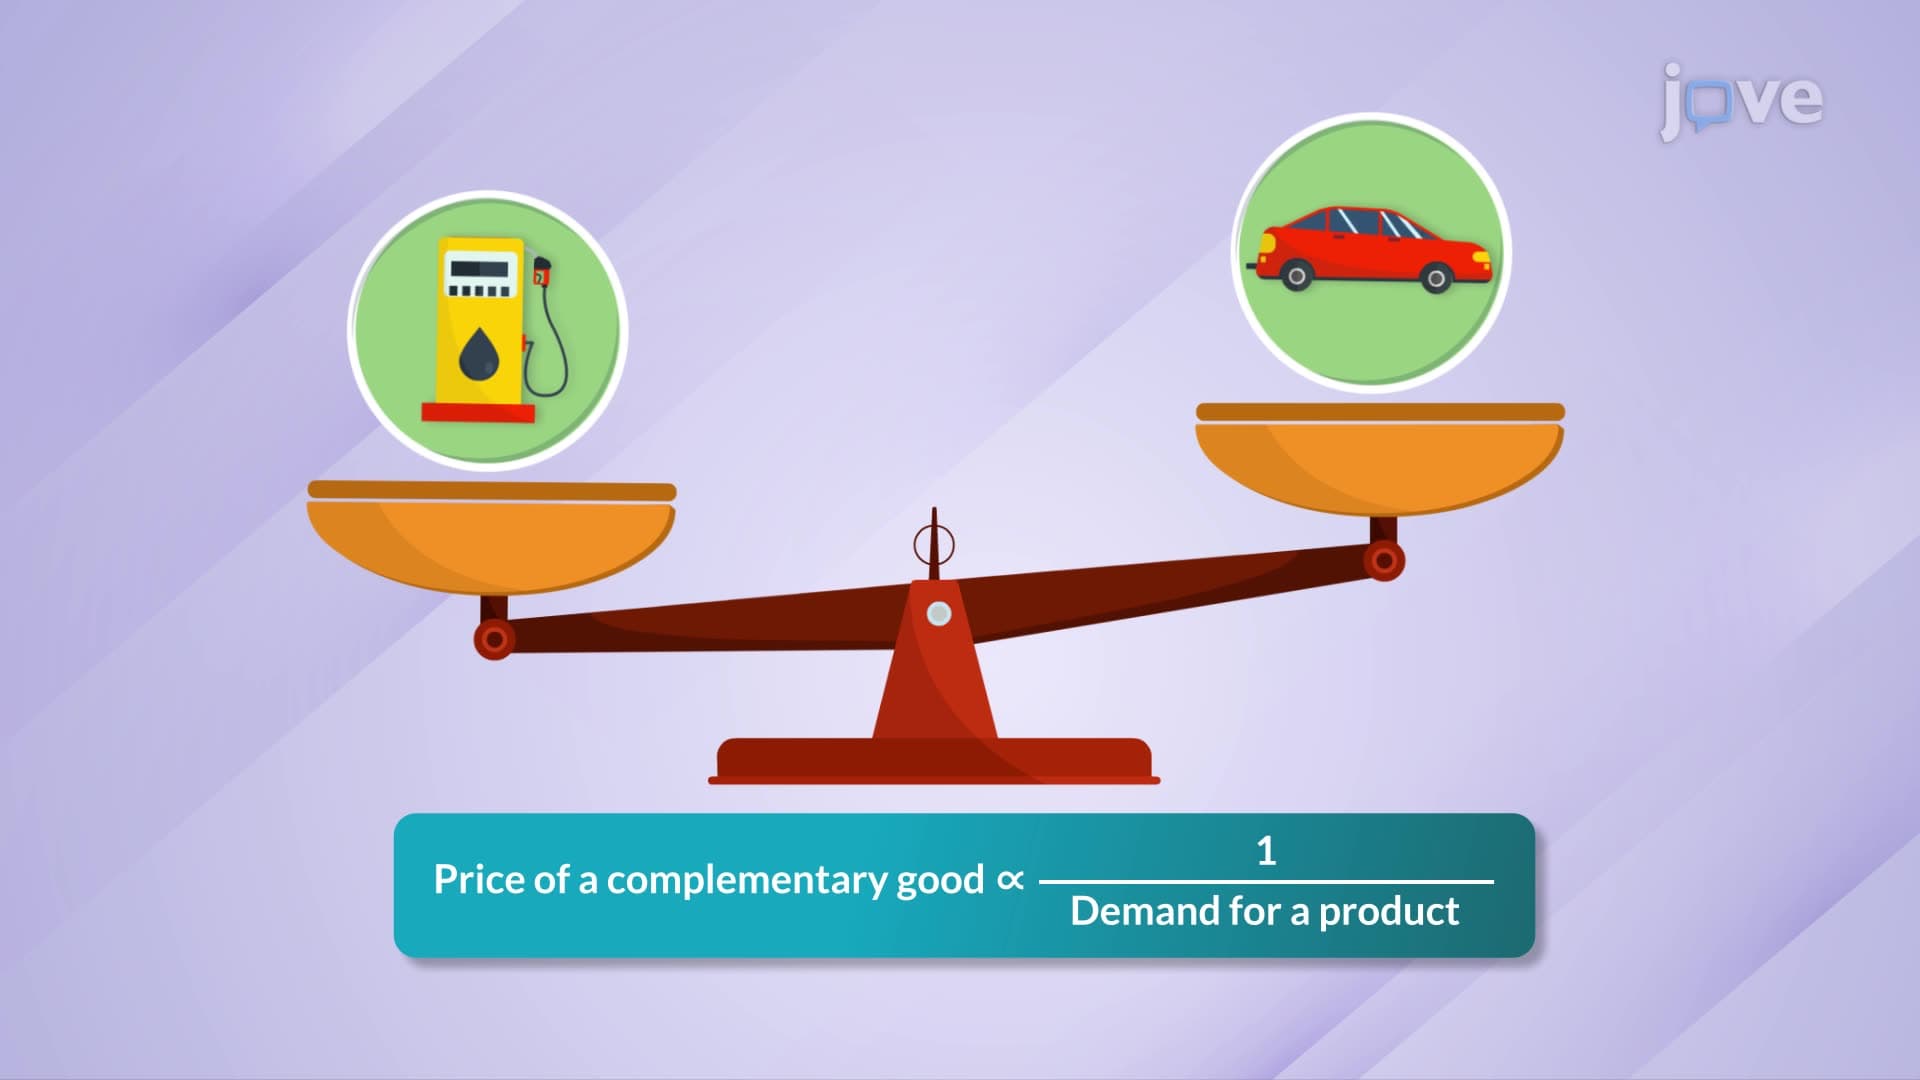
Price elasticity of demand measures consumer responsiveness to price changes using the formula: percentage change in quantity demanded divided by percentage change in price. The midpoint method provides consistent elasticity calculations regardless of direction. Five degrees of elasticity range from perfectly elastic (infinite responsiveness) to perfectly inelastic (zero responsiveness). US gasoline markets typically show inelastic demand, while movie tickets demonstrate elastic demand. Cross-price elasticity reveals relationships between products—positive for substitutes like Uber and traditional taxis, negative for complements like smartphones and phone cases.
3. Factors Influencing Demand Elasticity
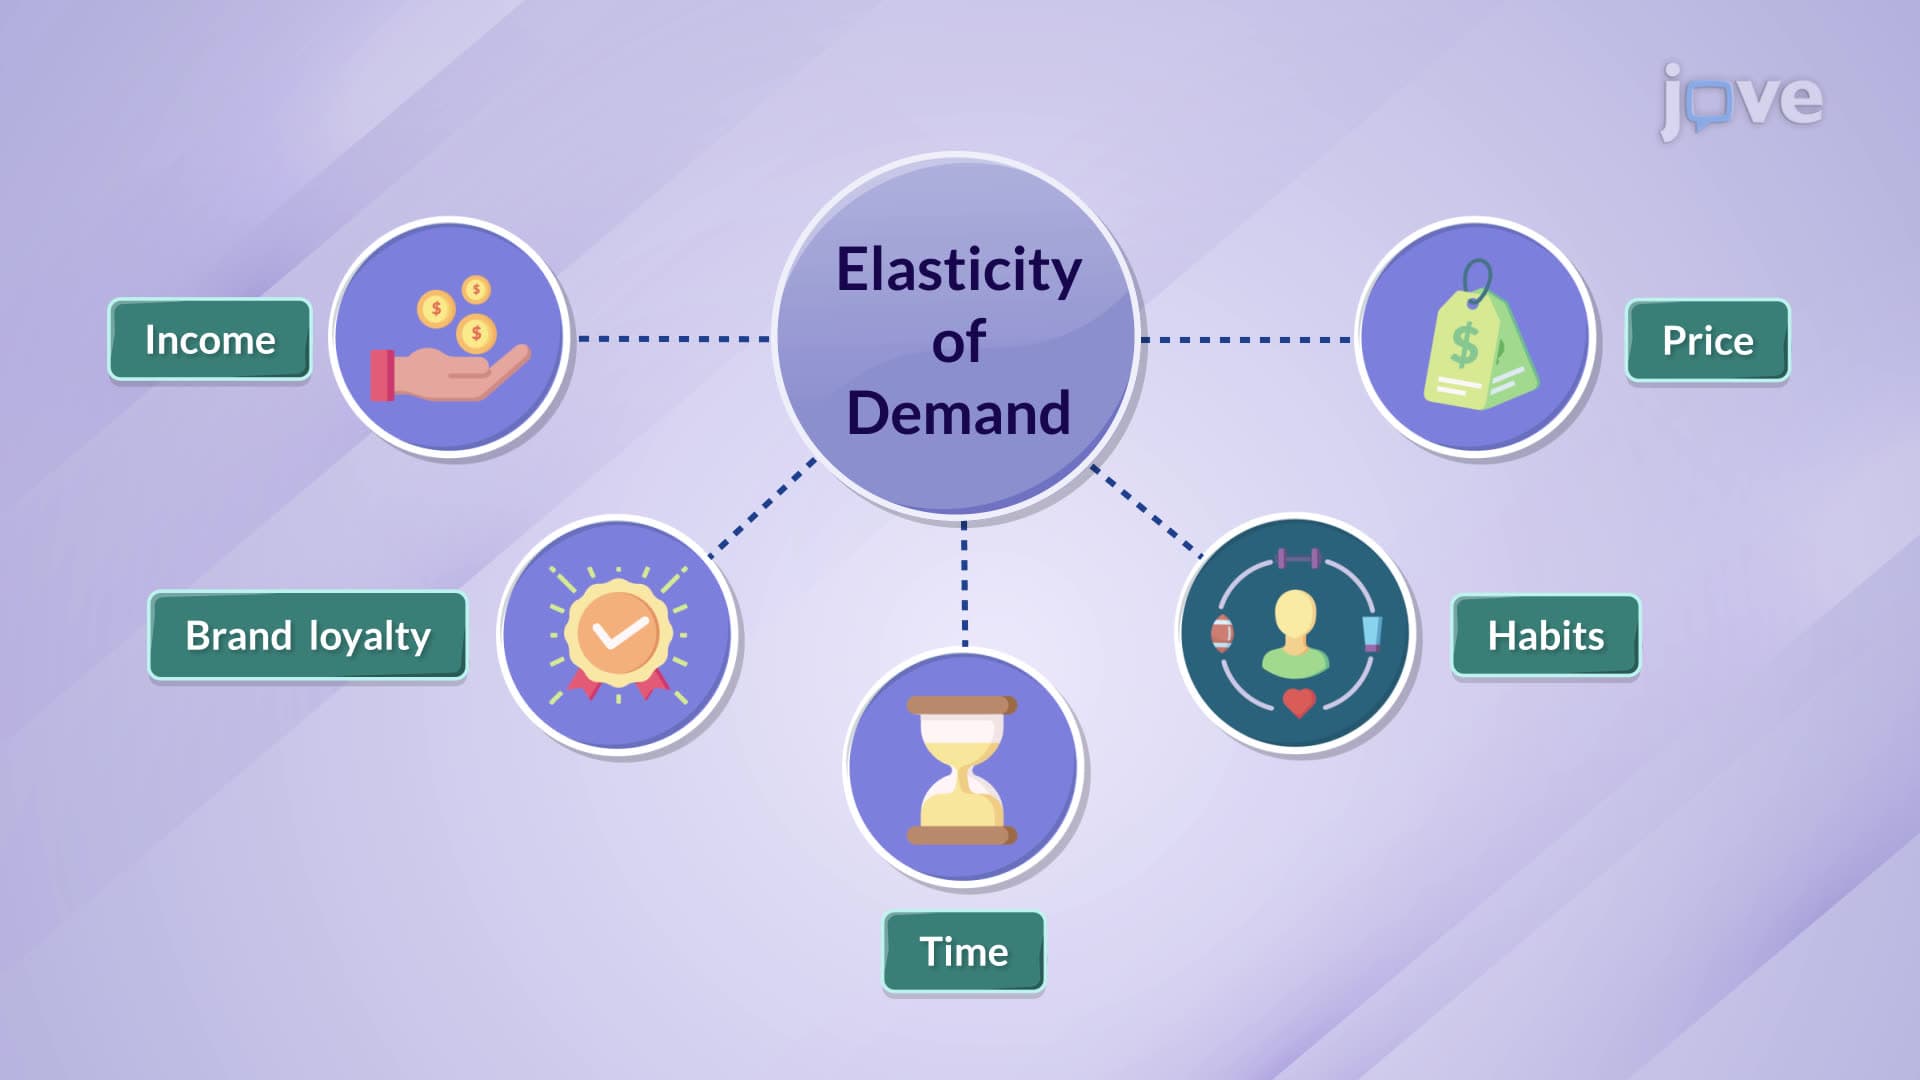
Multiple factors determine how elastic demand becomes in US markets. Availability of close substitutes increases elasticity—ride-sharing services make traditional taxi demand more elastic. Time horizon affects responsiveness—gasoline demand appears inelastic short-term but becomes elastic long-term as consumers switch to electric vehicles. Necessity versus luxury classification impacts elasticity—essential goods like bread show inelastic demand while luxury items like designer clothing exhibit elastic demand. Consumer income levels also influence price sensitivity, with higher-income Americans showing less price responsiveness than lower-income consumers.
4. Income and Cross-Price Elasticity Applications
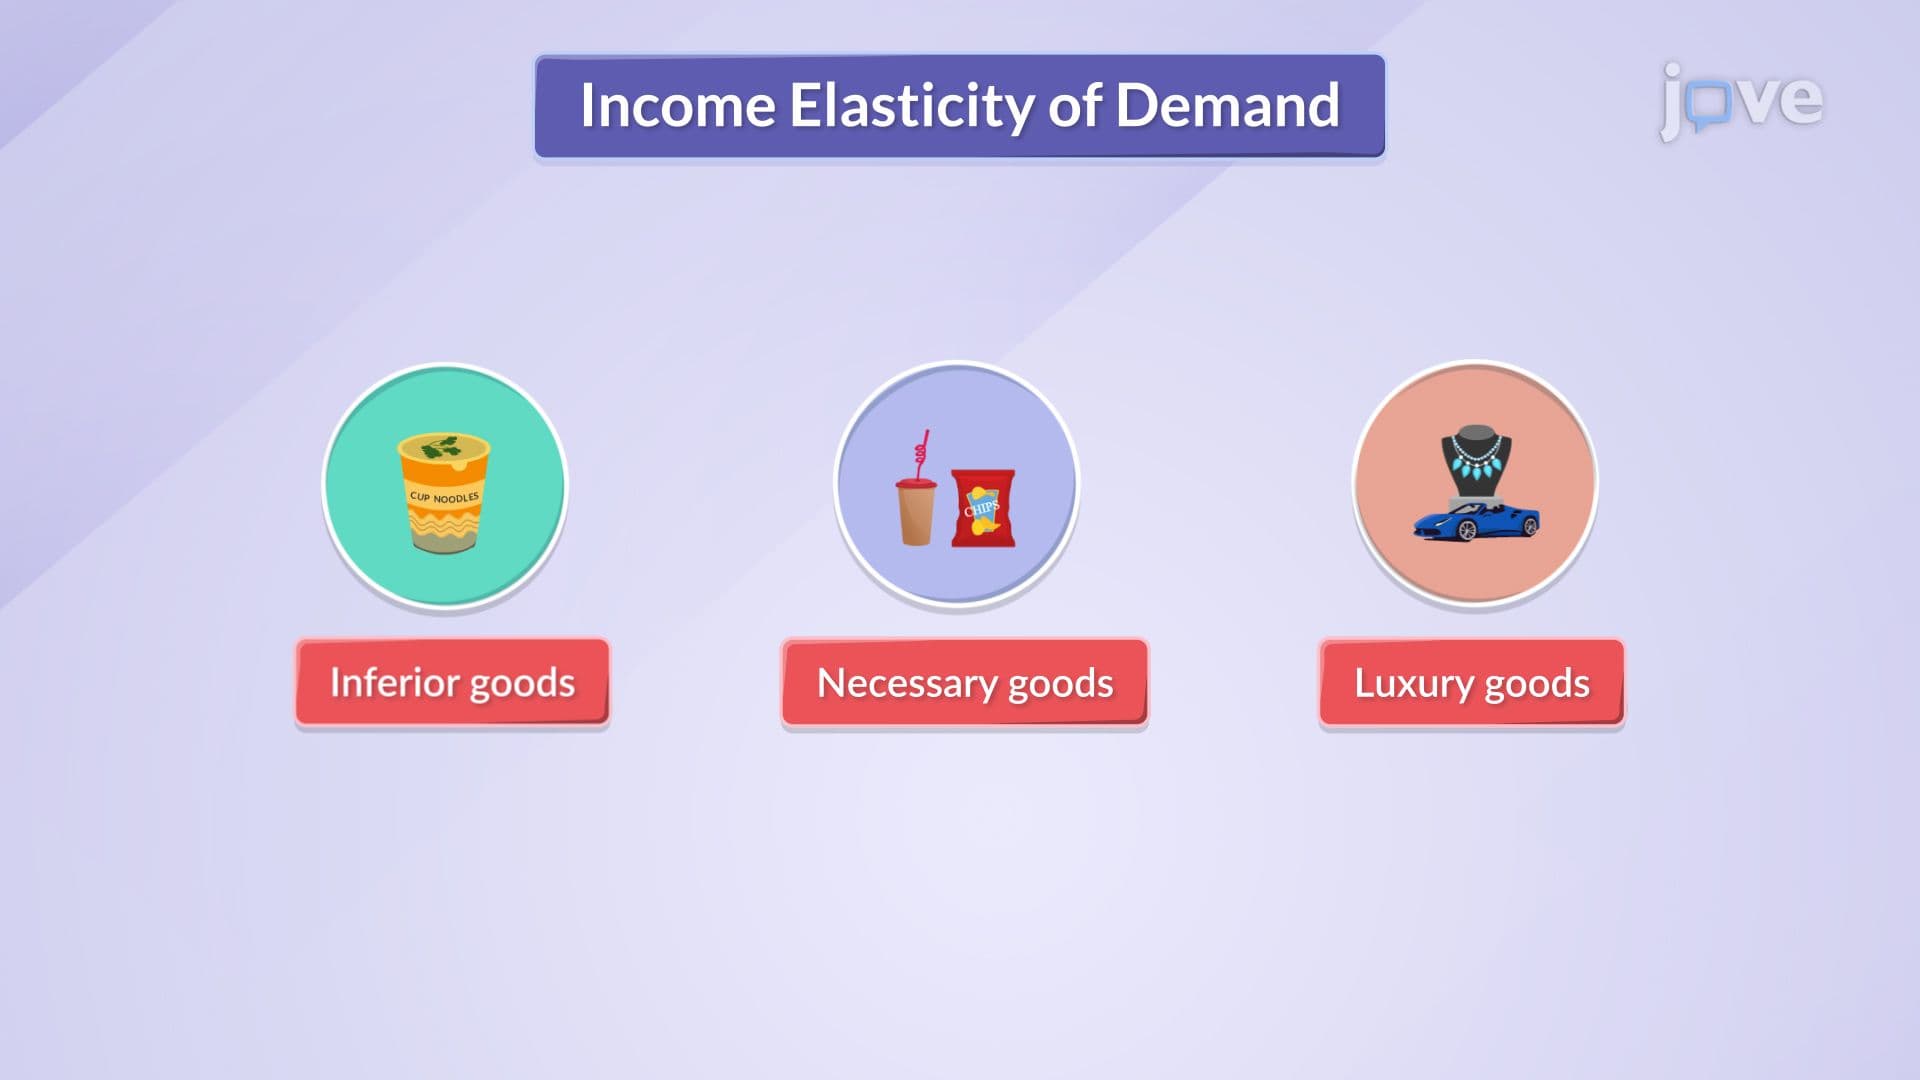
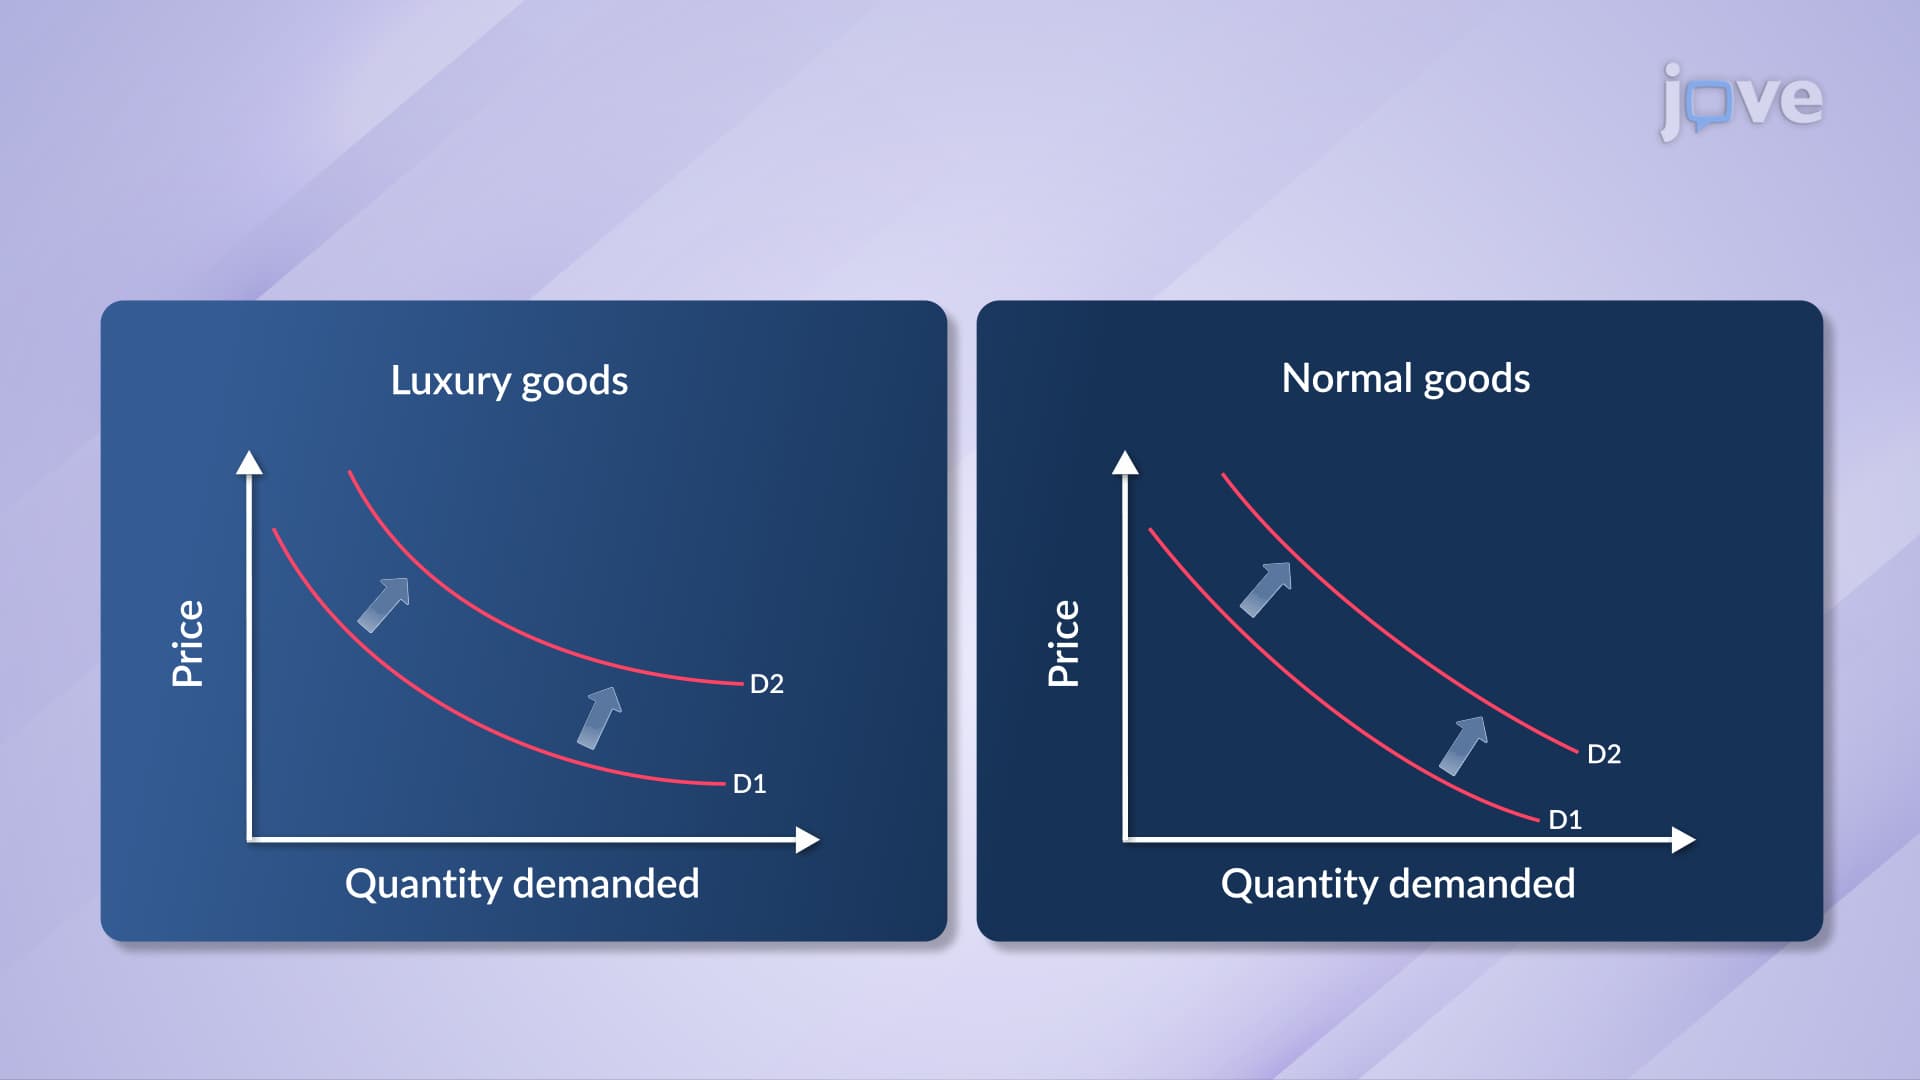
Income elasticity of demand classifies goods based on consumer response to income changes. Inferior goods like instant noodles have negative income elasticity—demand decreases as income rises. Normal goods like smartphones show positive income elasticity between 0 and 1. Luxury goods like sports cars exhibit income elasticity greater than 1, with demand increasing proportionally more than income. Cross-price elasticity helps businesses understand competitive relationships—when Netflix prices increase, demand for competing streaming services like Hulu typically rises, demonstrating positive cross-price elasticity between substitute entertainment services in US markets.
Frequently Asked Questions
Use the formula: %Change in Quantity Demanded ÷ %Change in Price. For consistent results, apply the midpoint method where changes are divided by the average of initial and final values. Remember that PED is typically negative due to the inverse price-quantity relationship, but economists often report the absolute value for easier interpretation.
AP Microeconomics exams commonly test calculation of price elasticity using given data, classification of goods as elastic or inelastic, graphical analysis of demand curves, and cross-price elasticity between substitute or complementary goods. Students must also explain how factors like substitutes availability and time horizon affect elasticity.
The SAT Subject Test in Economics includes multiple-choice questions on elasticity calculations, interpretation of elasticity coefficients, and application of elasticity concepts to real-world scenarios. Students need to understand the relationship between elasticity and total revenue, and how different market conditions affect demand responsiveness.
These goods demonstrate inelastic demand because they're necessities with few substitutes in the short run. Americans need gasoline for transportation and healthcare for survival, so they continue purchasing even when prices rise. However, long-term elasticity increases as consumers find alternatives like electric vehicles or preventive care.
Students often struggle with interpreting elasticity coefficients and understanding that elasticity varies along a linear demand curve. The concept that the same product can be elastic at some price points and inelastic at others requires careful analysis of the price-quantity ratio at different curve positions.
Start by identifying the type of elasticity (price, income, or cross-price), then apply the appropriate formula systematically. Always check if the question asks for absolute value or includes the negative sign. Practice with US market examples like smartphones, gasoline, and streaming services to build familiarity with common elasticity scenarios.
Companies like Apple use price elasticity to set iPhone prices, knowing their loyal customer base shows relatively inelastic demand. Uber applies surge pricing during high-demand periods because transportation demand becomes more inelastic when alternatives are scarce. Netflix analyzes cross-price elasticity with competitors when adjusting subscription prices.
This microcourse includes 21 concept videos that walk you through the building blocks of Microeconomics. Each video is short, about 1 minute, so you can cover a full topic during a coffee break or between classes. The full sequence starts with Demand and ends with Income Elasticity of Demand.