Loading subject page…

- Statistics
- Measures of Relative Standing
- 5-Number Summary
Micro-course: Measures of Relative Standing
77,400 views
Learn key concepts and earn your certificate.






5-Number Summary

00:00
01:04
Video Summary: What Is 5 Number Summary
Did you know that understanding data distribution can reveal hidden patterns in everything from standardized test scores to daily temperature readings? The 5 number summary provides a powerful statistical snapshot that captures the complete spread of any dataset through just five key values. Consider analyzing SAT math scores across US high schools-this method instantly reveals the lowest score, highest score, and three critical points that divide the data into equal quarters. Watch the full video on JoVE Coach to master this concept with expert-led visuals and step-by-step explanations.
- Understand what a 5 number summary is and identify its five essential components: minimum, first quartile (Q1), median (Q2), third quartile (Q3), and maximum
- Analyze datasets by arranging values in ascending order to extract meaningful statistical insights
- Apply the quartile calculation methods to determine Q1 and Q3 positions within any dataset
- Recognize how each component describes specific aspects of data distribution and central tendency
- Evaluate data spread and identify potential outliers using the complete statistical summary
- Compare different datasets effectively by examining their respective five-number summaries
- Explore the connection between 5 number summaries and boxplot visualizations for data analysis
- Utilize this statistical tool for exam preparation and real-world data interpretation scenarios
Understanding the 5 Number Summary Framework
The 5 number summary serves as a fundamental statistical tool that provides a comprehensive overview of any dataset's distribution. This method transforms complex data into five meaningful values that collectively describe the dataset's shape, center, and variability. Unlike single measures like mean or standard deviation, this approach offers a complete picture that's particularly valuable for AP Statistics students and college-level data analysis courses.
Components and Calculation Methods
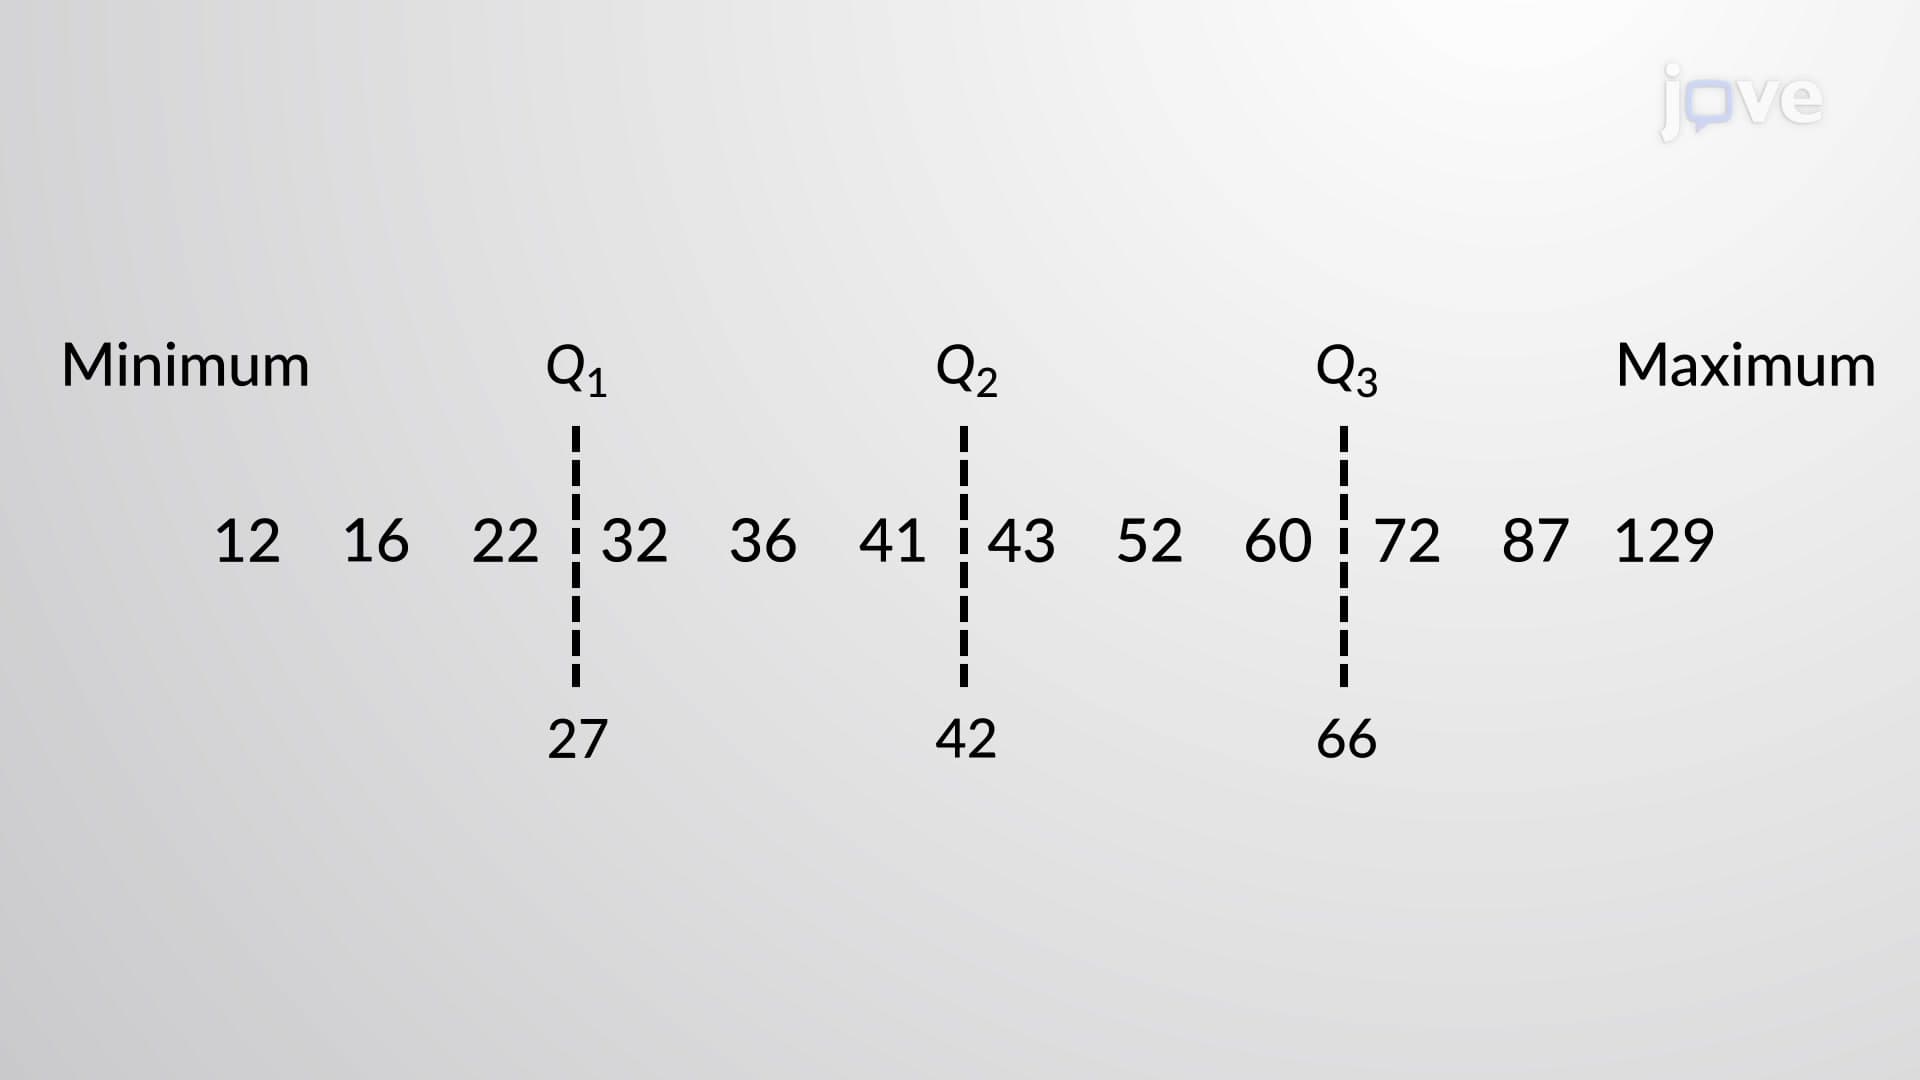
Each element within the 5 number summary definition serves a specific analytical purpose. The minimum and maximum values establish the dataset's range, while the median (Q2) identifies the central tendency. The first quartile (Q1) marks the 25th percentile, meaning 25% of data falls below this value, while the third quartile (Q3) represents the 75th percentile. To calculate these quartiles, first arrange data in ascending order, then locate the median position. For Q1, find the median of the lower half; for Q3, find the median of the upper half.
Consider analyzing annual rainfall data across 50 US cities. After ordering values from lowest to highest, you'd identify the driest city (minimum), wettest city (maximum), and the city representing typical rainfall (median). The quartiles reveal cities at the 25% and 75% rainfall levels, providing meteorologists with crucial distribution insights.
Practical Applications and Exam Relevance
Understanding what is 5 number summary in detail proves essential for various standardized exams. The SAT Math section frequently includes questions requiring quartile calculations, while AP Statistics extensively covers this topic in descriptive statistics units. College courses in psychology, economics, and business rely heavily on these summaries for research analysis and data interpretation.
Visual Representation and Interpretation
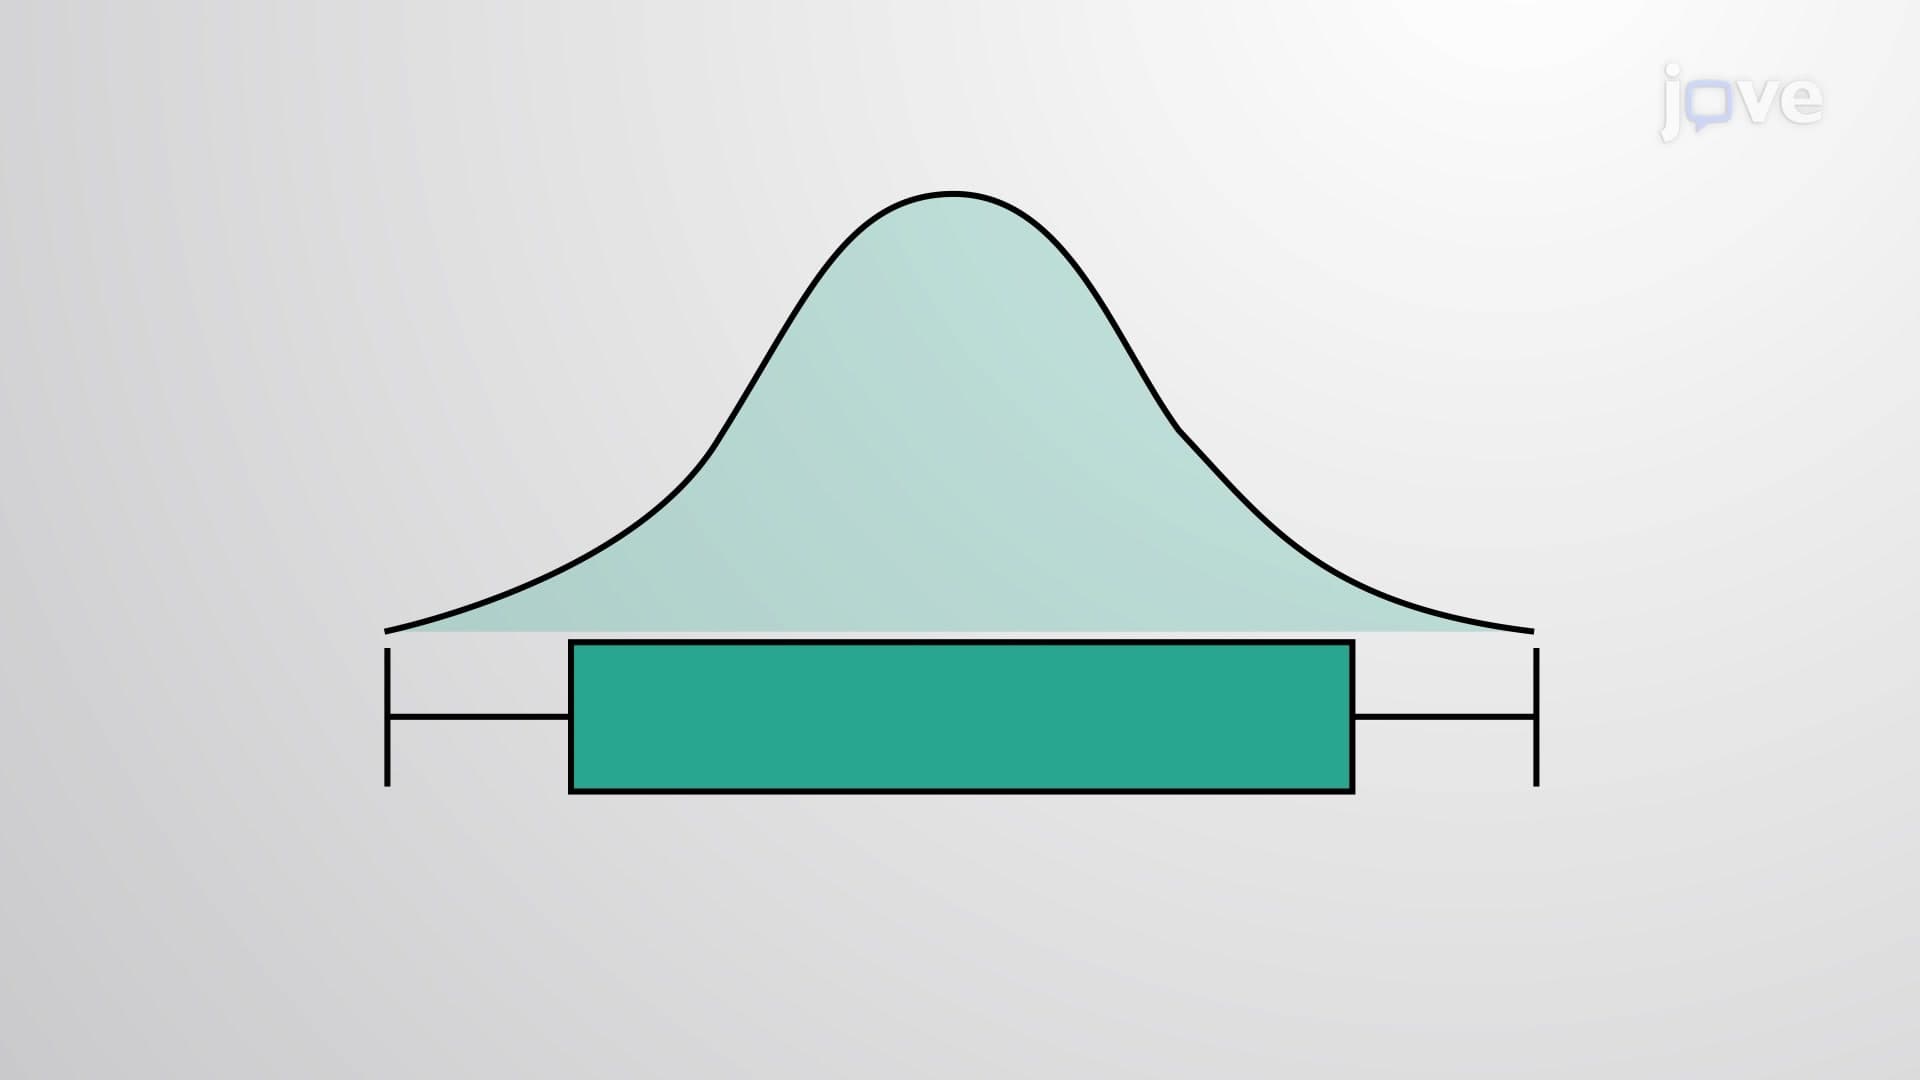
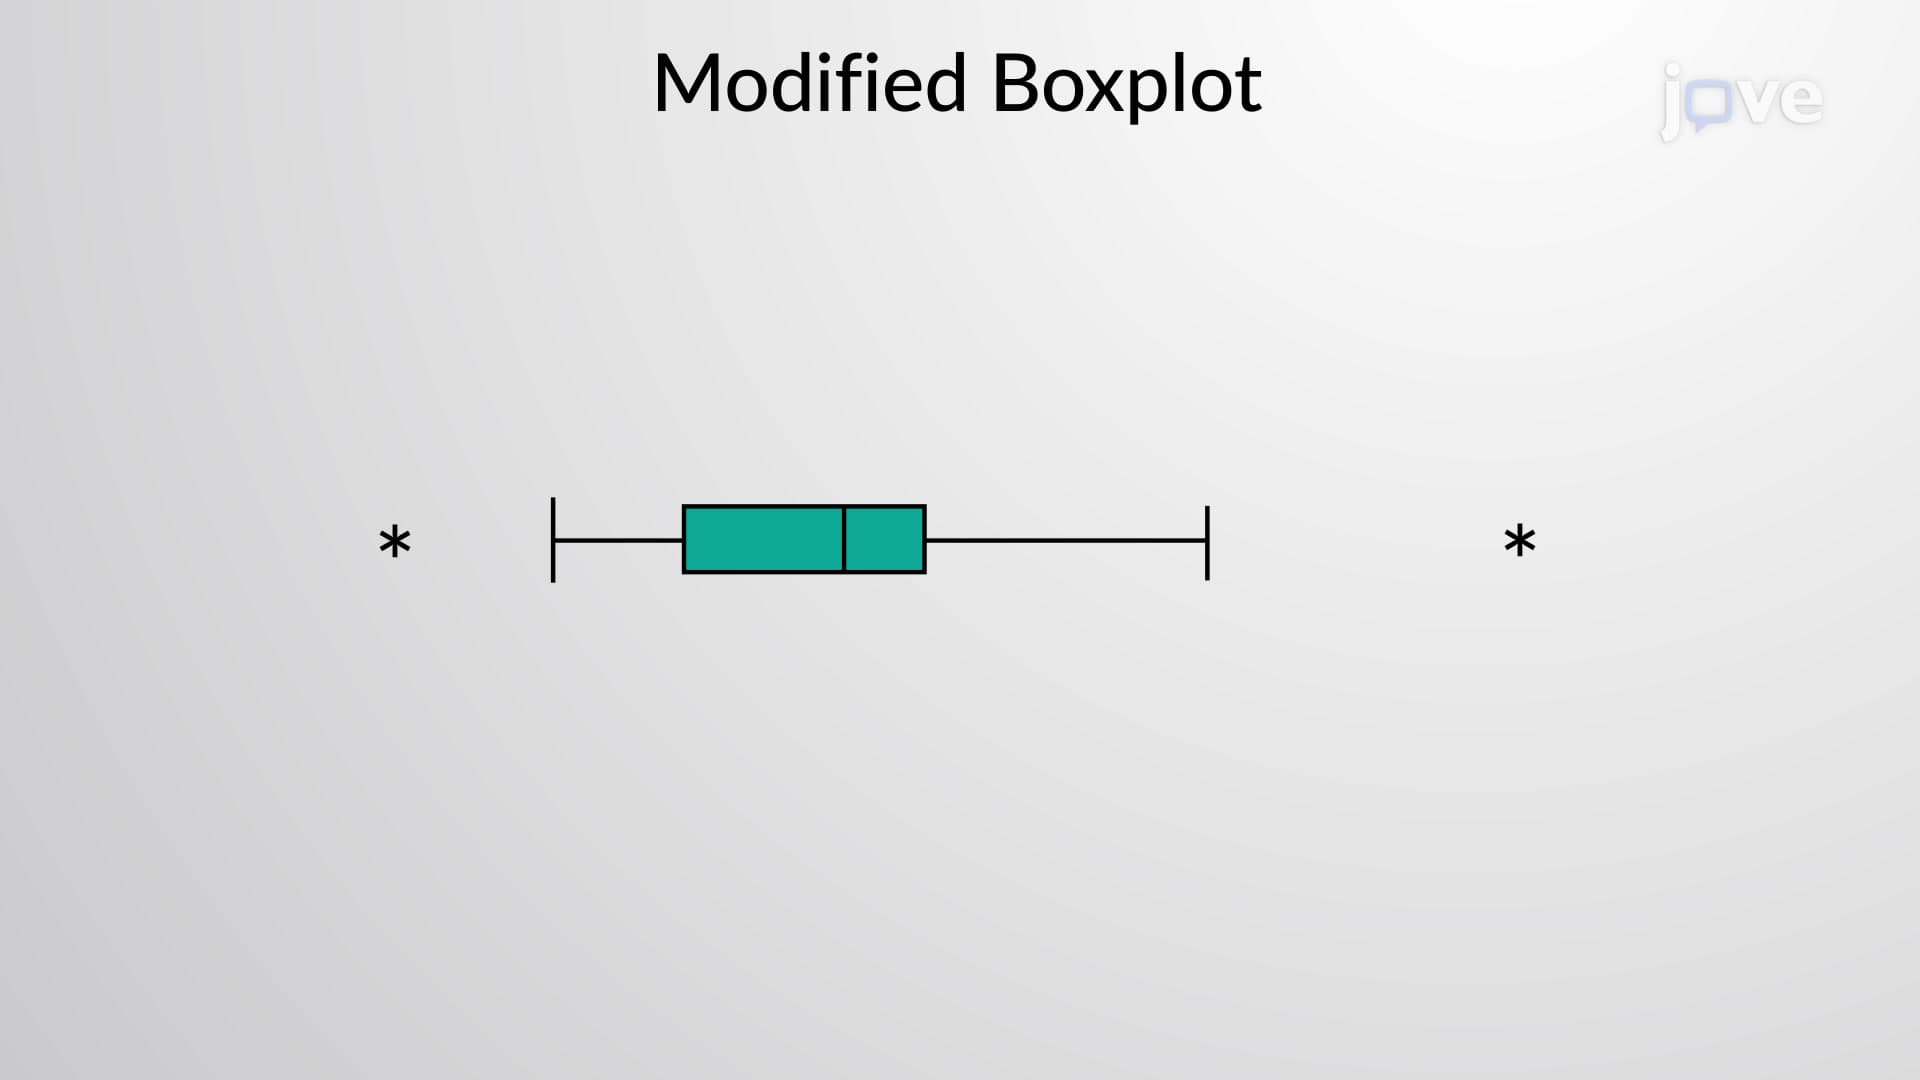
The 5 number summary overview connects directly to boxplot construction, where each summary component corresponds to specific plot elements. The box spans from Q1 to Q3, with a line marking the median, while whiskers extend to minimum and maximum values. This visualization immediately reveals data symmetry, potential outliers, and overall distribution characteristics-skills crucial for advanced statistical analysis and professional data interpretation.
Frequently Asked Questions
The 5 number summary is a statistical method that describes any dataset using five key values: minimum, first quartile, median, third quartile, and maximum. It provides a complete overview of data distribution, showing where data clusters, spreads, and centers, making it essential for understanding patterns in everything from test scores to scientific measurements.
AP Statistics frequently tests 5 number summary concepts through free-response questions requiring quartile calculations and boxplot interpretations. Students must demonstrate ability to calculate quartiles from raw data, interpret existing summaries, and connect these values to real-world contexts like comparing school district performance or analyzing survey results.
Practice ordering datasets quickly and memorizing quartile position formulas for different sample sizes. Focus on interpreting boxplots and connecting summary statistics to real scenarios, as SAT questions often embed these concepts within practical applications like sports statistics or economic data analysis.
Netflix uses 5 number summaries to analyze viewer engagement across different shows, identifying minimum/maximum watch times and quartiles that inform content recommendations. Similarly, Major League Baseball teams analyze player performance statistics to make strategic decisions about trades, salary negotiations, and game planning.
No advanced mathematics is required-just basic arithmetic and ordering skills. If you can arrange numbers from smallest to largest and find middle values, you can master 5 number summaries. This accessibility makes it an excellent introduction to statistical thinking for high school students.
Create practice datasets using familiar contexts like class test scores or sports statistics, then manually calculate each component. Practice interpreting boxplots and explaining what each quartile reveals about the data. Focus on connecting calculations to real-world meaning rather than just memorizing formulas.
Progress to studying interquartile range (IQR), outlier identification rules, and advanced boxplot variations. These concepts build naturally from 5 number summaries and prepare you for inferential statistics, hypothesis testing, and more sophisticated data analysis techniques in college-level courses.
The summary provides the foundation for outlier detection using the 1.5×IQR rule, where values beyond Q1 - 1.5(IQR) or Q3 + 1.5(IQR) are considered outliers. This systematic approach helps researchers and analysts identify unusual data points that might indicate measurement errors, exceptional cases, or important discoveries requiring further investigation.
Related Micro-courses