Loading video…


 9 Concepts
 77.4K views

Video Summary: What Is Quartile
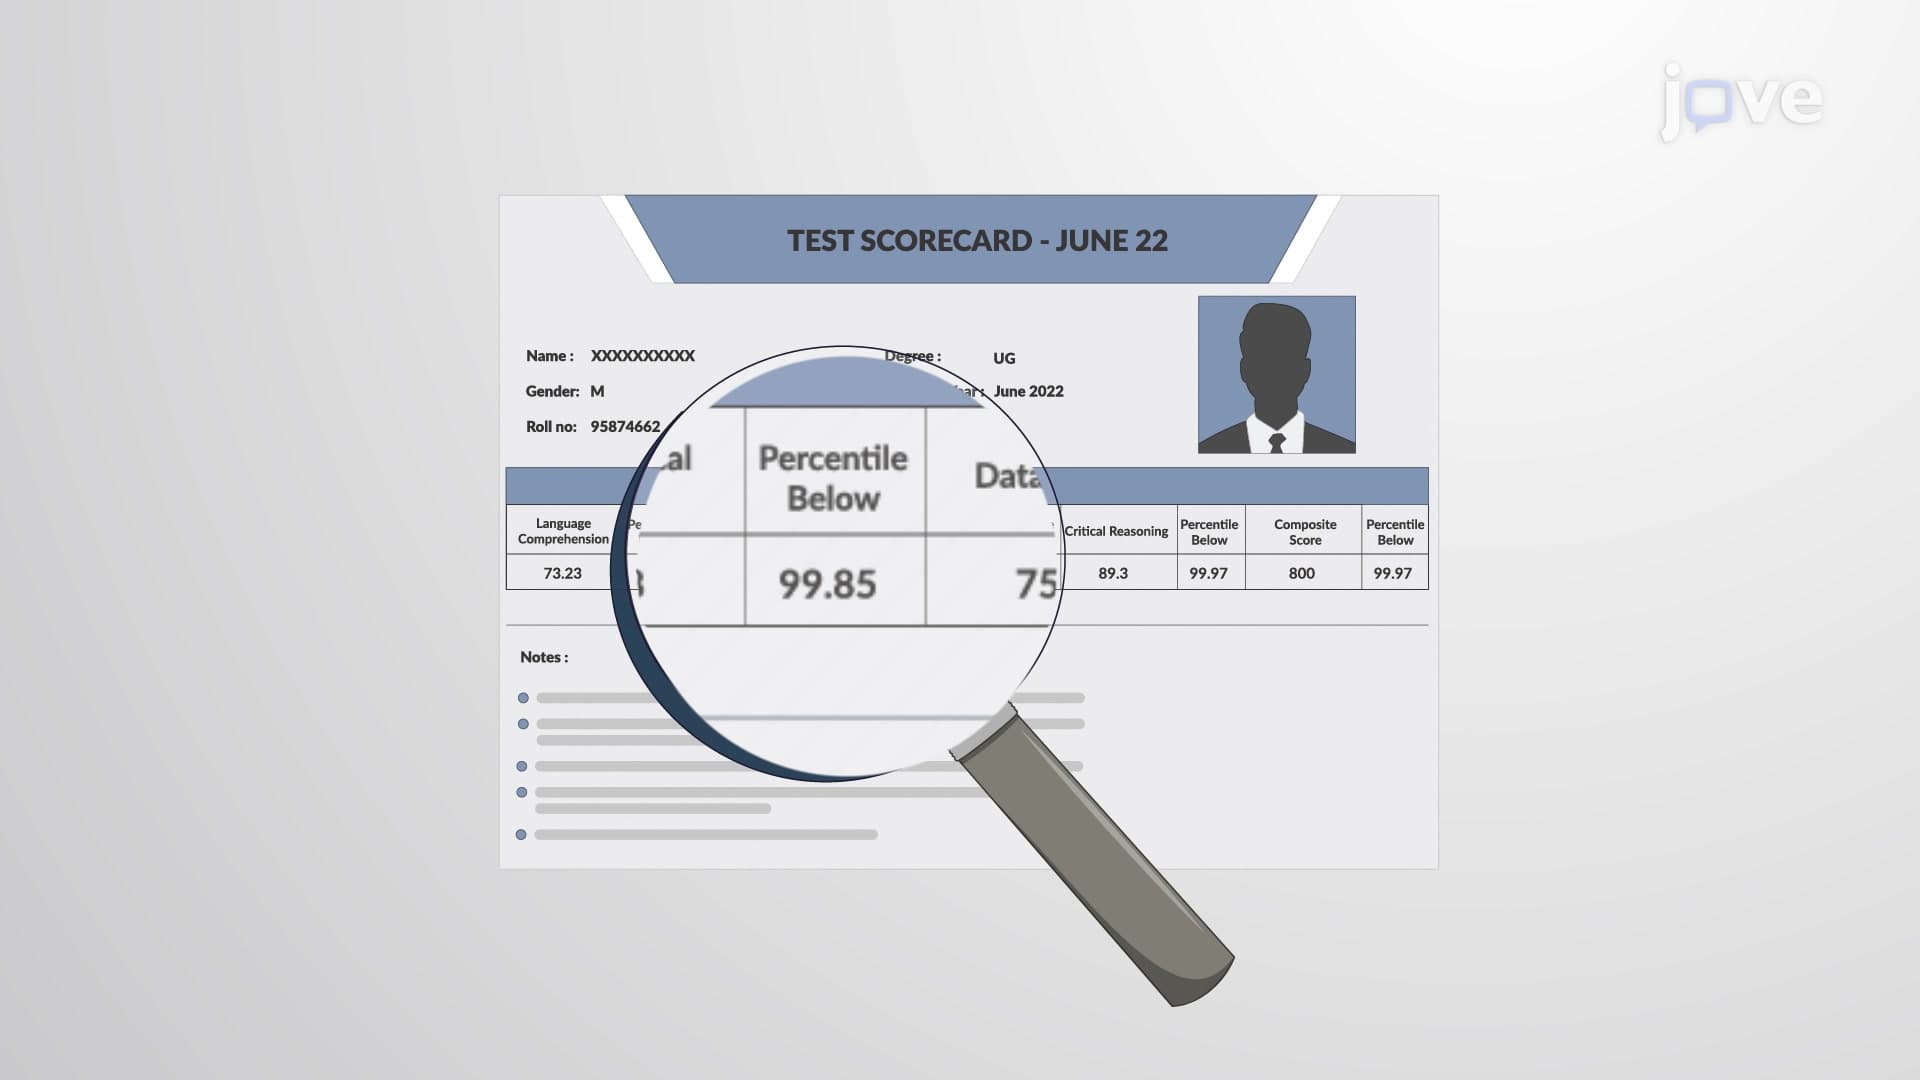
Ever wonder how Netflix determines if your binge-watching habits are "normal" compared to other users? Quartiles are statistical measures that divide any dataset into four equal groups of 25% each, making it easy to understand where any data point stands relative to others. For instance, if your SAT score falls in the third quartile, you've outperformed 75% of all test-takers nationwide. Watch the full video on JoVE Coach to master this concept with expert-led visuals and step-by-step explanations.
Quartiles represent one of statistics' most practical tools for understanding data distribution. Unlike simple averages that can be misleading, quartiles provide a complete picture of how data spreads across four equal segments. Each quartile contains exactly 25% of your dataset, creating a reliable framework for comparison and analysis.
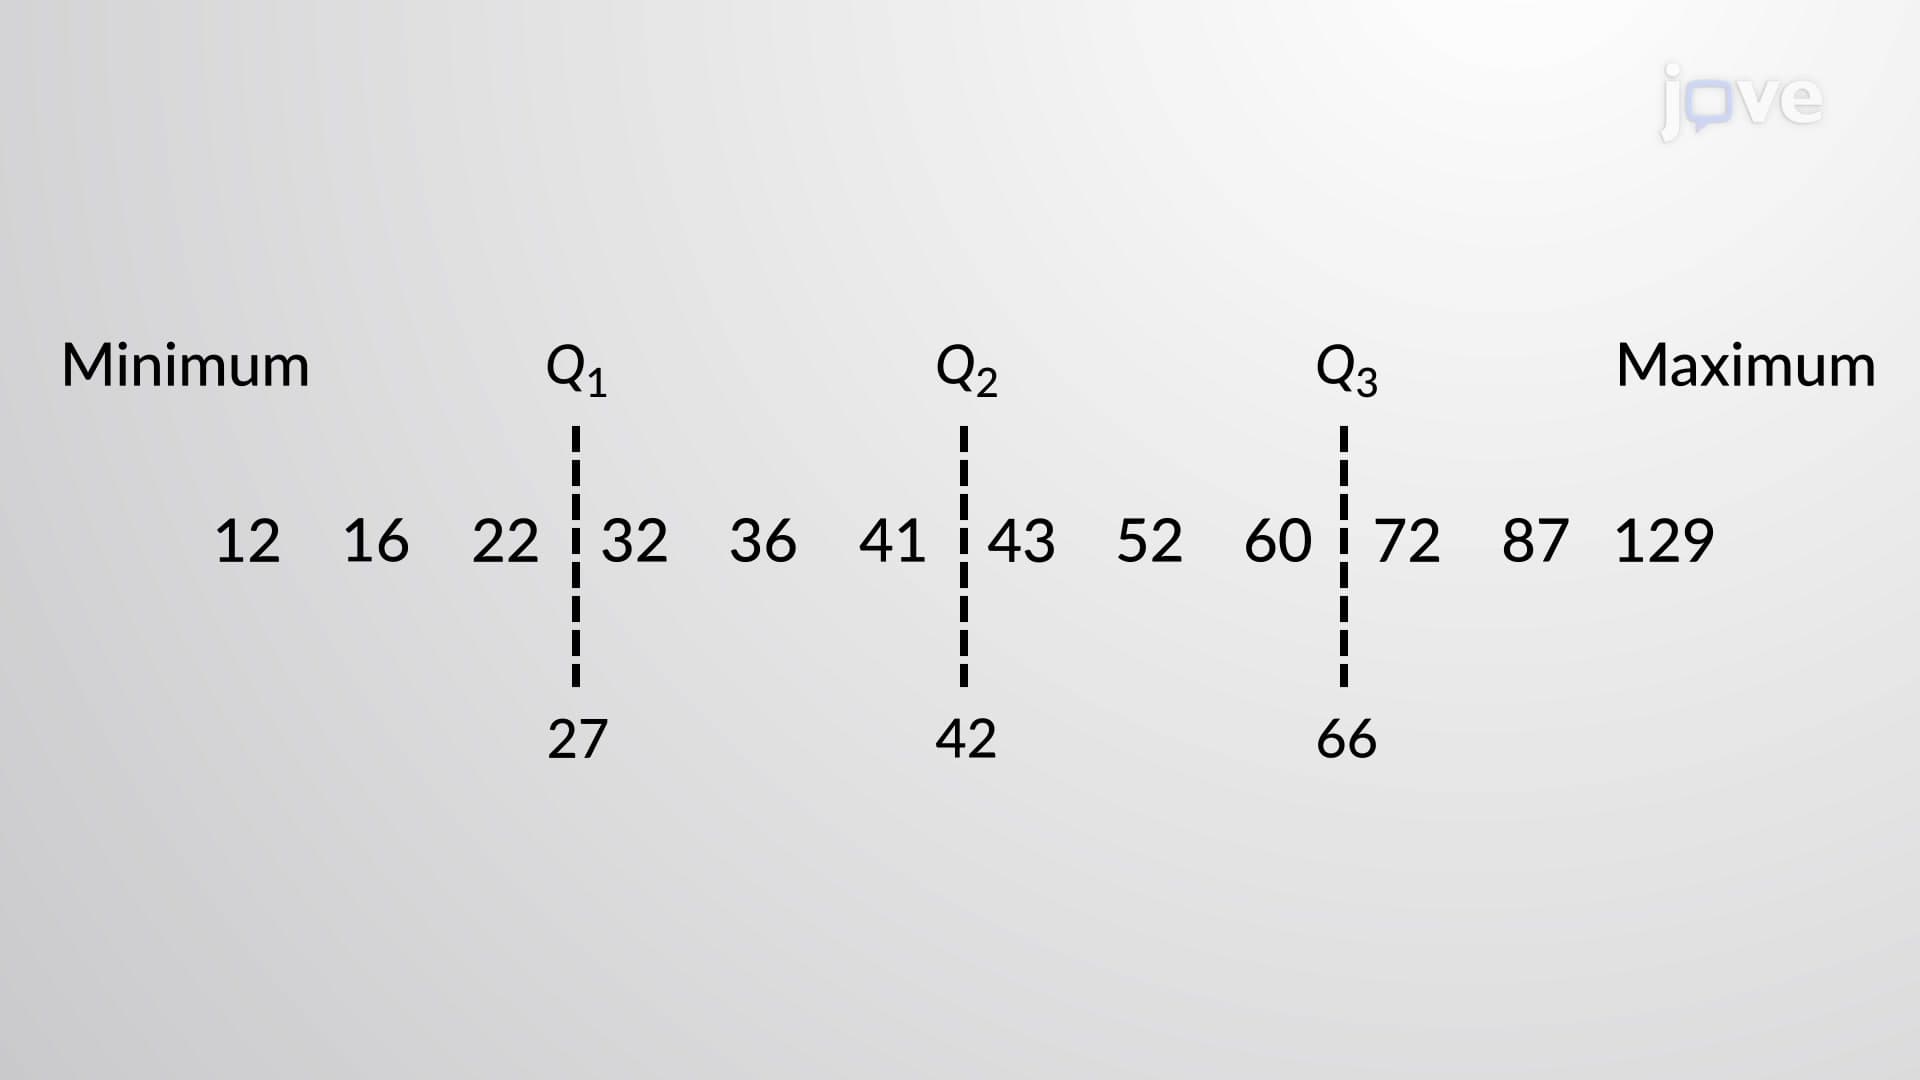
The three quartile positions serve distinct purposes: Q1 (first quartile) marks the 25th percentile, Q2 (second quartile) equals the median at the 50th percentile, and Q3 (third quartile) represents the 75th percentile. This systematic division helps students and professionals quickly assess whether specific values are unusually high, low, or typical within their dataset.
Computing quartiles requires organized data arrangement and precise formula application. Begin by sorting your data from lowest to highest-this crucial step ensures accurate quartile identification. For Q1, use the formula: Q1 position = (n+1)/4, where n represents your total data points. Q3 follows a similar pattern: Q3 position = 3(n+1)/4.
When your calculated position isn't a whole number, interpolate between adjacent values. For example, if Q1 falls at position 2.5, average the 2nd and 3rd values in your ordered dataset. This interpolation method ensures consistent, reliable quartile calculations across various sample sizes.
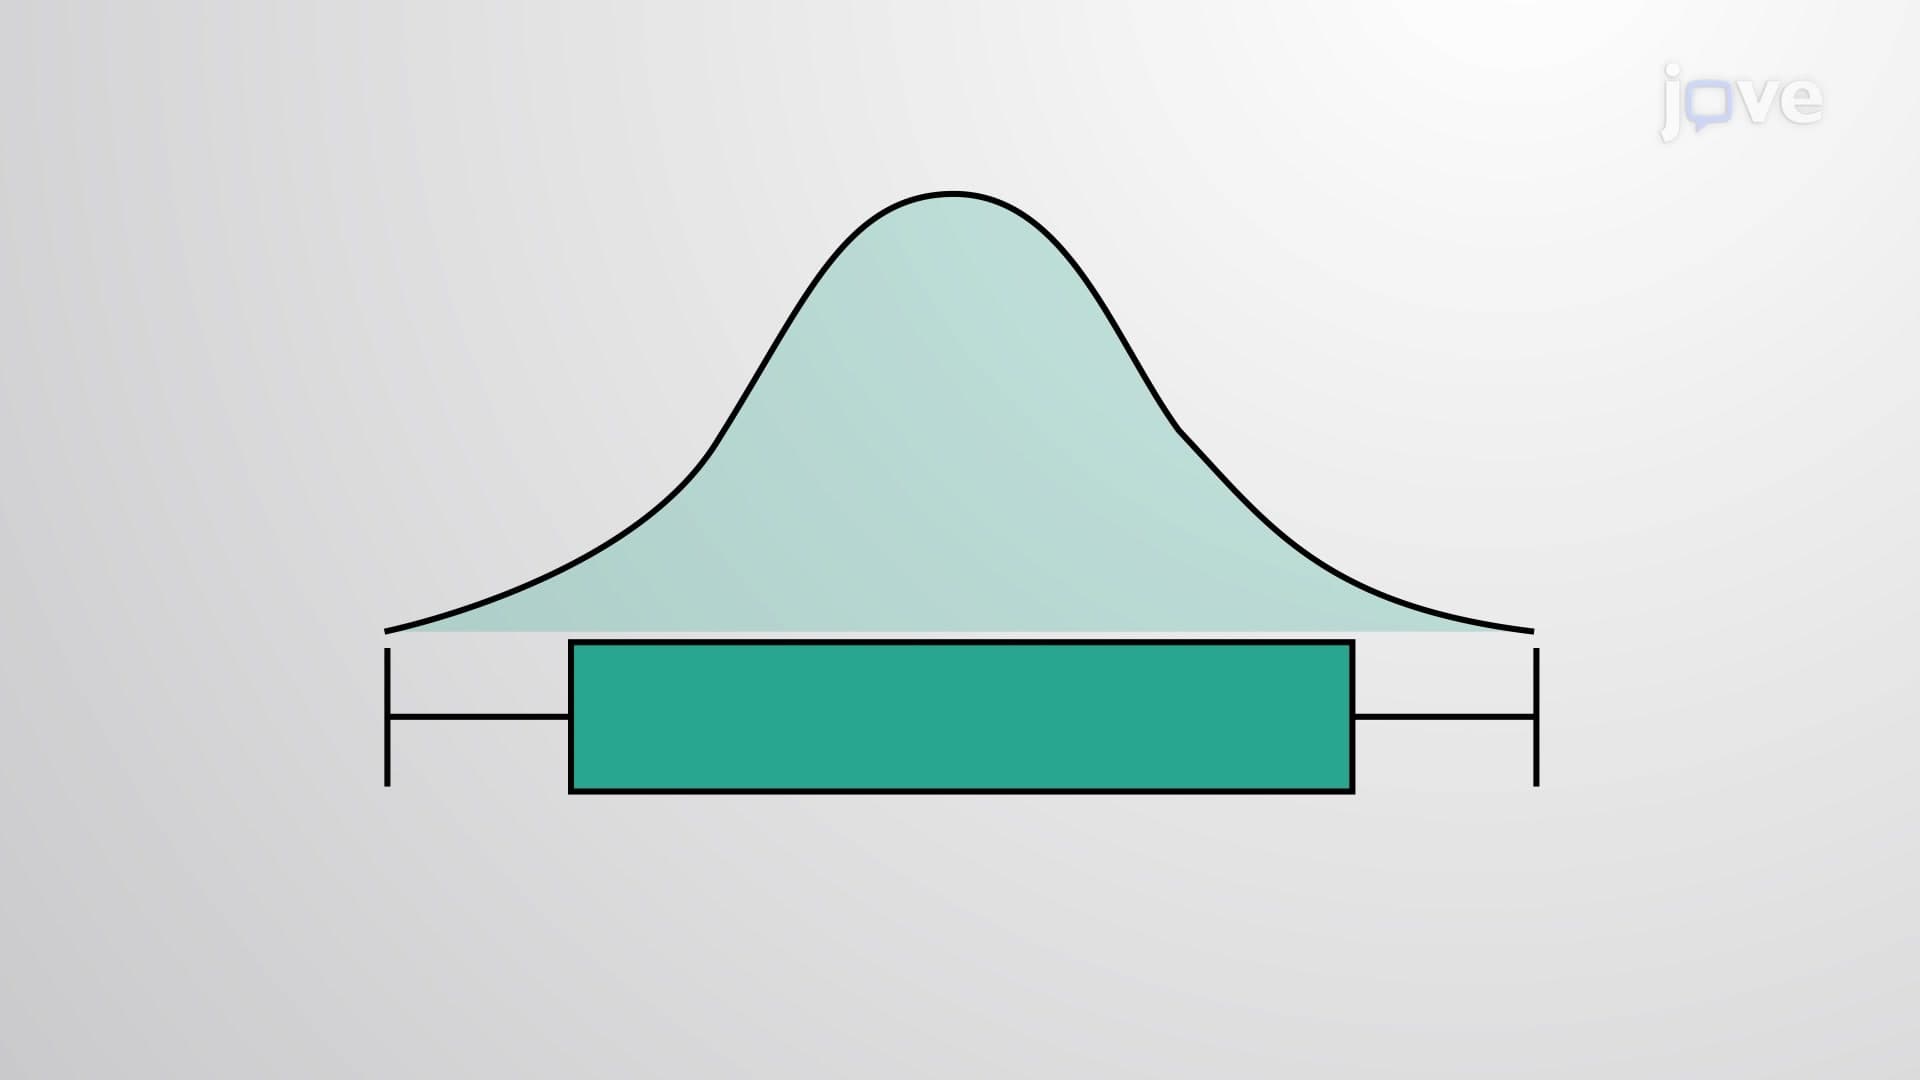
The interquartile range (IQR) equals Q3 minus Q1, capturing the spread within your data's middle 50%. This measure proves especially valuable because it remains unaffected by extreme values, unlike standard deviation. For college entrance exams like the SAT, understanding IQR helps interpret score distributions and percentile rankings.
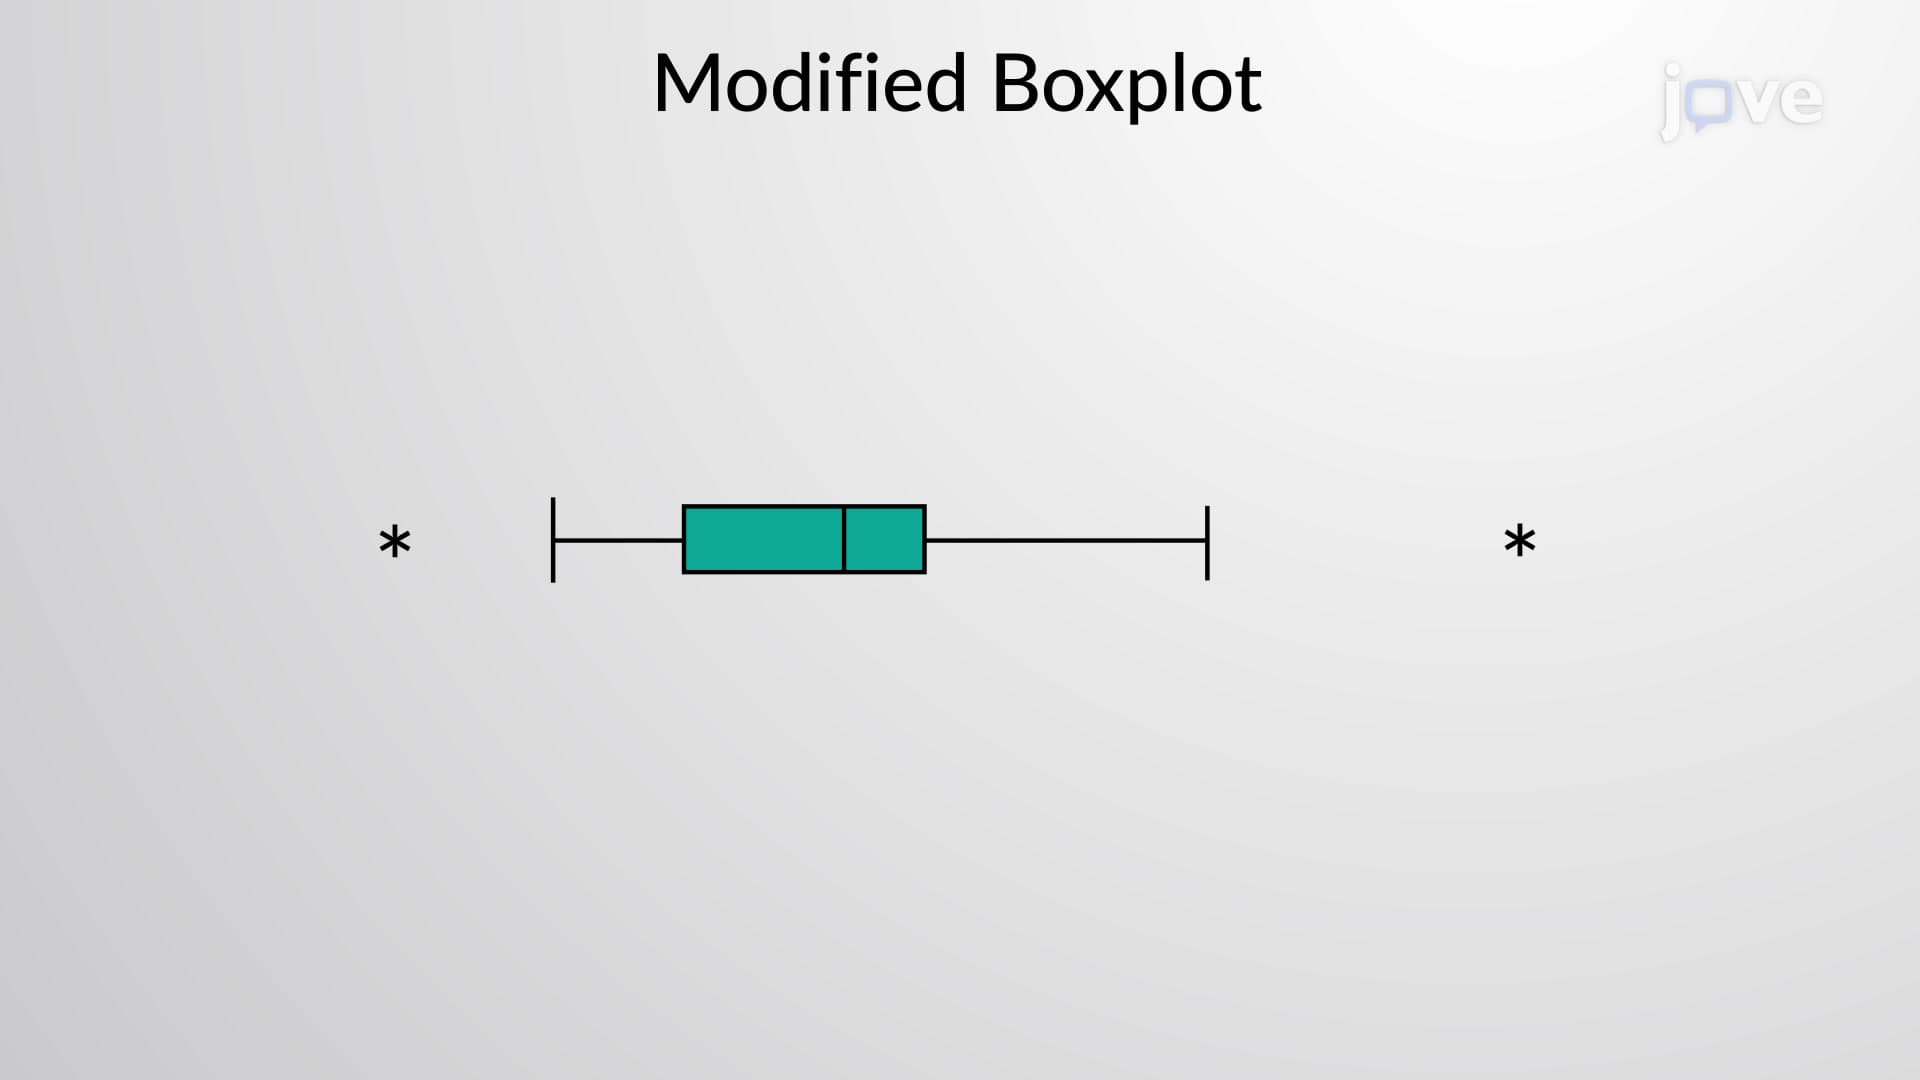
Outlier detection using quartiles follows a standardized approach: values below Q1 - 1.5(IQR) or above Q3 + 1.5(IQR) are considered statistical outliers. This 1.5 × IQR rule appears frequently on AP Statistics exams and helps identify data points requiring further investigation in research contexts.
Quartiles appear throughout American education and industry. College admissions offices use quartile analysis to evaluate applicant pools-knowing that your GPA falls in the third quartile at Harvard means you've exceeded 75% of applicants. Similarly, healthcare professionals analyze patient vital signs using quartile comparisons to identify concerning outliers.
In business analytics, companies like Amazon use quartile analysis to segment customers, optimize pricing strategies, and identify high-value clients. Understanding quartiles prepares students for advanced statistics courses, economics programs, and data-driven career paths across STEM and business fields.
Related Micro-courses