Loading subject page…

- Statistics
- Measures of Relative Standing
- Review and Preview
Micro-course: Measures of Relative Standing
77,400 views
Learn key concepts and earn your certificate.




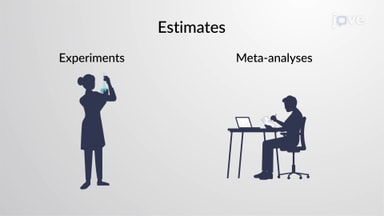
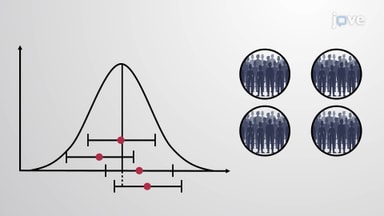
Review and Preview


00:00
01:10
Video Summary: What Is Review and Preview
Did you know that a student scoring 85% on the SAT Math section could rank anywhere from the 50th to 99th percentile depending on the test date? Review and preview techniques help statisticians and students alike understand where individual data points stand relative to the entire dataset. When analyzing standardized test scores across US high schools, educational researchers use measures of central tendency, variation, and relative standing to interpret performance patterns. Understanding What is Review And Preview becomes crucial for making sense of statistical comparisons in academic and professional settings. Watch the full video on JoVE Coach to master this concept with expert-led visuals and step-by-step explanations.
- Understand What is Review And Preview as a statistical framework for interpreting data relationships and relative positioning
- Identify the three main categories of statistical measures: central tendencies, variations, and relative standing
- Analyze how measures like mean, median, and mode represent typical values within datasets
- Compare different measures of variation including range and standard deviation to assess data spread
- Evaluate relative standing using percentiles, z-scores, and quartiles for meaningful data interpretation
- Apply statistical comparison techniques to real-world scenarios like standardized test score analysis
- Recognize the importance of context when interpreting individual data points within larger populations
- Explore visualization methods like boxplots to summarize and communicate statistical findings effectively
Understanding Review And Preview in Statistical Analysis
Review and preview represents a comprehensive approach to statistical data interpretation that moves beyond simple data collection to meaningful analysis. This methodology involves systematically examining datasets through multiple statistical lenses to extract actionable insights. In US educational contexts, this approach proves invaluable when analyzing everything from AP exam scores to college admission statistics.
Measures of Central Tendency: Finding the Typical Value
The foundation of any statistical review begins with identifying representative values through measures of central tendency. The mean provides the arithmetic average, while the median offers the middle value that's less affected by extreme scores. The mode identifies the most frequently occurring value. For instance, when analyzing SAT Math scores across California high schools, the mean might be 520, the median 515, and the mode 500, each telling a different story about student performance patterns.
Measures of Variation: Understanding Data Spread
Understanding review and preview basics requires grasping how data spreads around central values. The range simply measures the difference between highest and lowest values, while standard deviation provides a more sophisticated measure of how individual data points deviate from the mean. In college admissions, a university might report an average GPA of 3.7 with a standard deviation of 0.3, indicating that most accepted students fall between 3.4 and 4.0 GPA range.
Measures of Relative Standing: Context Through Comparison
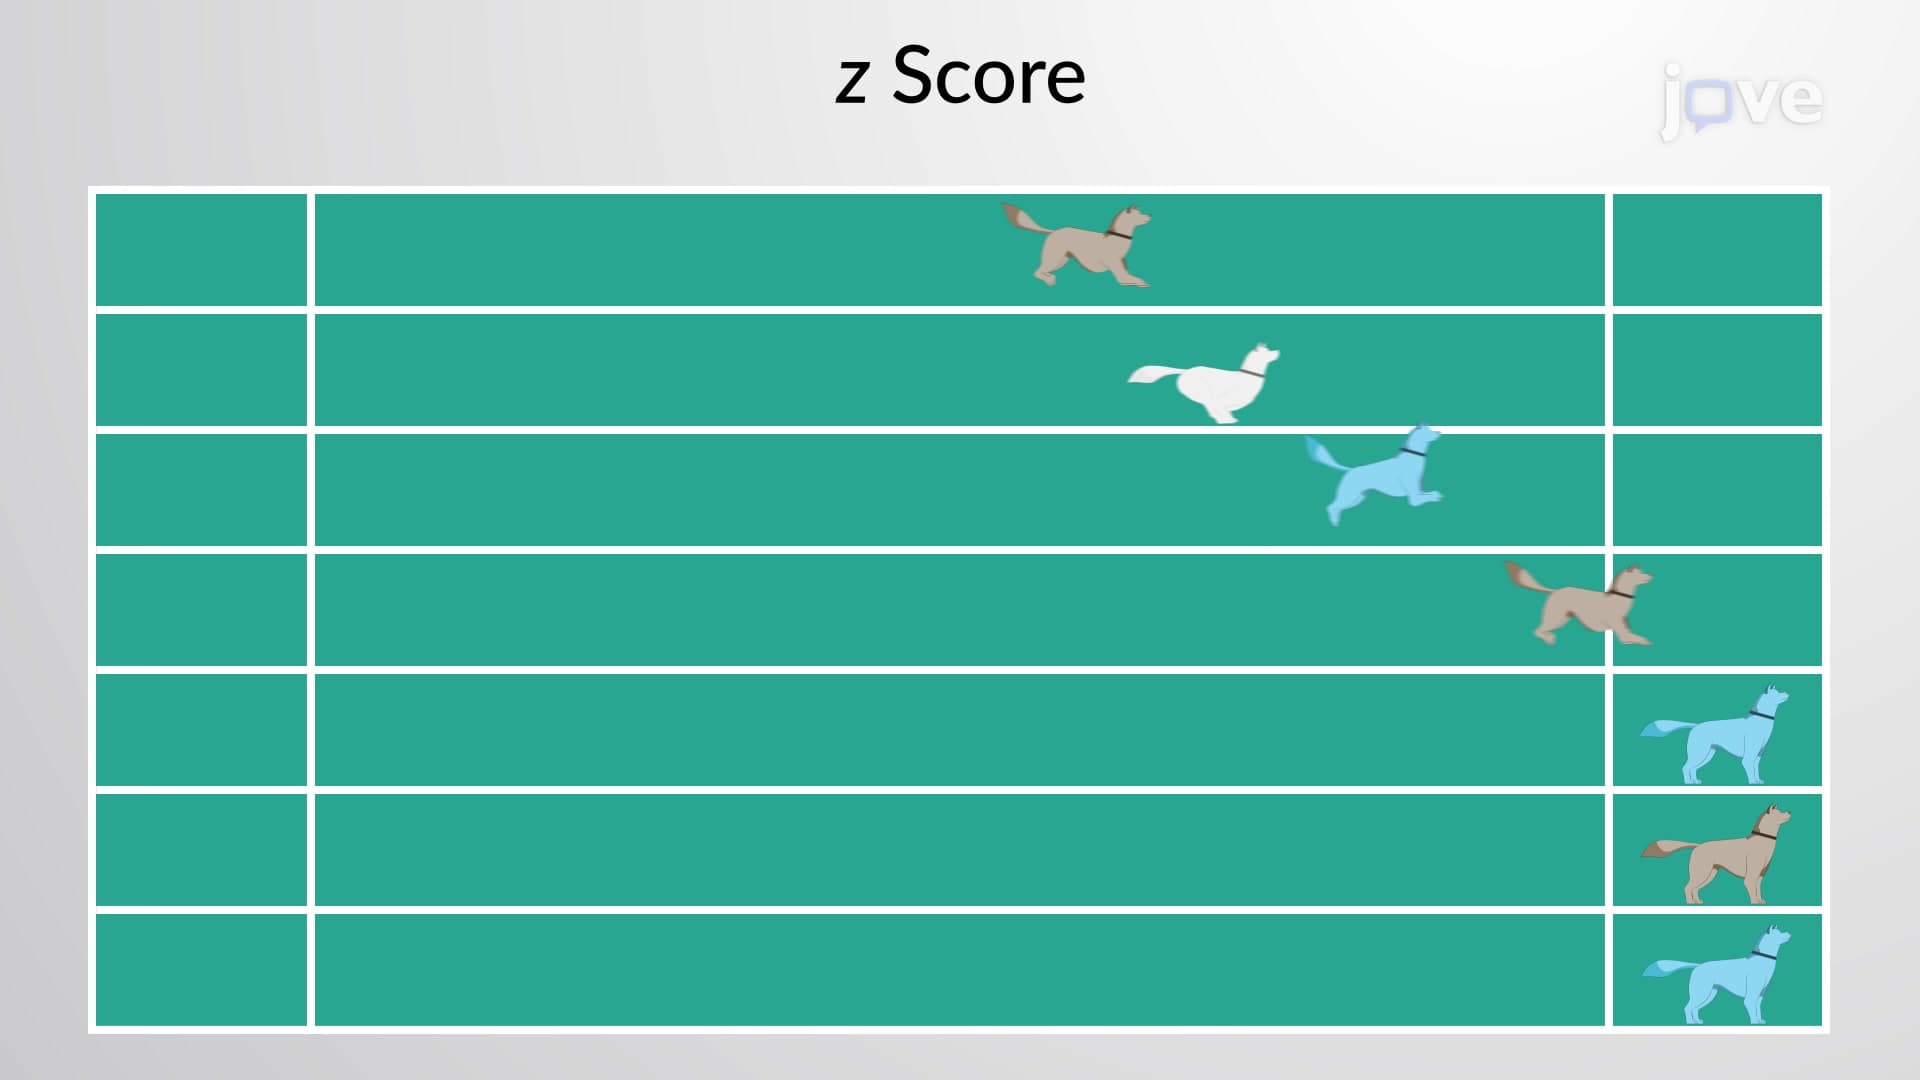
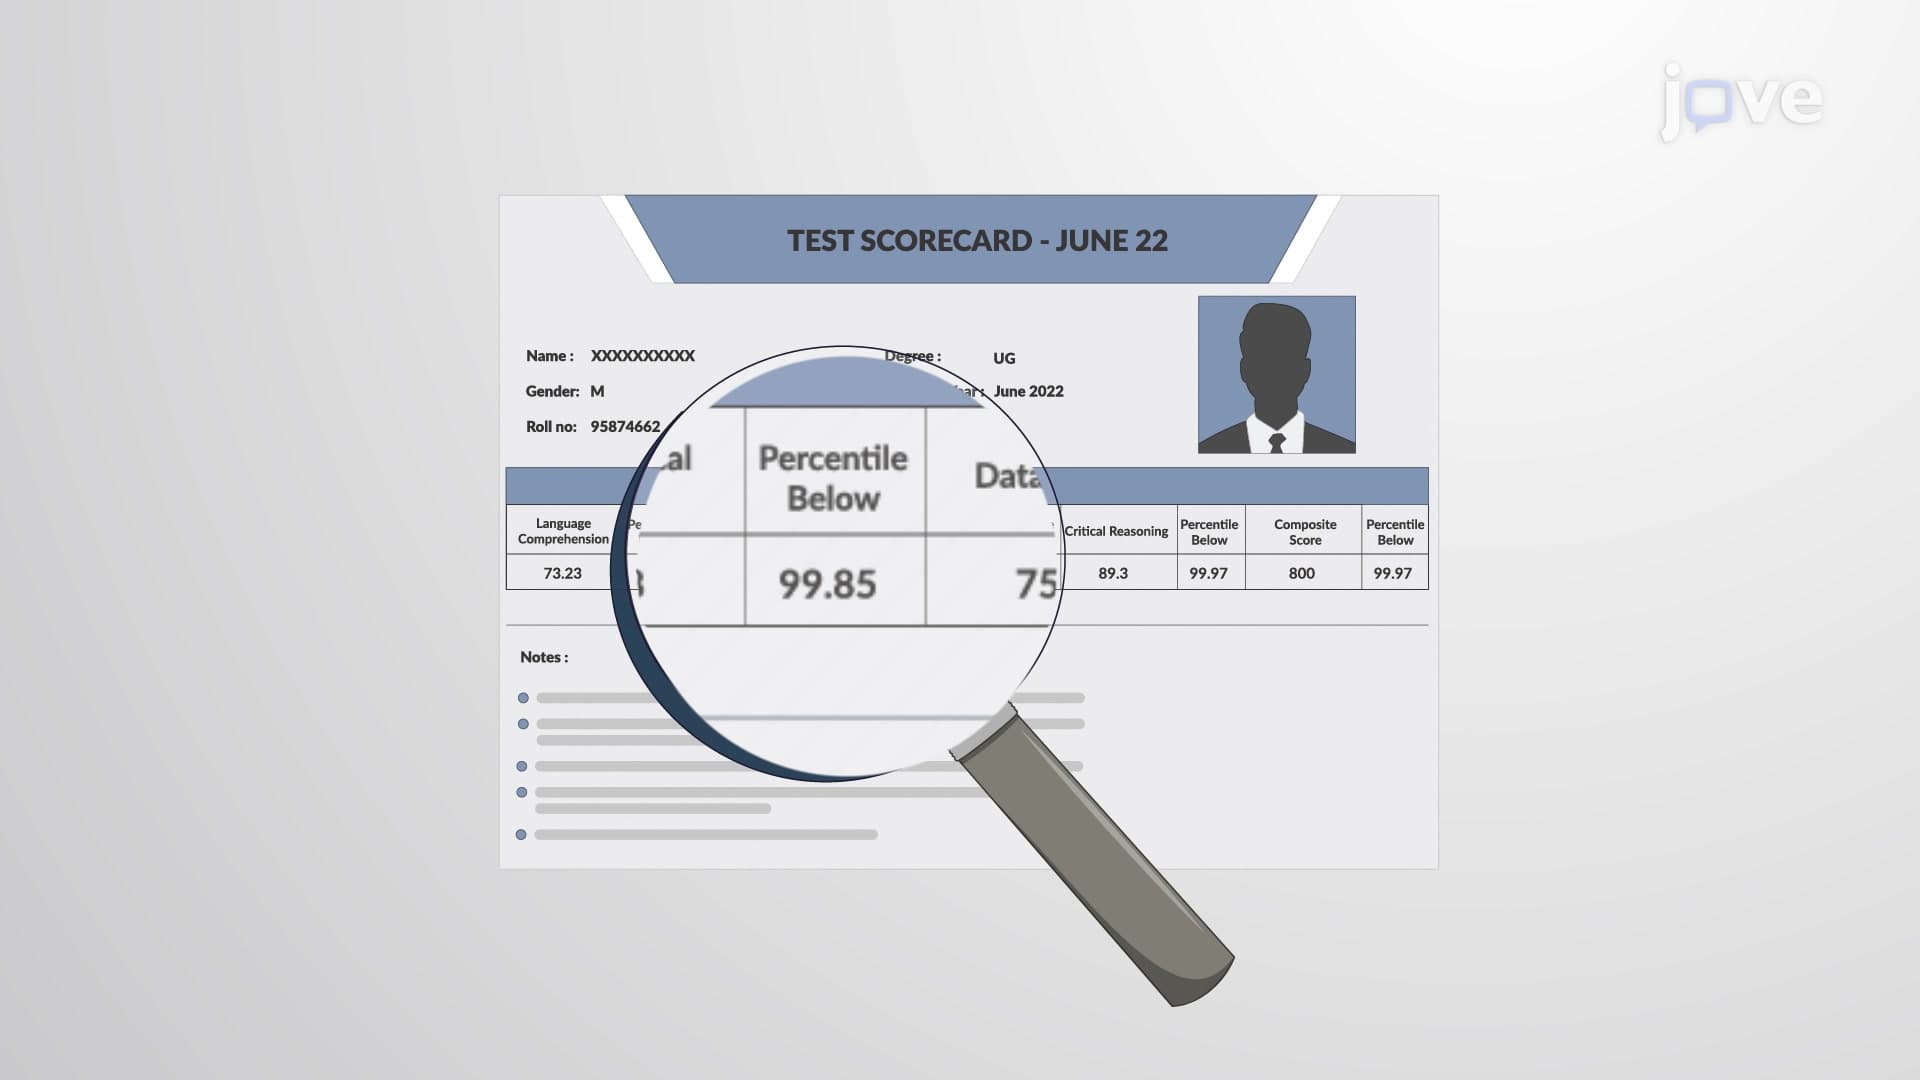
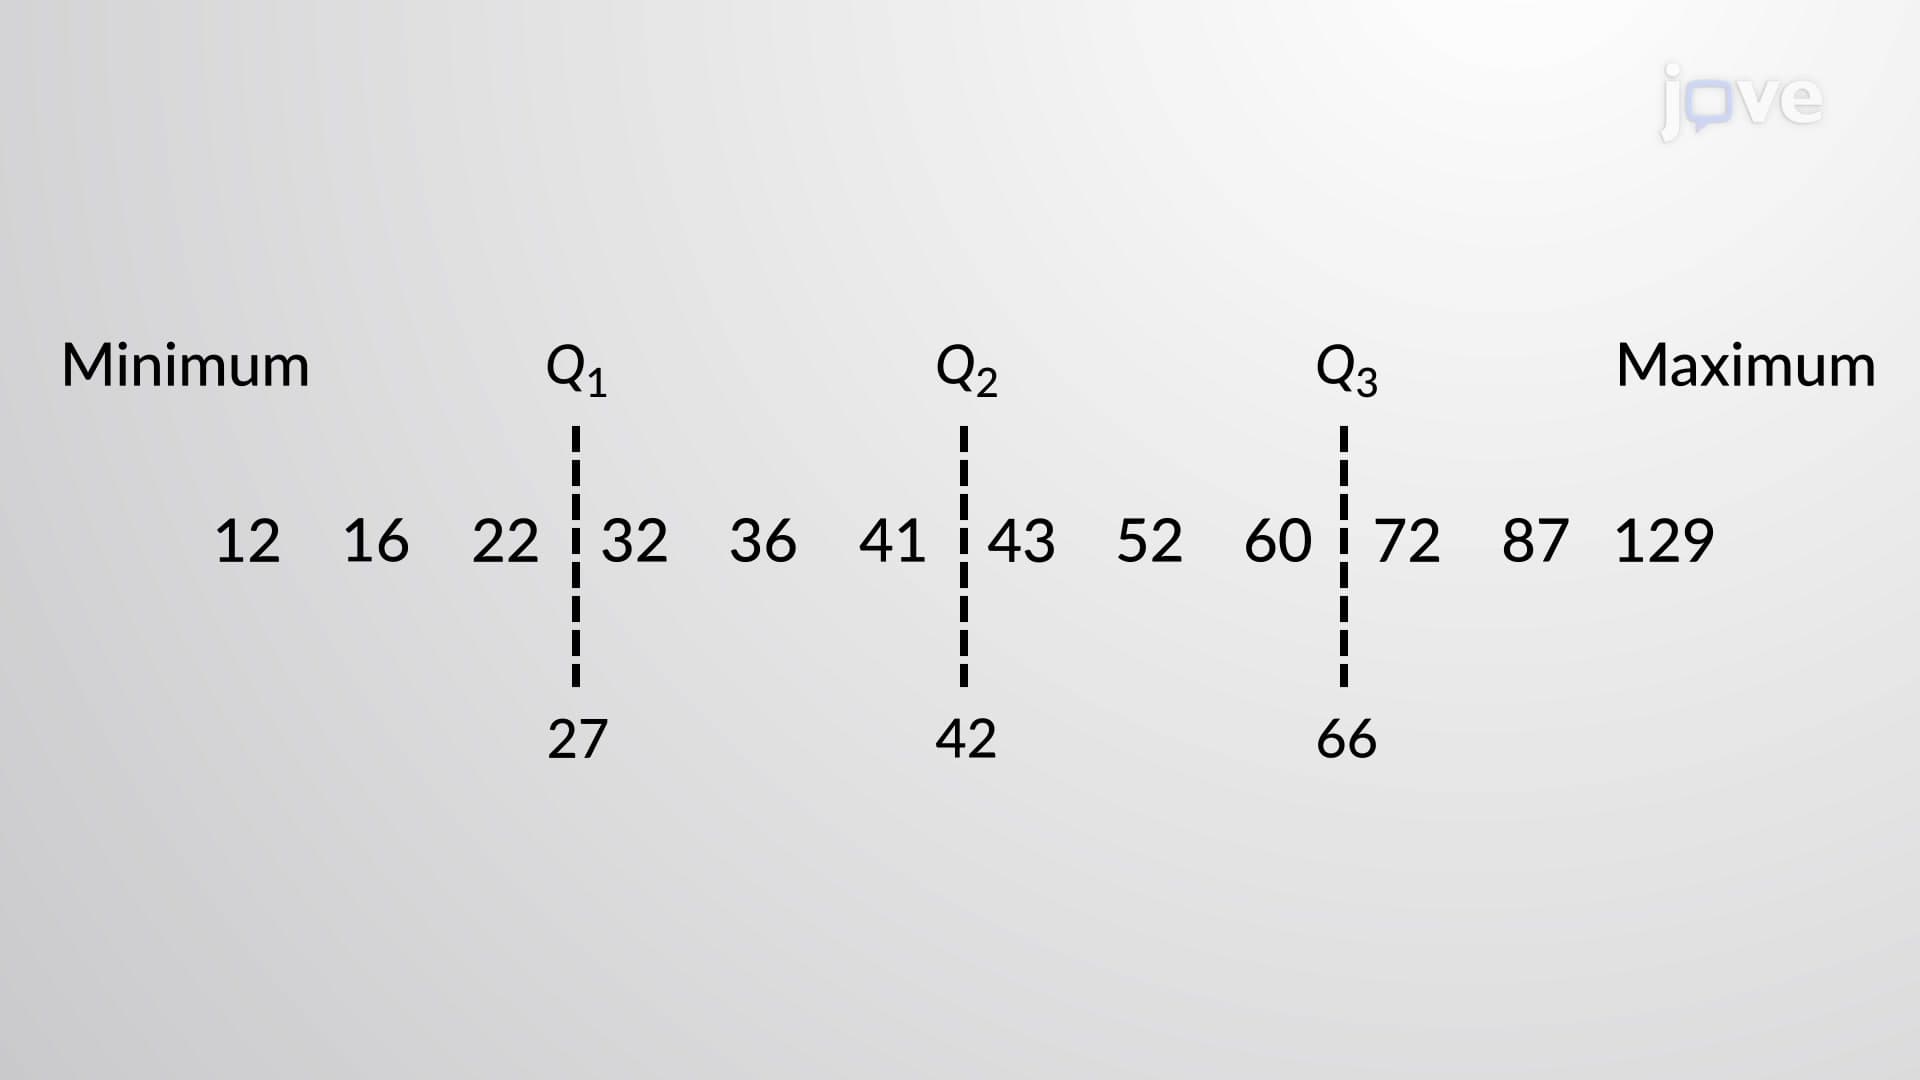
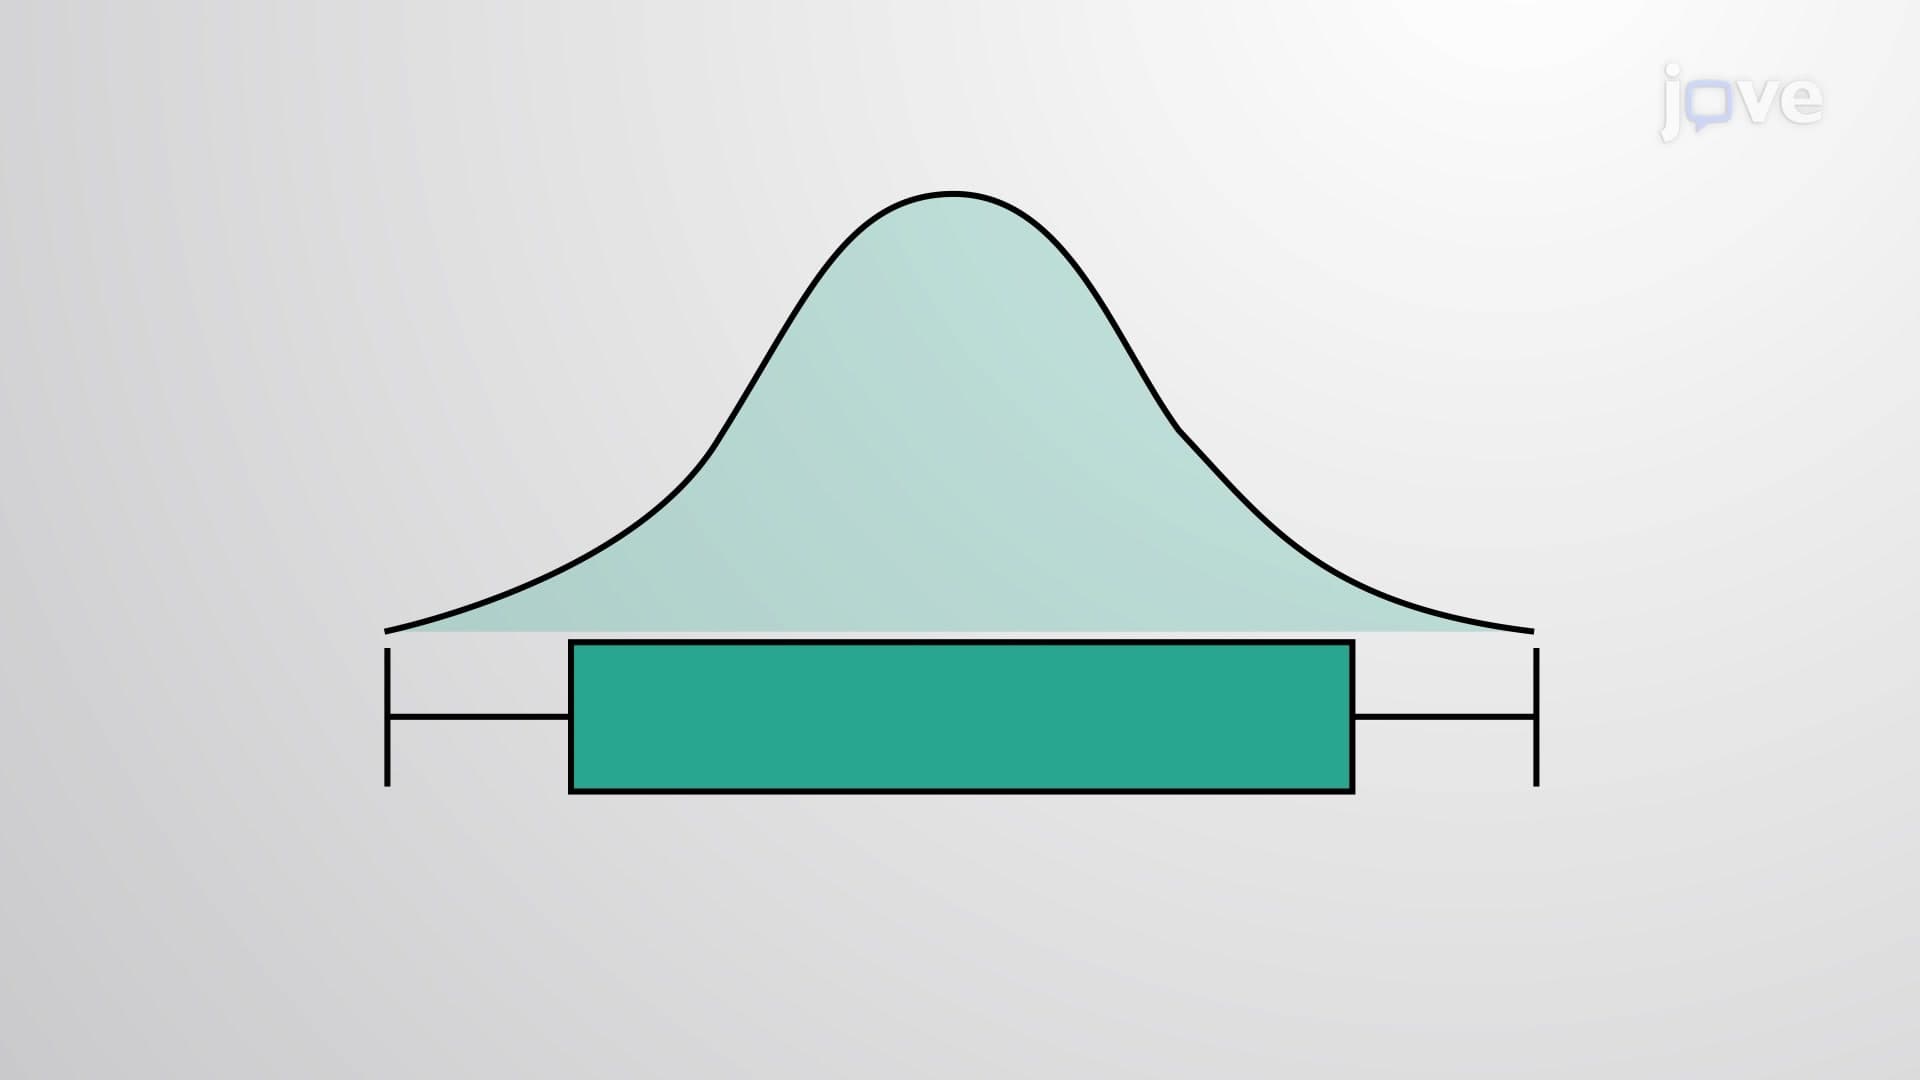
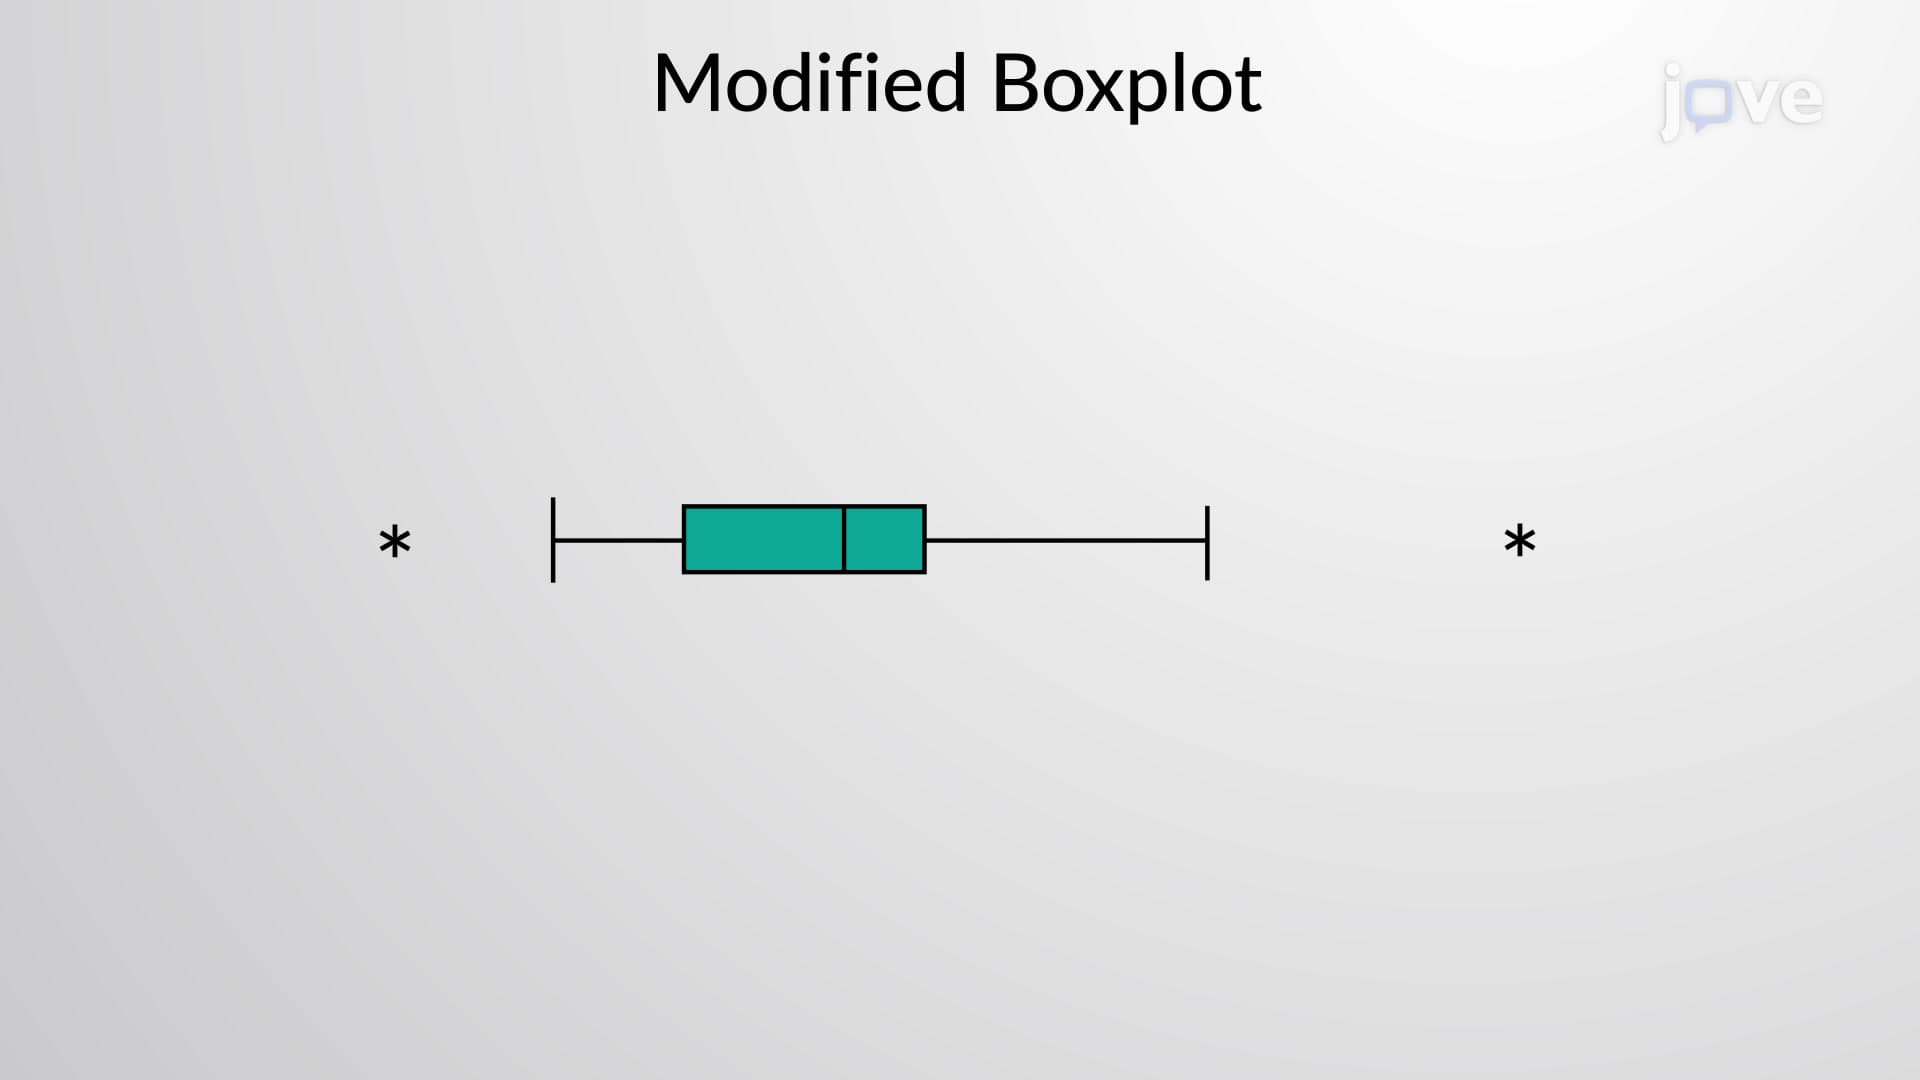
The most powerful aspect of review and preview concept lies in relative standing measures. Percentiles divide data into 100 equal groups, making them particularly useful for standardized test interpretation. A student scoring in the 85th percentile performed better than 85% of test-takers. Z-scores standardize data by showing how many standard deviations a value falls from the mean, with scores beyond ±2 considered unusual. Quartiles divide data into four equal parts, often visualized through boxplots that immediately reveal data distribution patterns.
This statistical framework appears frequently on AP Statistics exams, college statistics courses, and professional certification tests like the MCAT, where understanding relative performance proves crucial for competitive positioning.
Frequently Asked Questions
Review and preview is a systematic approach to statistical analysis that examines data through measures of central tendency, variation, and relative standing. This framework helps interpret individual data points within the context of the entire dataset. It's essential for understanding how specific values relate to overall patterns and distributions.
In standardized testing, review and preview techniques help interpret scores by comparing individual performance to population norms using percentiles and z-scores. For example, SAT scores are reported with percentile rankings that show relative standing among test-takers. This context transforms raw scores into meaningful performance indicators for college admissions.
AP Statistics extensively covers these concepts, particularly measures of relative standing and data interpretation. The MCAT includes statistical analysis in its scientific reasoning sections. College statistics courses test quartile calculations, z-score interpretations, and percentile rankings on midterms and finals.
Medical schools analyze MCAT scores using percentile rankings rather than just raw scores, comparing applicants to national test-taker populations. A 515 MCAT score might represent the 92nd percentile, providing context about competitive standing. Schools also examine score distributions across multiple test sections using quartile analysis.
Market research analysts use these techniques to interpret consumer survey data for Fortune 500 companies. Quality control engineers in manufacturing apply statistical measures to identify unusual production values. Healthcare administrators analyze patient outcome data using relative standing measures to benchmark hospital performance against national standards.
Basic algebra and arithmetic skills are sufficient for understanding review and preview concepts. Most calculations involve simple addition, division, and square root operations. The emphasis lies on interpreting results rather than complex mathematical computations, making these concepts accessible to high school students.
Focus on practicing real data interpretation rather than memorizing formulas. Work through sample problems involving percentile calculations, z-score interpretations, and boxplot analysis. Create study cards linking statistical measures to practical scenarios like test scores or business metrics for better retention.
Hypothesis testing relies heavily on z-scores and standard deviations for determining statistical significance. Regression analysis extends relative standing concepts to predict relationships between variables. Quality control and Six Sigma methodologies apply these foundational concepts to industrial process improvement.
Related Micro-courses