Loading subject page…


77,400 views


Video Summary: What Is What are Outliers
Did you know that a single extreme SAT score can completely skew a school's reported averages? Outliers are data points that dramatically differ from the rest of your dataset-like when one student scores 1600 while classmates average 1200. These unusual values can be identified through three main statistical methods: interquartile range calculations, z-scores, and boxplot analysis. Watch the full video on JoVE Coach to master this concept with expert-led visuals and step-by-step explanations.
Outliers represent the rebels of the data world-values that refuse to follow the crowd and stand dramatically apart from their peers. In statistical terms, these are observations that lie an abnormal distance from other values in a dataset. Think of them as the students who score 98% when the class average is 75%, or the house that sells for $2 million in a neighborhood where typical homes cost $300,000.
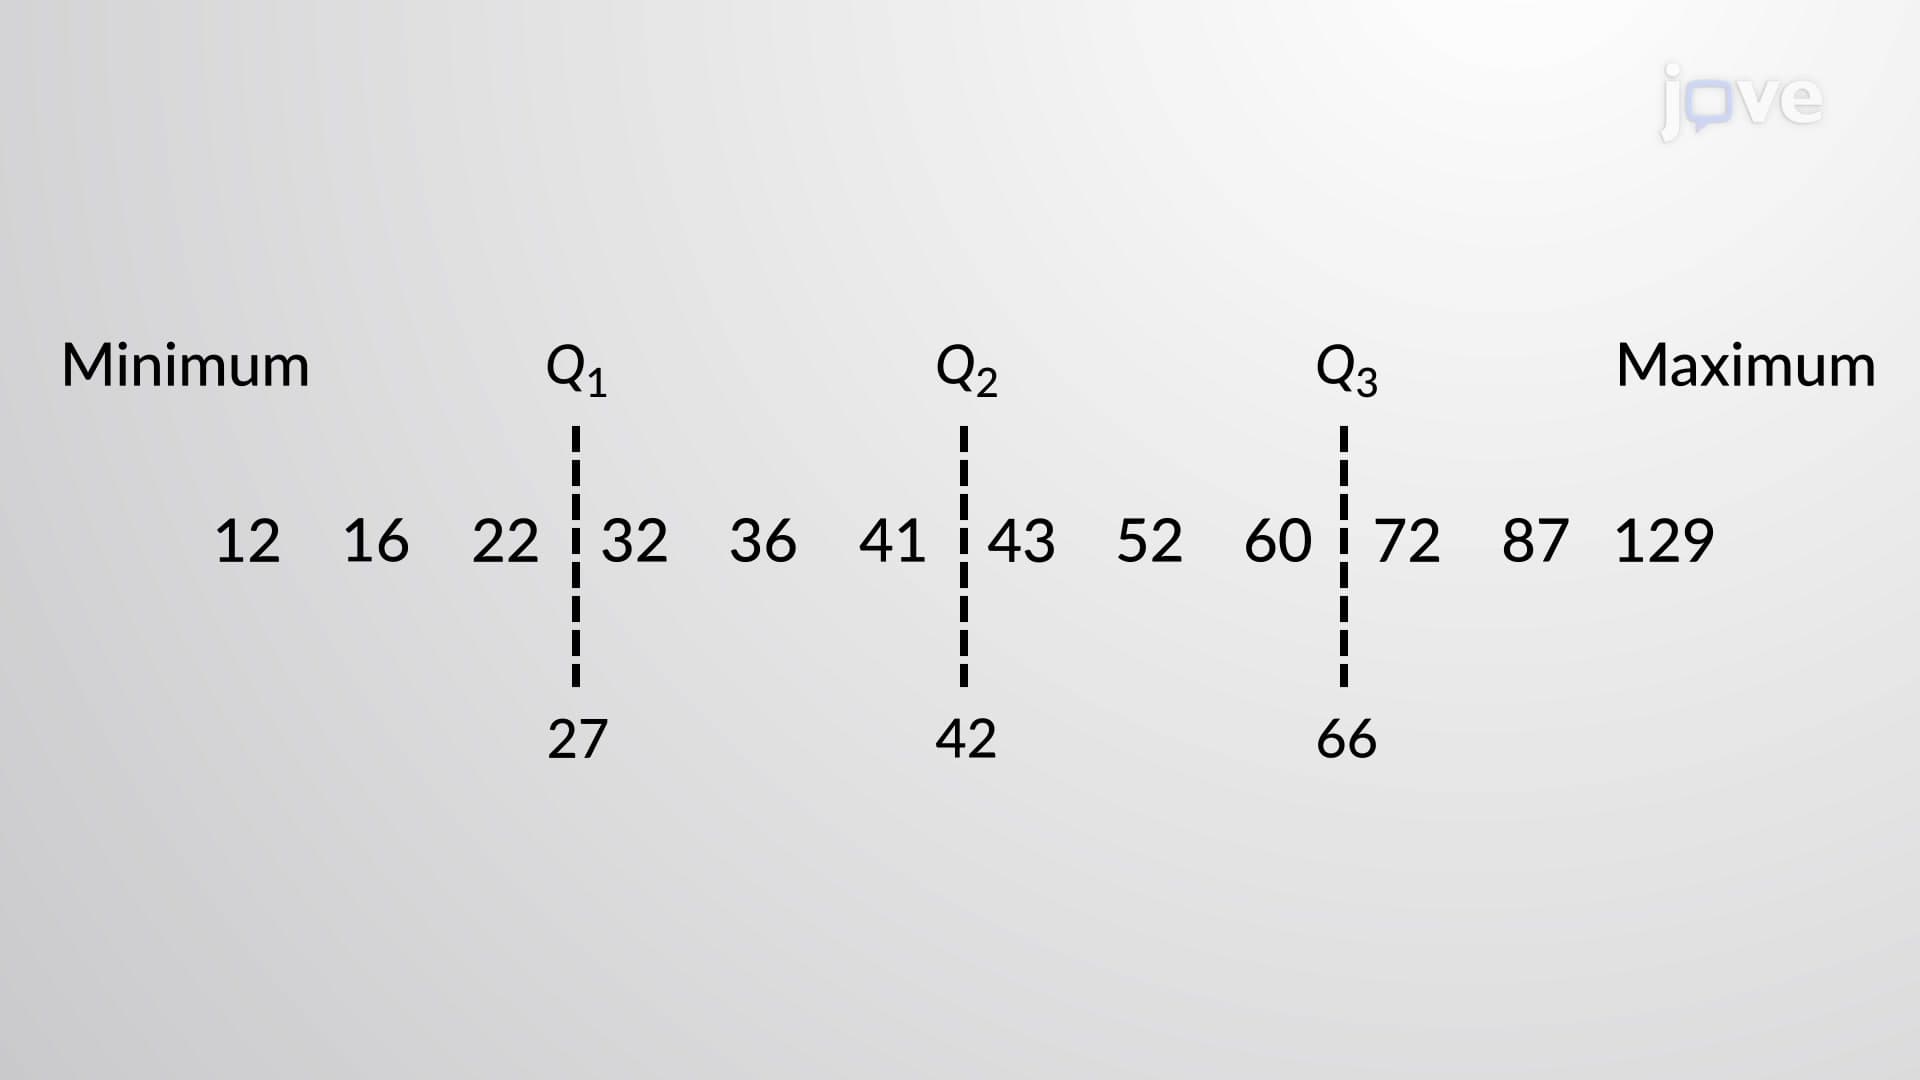
Interquartile Range (IQR) Method The most robust approach uses the interquartile range to establish boundaries. Calculate Q1 (25th percentile) and Q3 (75th percentile), then find IQR = Q3 - Q1. Any value below Q1 - 1.5(IQR) or above Q3 + 1.5(IQR) qualifies as an outlier. This method appears frequently on AP Statistics exams and college statistics courses because it's less sensitive to extreme values than other techniques.
Z-Score Analysis Z-scores measure how many standard deviations a value sits from the mean. Values with z-scores beyond ±2 (covering roughly 95% of normal distributions) are typically considered outliers, while those beyond ±3 are almost certainly unusual. This approach proves particularly valuable in SAT/ACT prep courses when analyzing test score distributions.
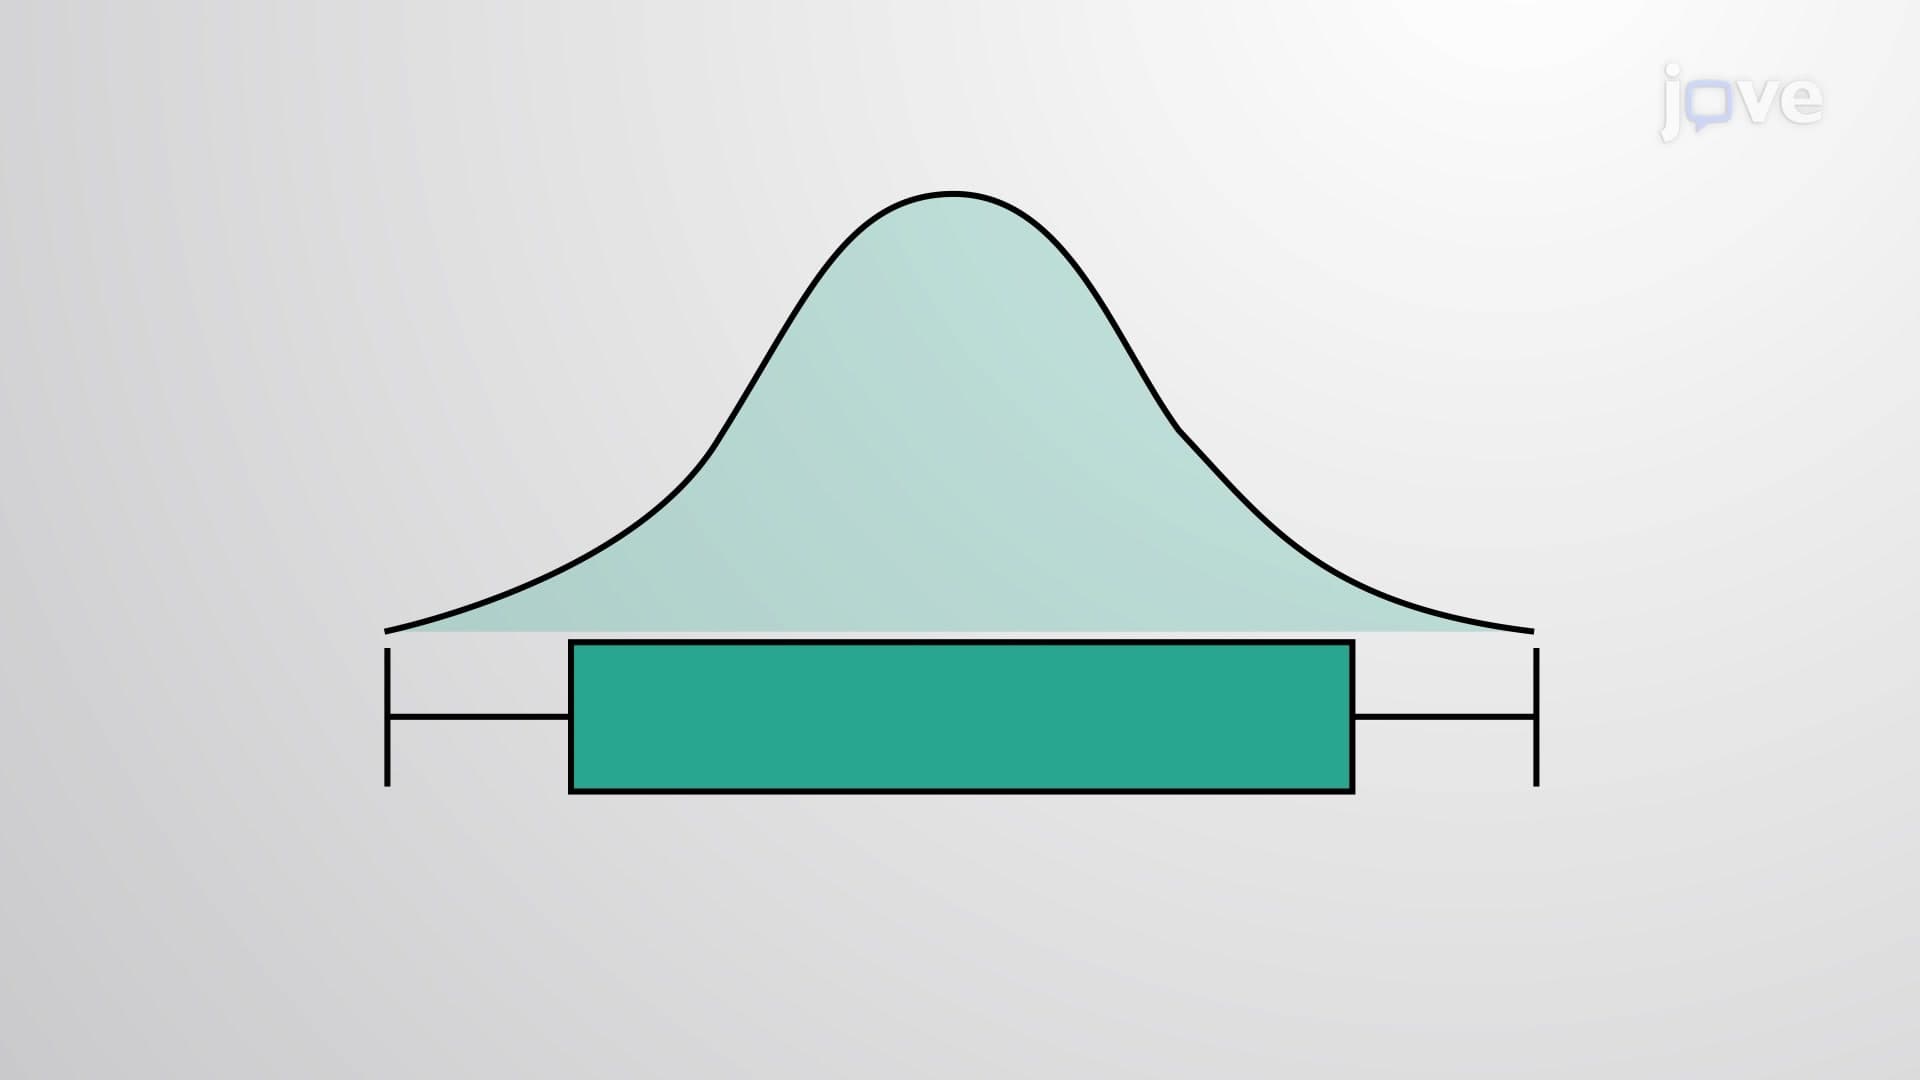
Boxplot Visualization Box plots provide immediate visual outlier identification. Any data point extending beyond the "whiskers" (typically 1.5 × IQR from the box edges) appears as individual dots, clearly marking outliers. This visual method helps students quickly spot unusual values in datasets.
Outliers significantly influence statistical calculations. A single billionaire in a neighborhood income survey can inflate the mean dramatically, making median income a better representative measure. In medical research, outlier patients might represent rare genetic variants or measurement errors-determining which requires careful analysis.
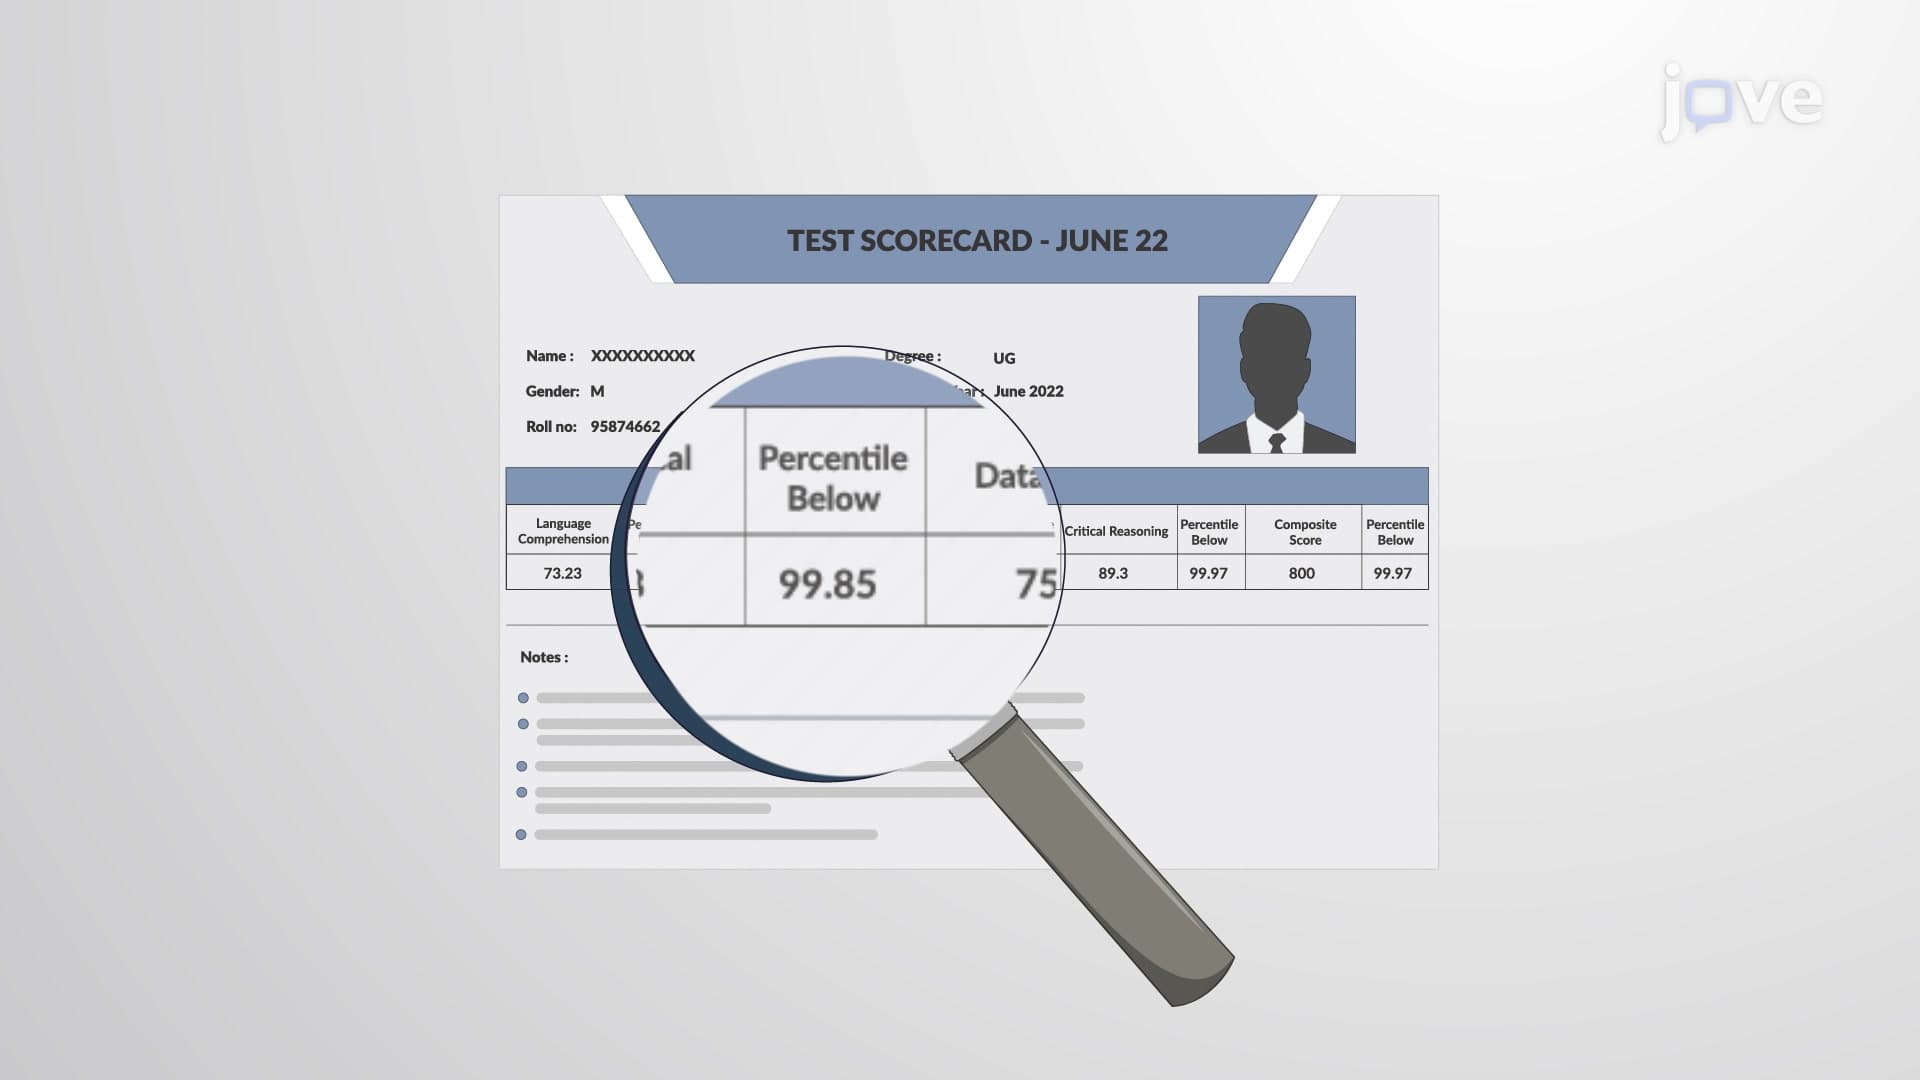
For college entrance exam preparation, understanding outliers helps interpret percentile rankings. If you score 1450 on the SAT while most test-takers score between 1000-1200, you're essentially an outlier in the positive direction.
Students preparing for AP Statistics or introductory college statistics should practice identifying when to retain versus remove outliers. Legitimate extreme values (like recording Olympic athletes' performance times alongside recreational runners) should remain, while obvious errors (negative heights, impossible test scores) require correction or removal.
Related Micro-courses