Loading subject page…


5,239 views


Video Summary: Activity Ratios Working Capital Turnover Ratio Explained
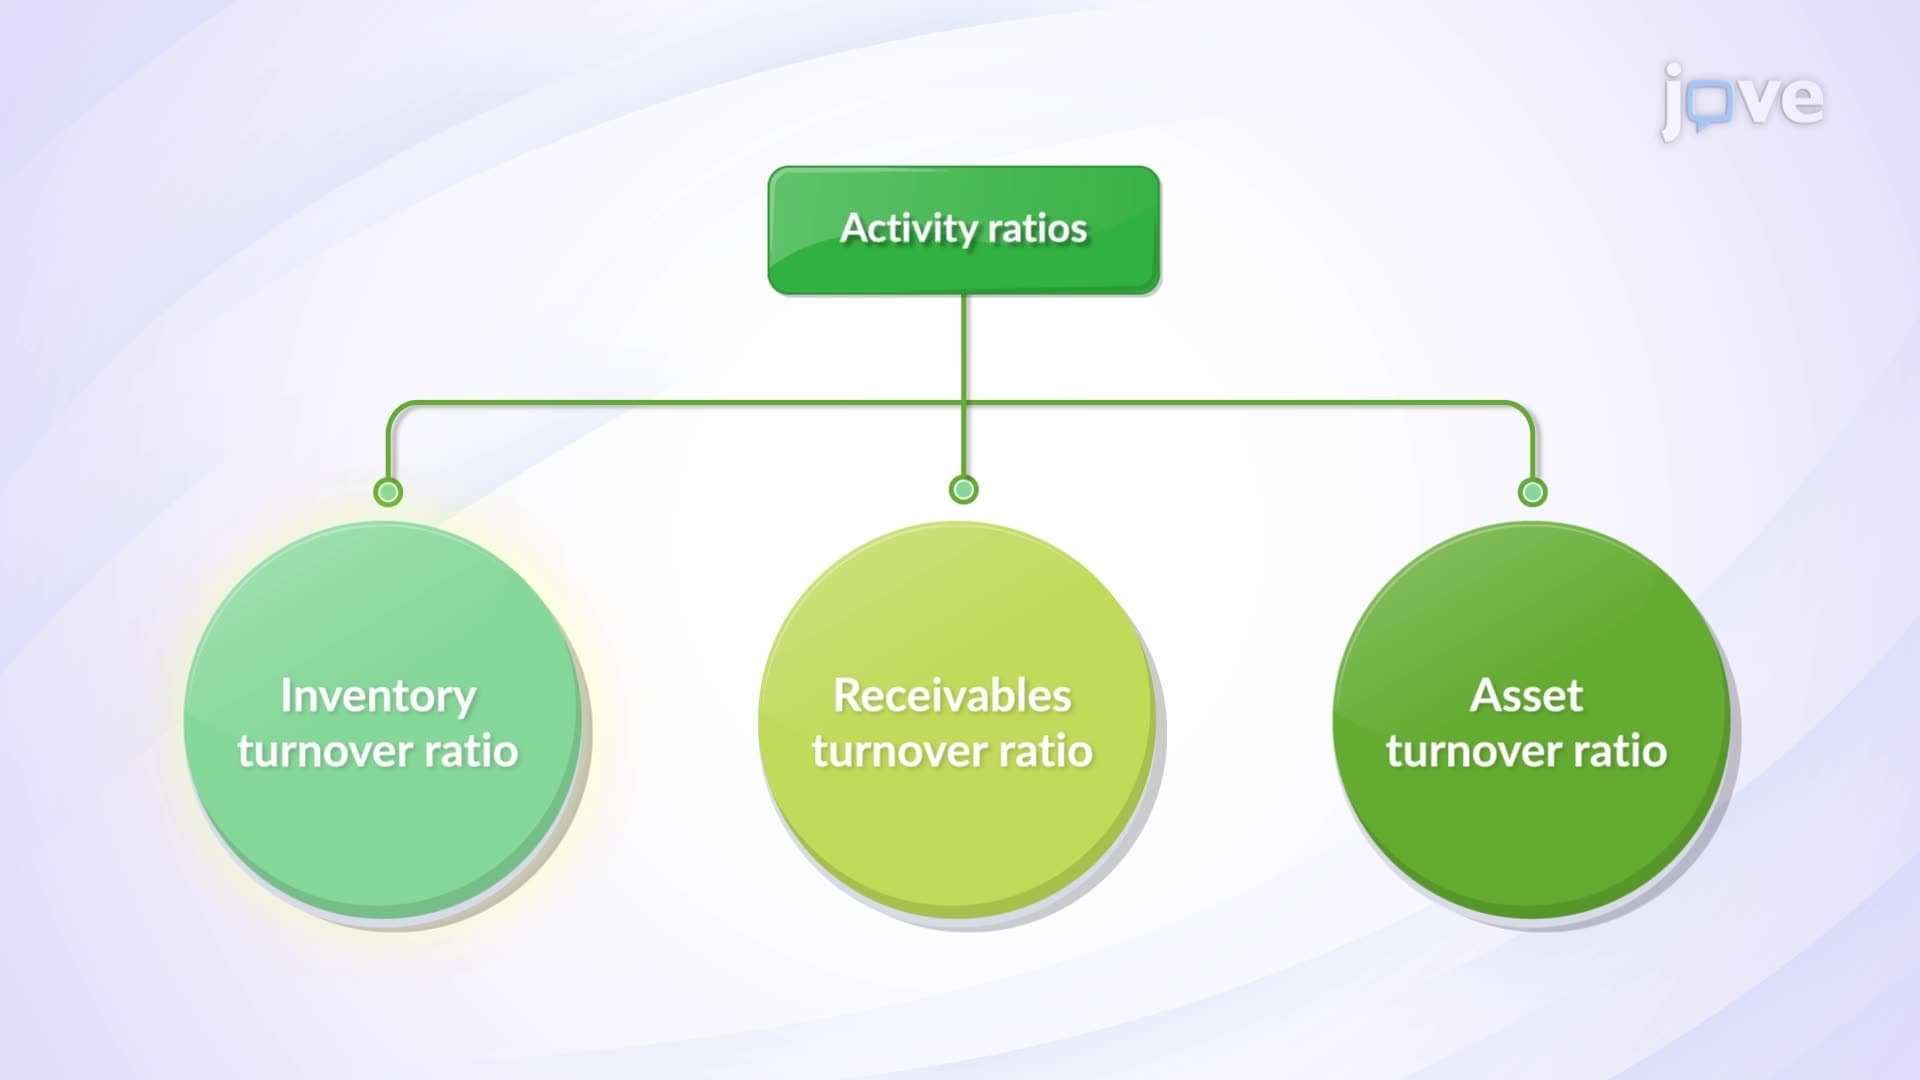
Activity ratios working capital metrics are essential for executives evaluating operational efficiency in today's competitive landscape. The Working Capital Turnover Ratio reveals how effectively companies like Walmart generate sales from their operational capital-a critical metric for boards assessing management performance. This ratio, calculated as net sales divided by average working capital, directly impacts cash flow decisions and growth strategies. Watch the full video on JoVE Coach to master this concept with expert-led visuals and step-by-step explanations.
Consider Amazon's operational challenge: managing billions in inventory while maintaining rapid customer fulfillment. The Working Capital Turnover Ratio serves as a critical gauge for executives navigating this balance between operational efficiency and growth investment. This activity ratio measures how effectively management converts every dollar of working capital into sales revenue-a key performance indicator that directly impacts shareholder value and competitive positioning.
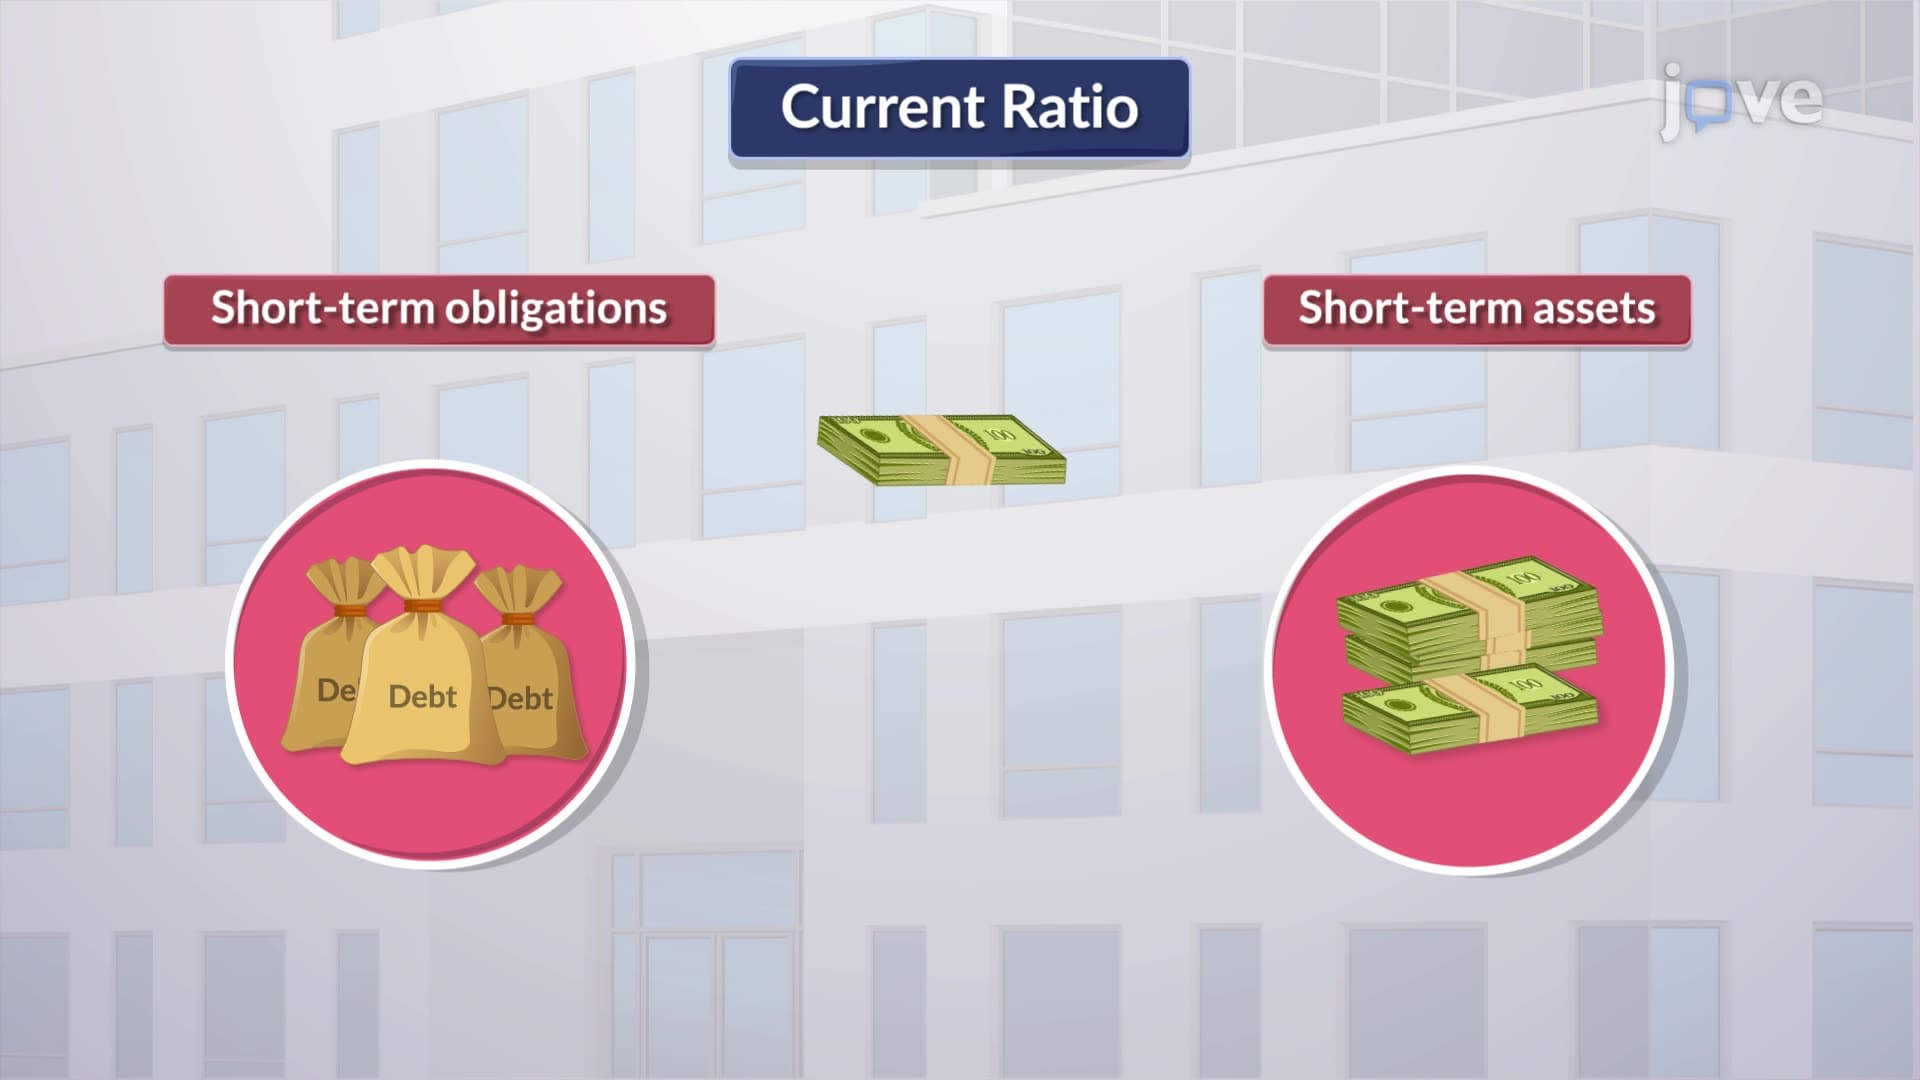
The formula is straightforward: Net Sales ÷ Average Working Capital = Working Capital Turnover Ratio. However, the strategic implications run deep. When Target reports a ratio of 6.2, it signals the retailer generates $6.20 in sales for every dollar of working capital. This efficiency metric influences everything from credit facility negotiations to expansion decisions.
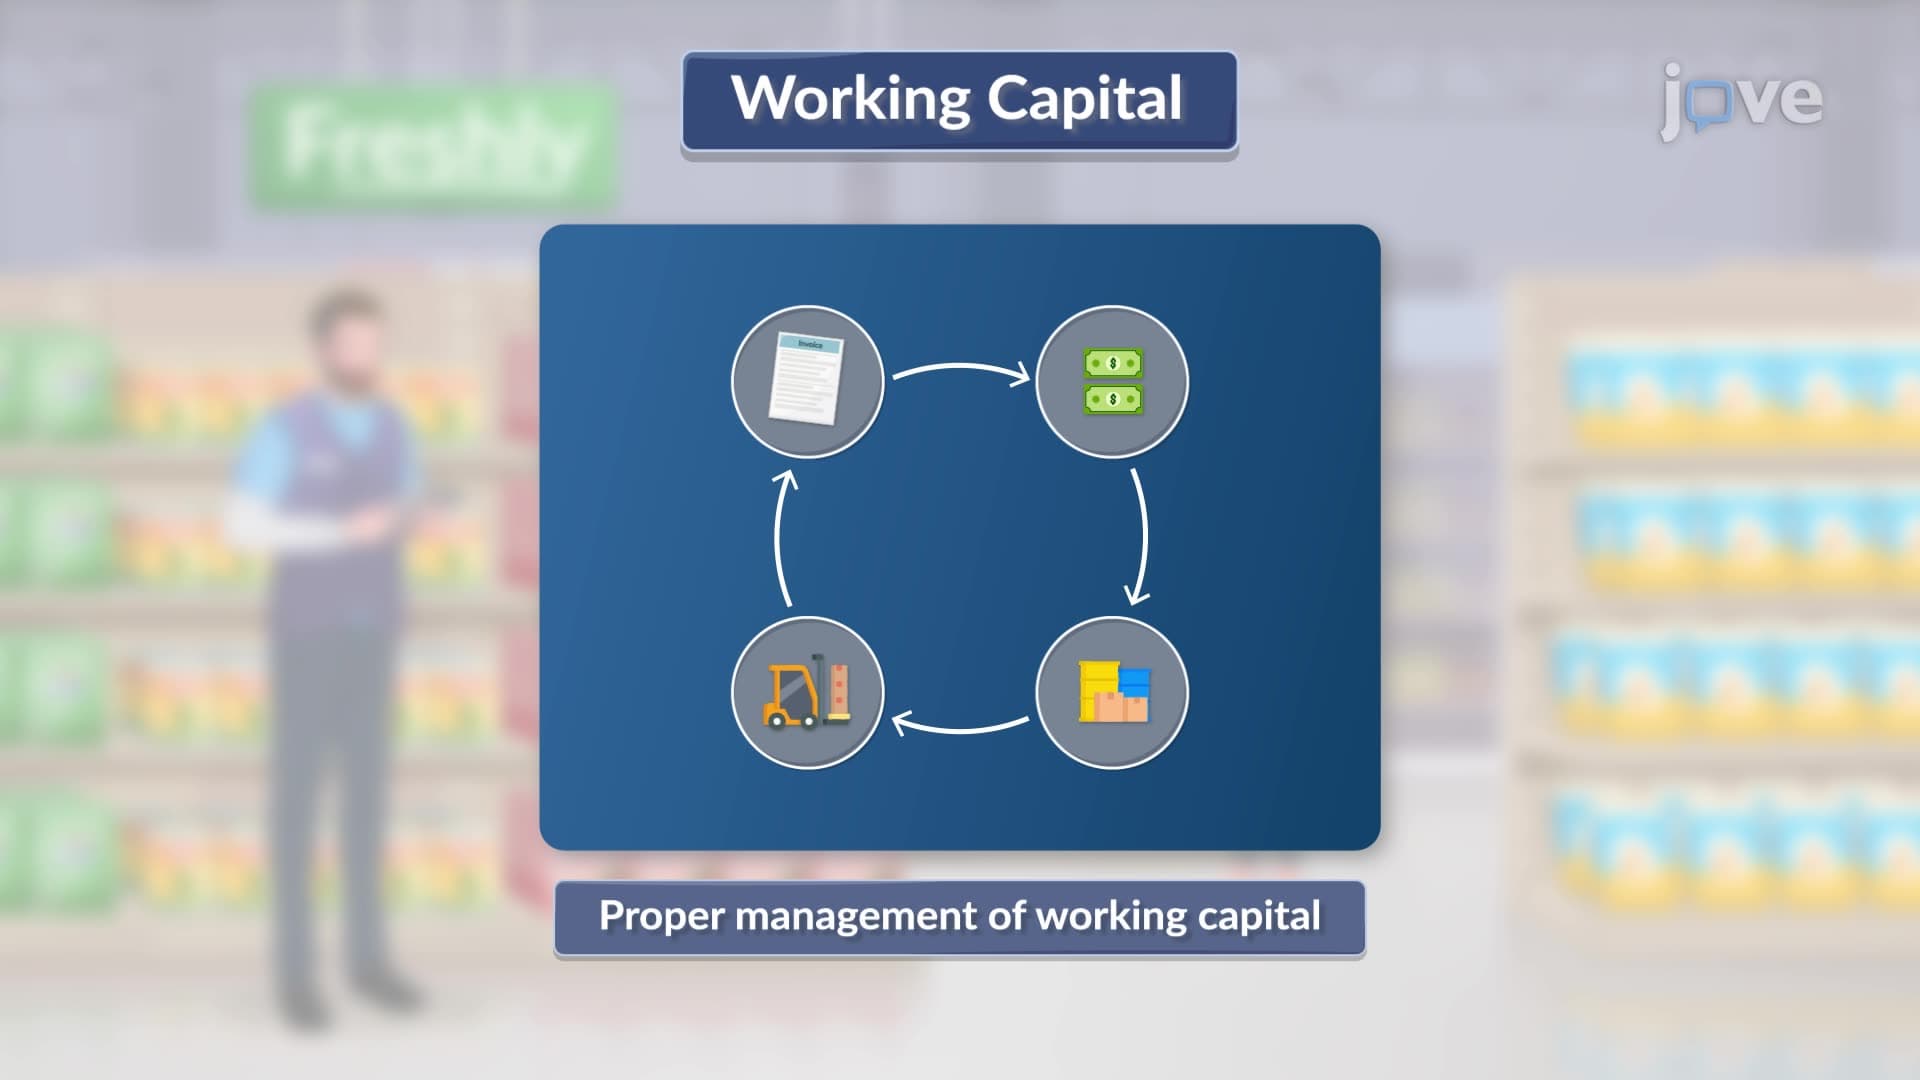
Working capital encompasses current assets minus current liabilities-essentially the cash and near-cash resources funding daily operations. For manufacturing companies like General Motors, this includes inventory, accounts receivable, and cash, offset by accounts payable and short-term debt.
High ratios often indicate operational excellence, but executives must scrutinize the underlying drivers. A pharmaceutical company achieving a 7.0 ratio might signal efficient operations or dangerous under-capitalization that could disrupt R&D programs or supply chain reliability. Conversely, a technology firm with a 2.5 ratio might indicate conservative cash management appropriate for volatile markets, or operational inefficiencies requiring management attention.
Industry context proves crucial. Grocery chains like Kroger typically operate with higher ratios due to rapid inventory turnover and supplier financing advantages, while capital-intensive manufacturers maintain lower ratios reflecting longer cash conversion cycles.
Finance executives use this ratio to optimize cash conversion cycles, negotiate supplier terms, and establish credit policies. Operations leaders leverage the metric to identify inventory management opportunities and streamline accounts receivable processes. Board members monitor ratio trends to assess management effectiveness and competitive positioning.
The ratio also influences capital allocation decisions. Companies with declining ratios may need to divest non-performing assets, while those with excessive ratios might benefit from strategic investments in working capital to support sustainable growth initiatives.
Related Micro-courses