Loading subject page…

- Finance
- Financial Ratio Analysis
- Profitability Ratios: Return on Capital Employed
Micro-course: Financial Ratio Analysis
5,238 views
Learn key concepts and earn your certificate.









Profitability Ratios: Return on Capital Employed

00:00
01:18
Video Summary: Profitability Ratios Return on Capital Employed Explained
When Fortune 500 CFOs evaluate acquisition targets or board members assess management performance, profitability ratios return capital analysis drives critical decisions. Return On Capital Employed reveals how efficiently companies like Apple or Microsoft convert invested capital into profits, separating high-performing operations from capital-intensive underperformers. This metric influences everything from executive compensation to strategic resource allocation. Watch the full video on JoVE Coach to master this concept with expert-led visuals and step-by-step explanations.
- Apply Return On Capital Employed calculations to evaluate potential investment opportunities and benchmark your company's capital efficiency against industry leaders
- Analyze management's capital allocation effectiveness by comparing ROCE trends across multiple fiscal periods and identifying performance inflection points
- Evaluate acquisition targets by assessing their capital productivity and determining whether premium valuations reflect superior operational efficiency
- Implement ROCE benchmarking in strategic planning sessions to identify underperforming business units requiring capital redeployment or divestiture
- Compare competing companies within your industry using standardized ROCE metrics to inform competitive positioning and market entry decisions
- Leverage ROCE insights during board presentations to justify capital expenditure requests and demonstrate expected returns on proposed investments
- Identify early warning signals of declining operational efficiency through systematic ROCE monitoring and establish corrective action triggers
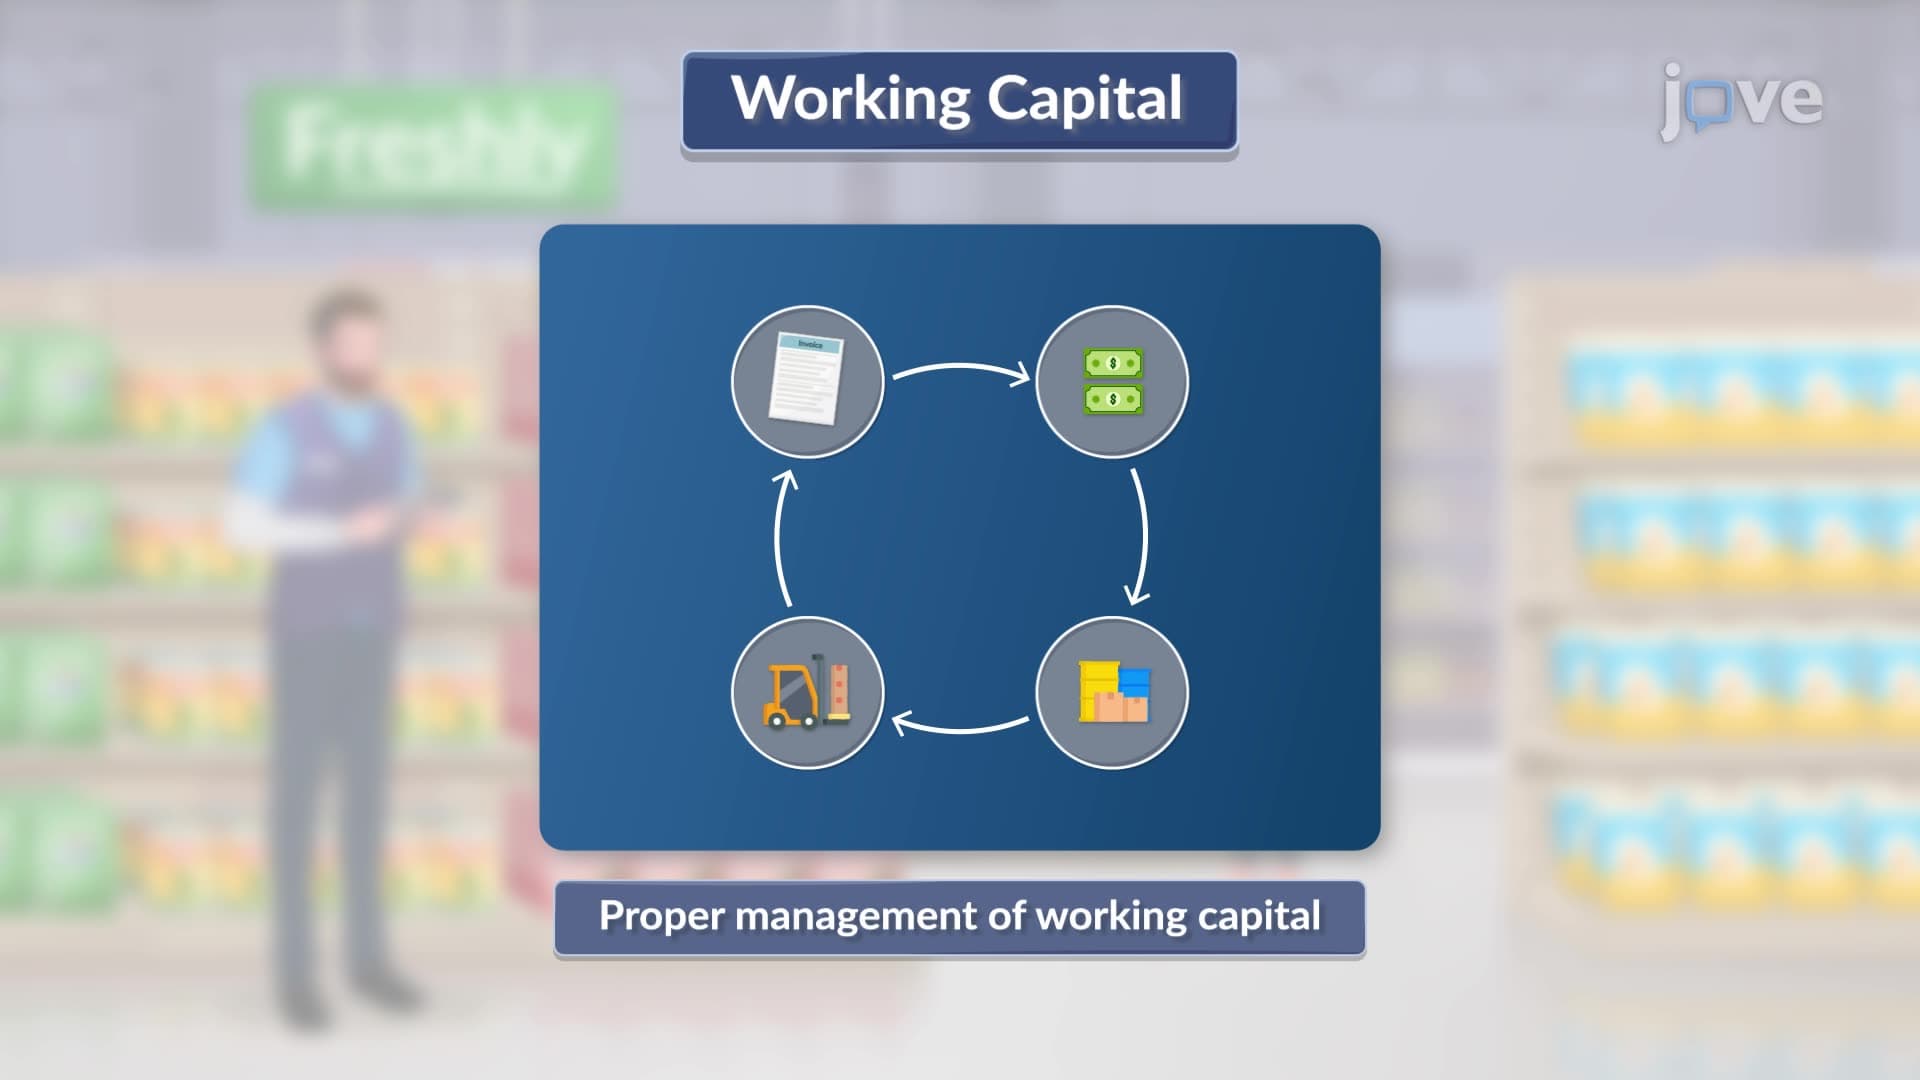
- Assess your organization's working capital optimization opportunities by analyzing ROCE components and their impact on overall financial performance
Understanding Return On Capital Employed in Strategic Context
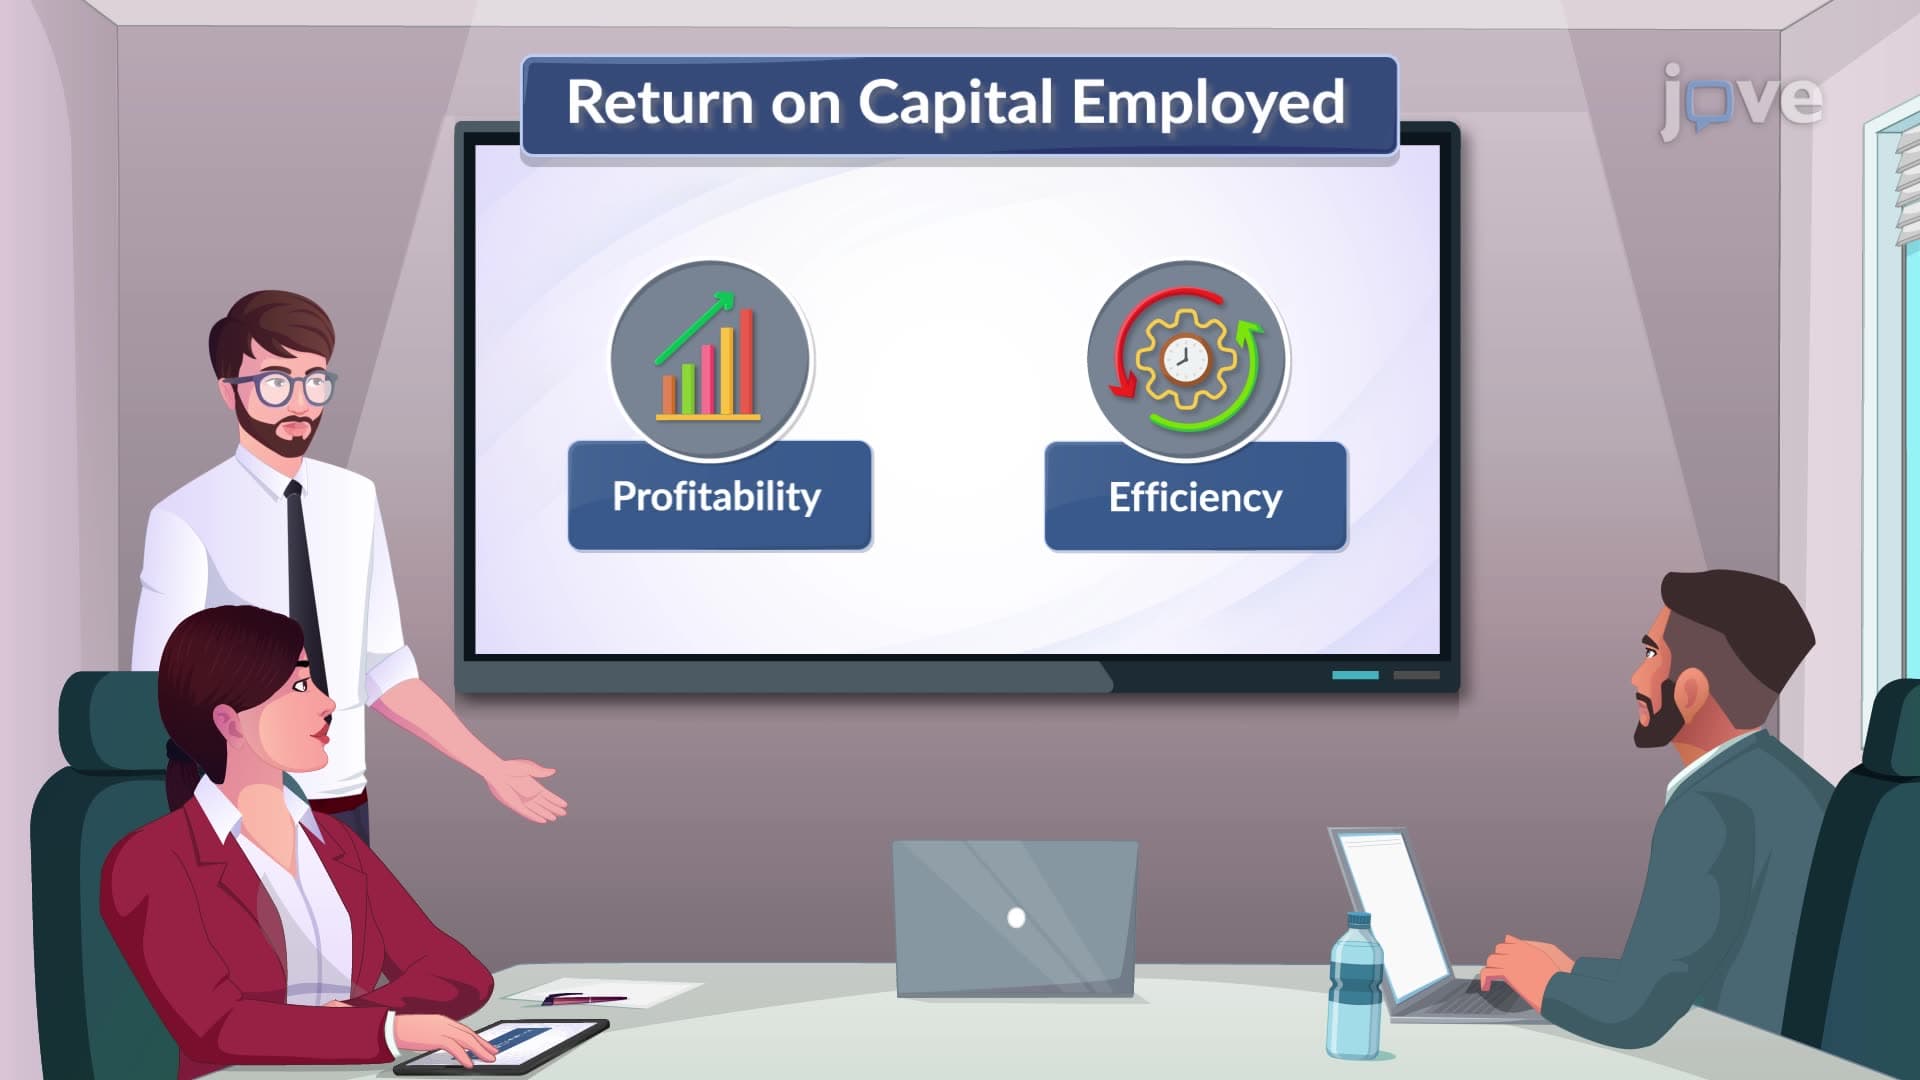
In today's capital-constrained business environment, executives face mounting pressure to demonstrate efficient resource allocation. Return On Capital Employed (ROCE) serves as a critical profitability ratio that measures management's ability to generate earnings from every dollar of invested capital. Unlike basic profit margins, ROCE captures the full cost of capital deployment, making it indispensable for strategic decision-making.
The formula is elegantly simple: ROCE = Earnings Before Interest and Taxes (EBIT) ÷ Total Capital Employed. However, its strategic implications run deep. When Amazon reports ROCE figures, analysts immediately assess whether the company's massive capital investments in fulfillment centers and technology infrastructure generate adequate returns compared to capital-light competitors like eBay.
Capital Efficiency as Competitive Advantage
Companies demonstrating superior ROCE consistently outperform peers in market valuations and attract premium investor interest. Microsoft's transformation under Satya Nadella exemplifies this principle-shifting from capital-intensive hardware ventures to high-ROCE cloud services dramatically improved the company's capital efficiency metrics.
Professional investors use ROCE to identify management teams capable of prudent capital stewardship. Private equity firms particularly favor targets with improving ROCE trends, recognizing operational leverage opportunities. When evaluating portfolio companies, seasoned executives analyze ROCE decomposition to pinpoint specific areas where capital deployment requires optimization.
Industry-Specific ROCE Considerations
ROCE interpretation varies significantly across industries due to different capital intensity requirements. Technology companies like Google typically achieve higher ROCE percentages than capital-heavy manufacturers like General Motors. Smart professionals benchmark ROCE within industry cohorts rather than making cross-sector comparisons.
Retail executives monitor ROCE seasonality, understanding that Q4 capital deployment for holiday inventory must generate sufficient returns to justify the investment. Manufacturing leaders track ROCE impact from automation investments, balancing short-term capital outlays against long-term efficiency gains.
Strategic Applications in Corporate Finance
During merger and acquisition evaluations, investment bankers scrutinize target companies' ROCE sustainability. Declining ROCE trends often signal underlying operational challenges that may require post-acquisition restructuring. Conversely, companies maintaining stable ROCE despite industry headwinds demonstrate resilient business models worthy of premium valuations.
Corporate development teams use ROCE analysis to prioritize capital allocation between organic growth initiatives and external acquisitions, ensuring optimal shareholder value creation.
Frequently Asked Questions
Return On Capital Employed measures how effectively a company generates profits from its invested capital, calculated as EBIT divided by total capital employed. It matters because it reveals management's ability to create shareholder value and guides critical decisions about resource allocation, acquisition targets, and operational efficiency improvements.
Use ROCE to benchmark your company's capital efficiency against competitors, identify underperforming business units requiring attention, and evaluate proposed capital investments. Present ROCE trends over time to demonstrate operational improvements and justify resource allocation decisions to stakeholders and board members.
Frame ROCE as a measure of management effectiveness and competitive positioning. Show how improving ROCE drives higher valuations, attracts better financing terms, and creates sustainable competitive advantages. Use industry benchmarks to demonstrate where your company stands relative to best-in-class performers.
When Warren Buffett's Berkshire Hathaway evaluates acquisition targets, ROCE analysis heavily influences decisions. The company famously passed on technology investments during the dot-com era partly due to uncertain ROCE prospects, later investing heavily in Apple only after the company demonstrated consistent, superior capital efficiency compared to hardware peers.
ROCE provides objective criteria for prioritizing competing capital requests. Projects promising higher ROCE returns receive priority, while initiatives showing declining capital efficiency face scrutiny. Use ROCE projections to model different scenarios and demonstrate expected returns to finance committees and executive leadership.
While helpful, advanced finance training isn't required. ROCE's straightforward calculation makes it accessible to managers across functions. Focus on understanding the business implications rather than complex technical details-most successful applications involve asking the right strategic questions rather than performing sophisticated calculations.
Proficiency in ROCE analysis demonstrates strategic thinking capabilities highly valued in senior roles. It shows you understand value creation, can evaluate business performance objectively, and make data-driven decisions about resource allocation-skills essential for advancement into executive positions and board-level discussions.
Consider studying Return on Invested Capital (ROIC) and Economic Value Added (EVA) as complementary metrics. These concepts build upon ROCE foundations and provide additional frameworks for evaluating management performance and strategic decision-making in capital-intensive environments.
Related Micro-courses