Loading video…

 8 Concepts
 399 views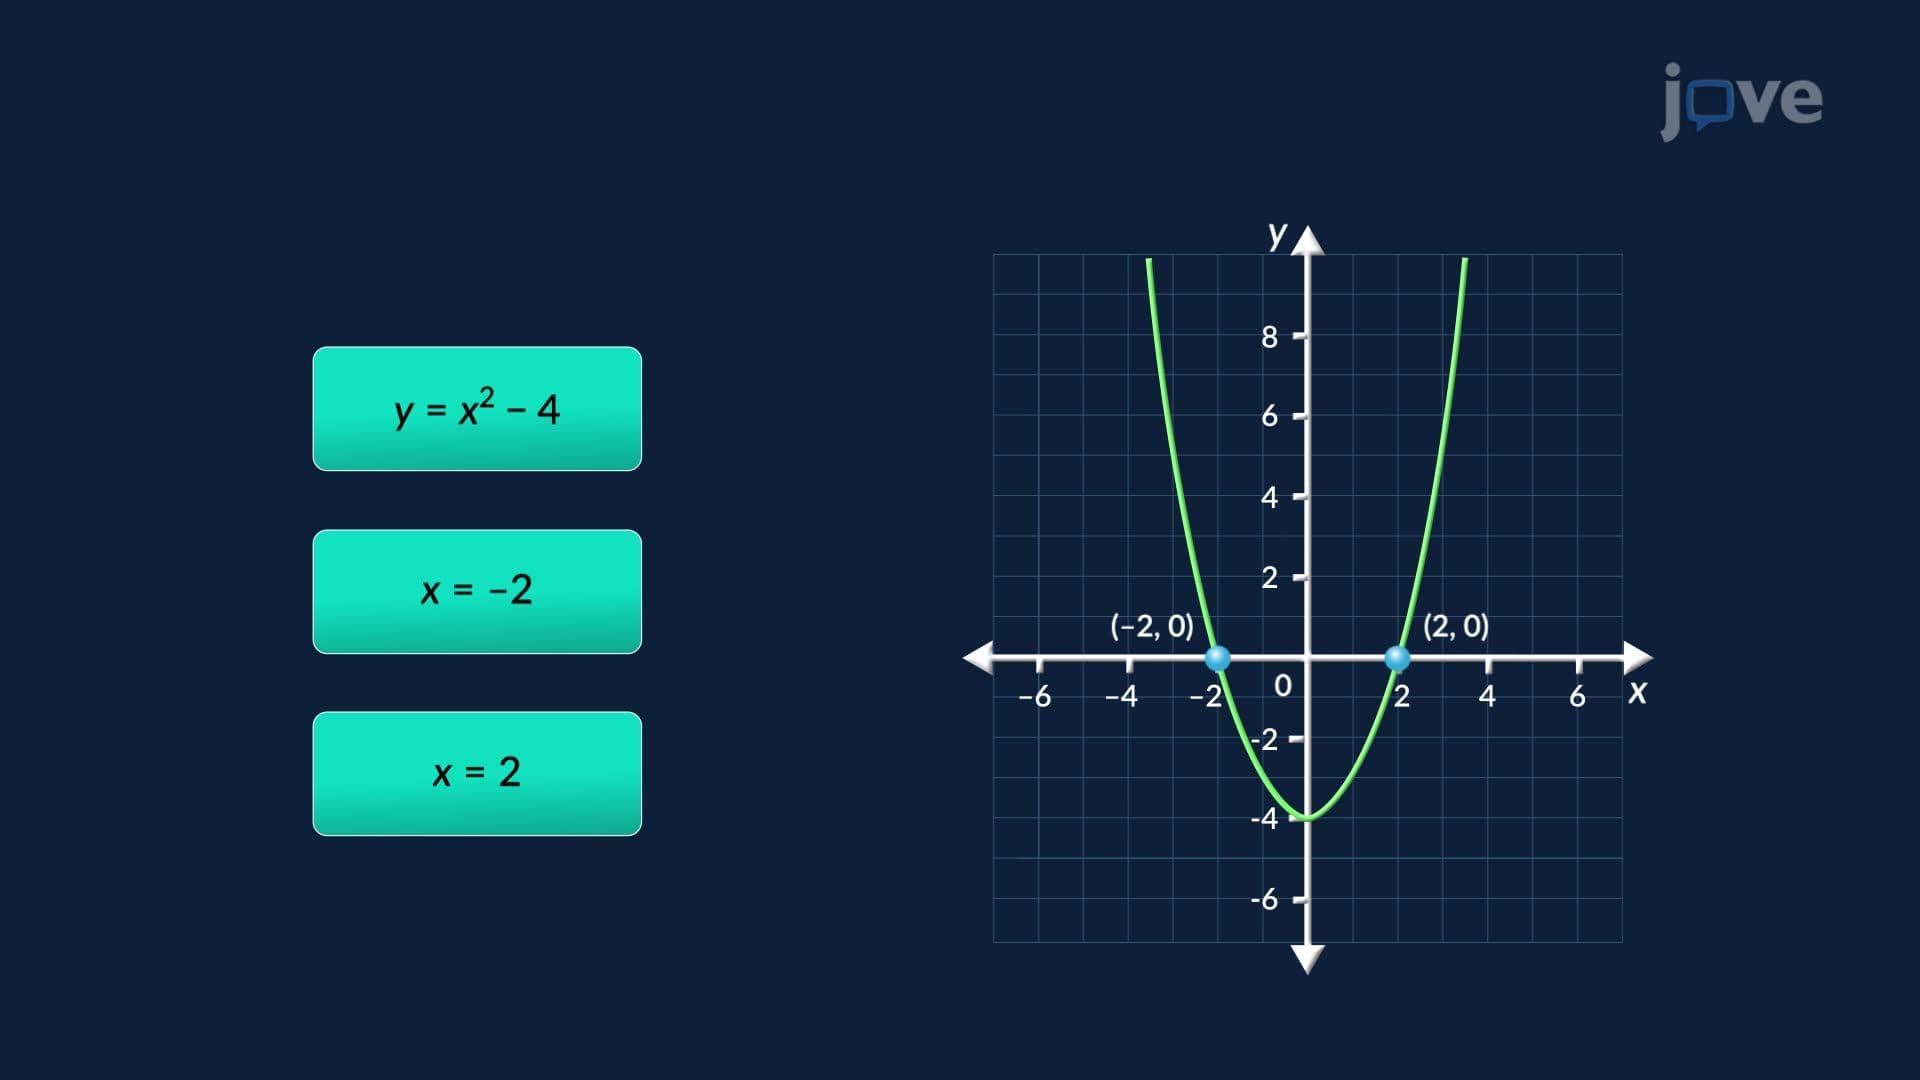

Video Summary: What Is Solving Equations Graphically
Did you know that Netflix uses graphical equation solving to determine their break-even point for new show investments? Solving equations graphically transforms abstract mathematical relationships into visual representations by plotting coordinate points and identifying where graphs intersect axes or other curves. This powerful method helps students tackle everything from basic linear equations to complex quadratic systems, making it essential for understanding business applications like finding when a startup's revenue finally matches its costs. What is Solving Equations Graphically becomes clearer when you see how Fortune 500 companies use these visual techniques daily for financial planning and market analysis. Watch the full video on JoVE Coach to master this concept with expert-led visuals and step-by-step explanations.
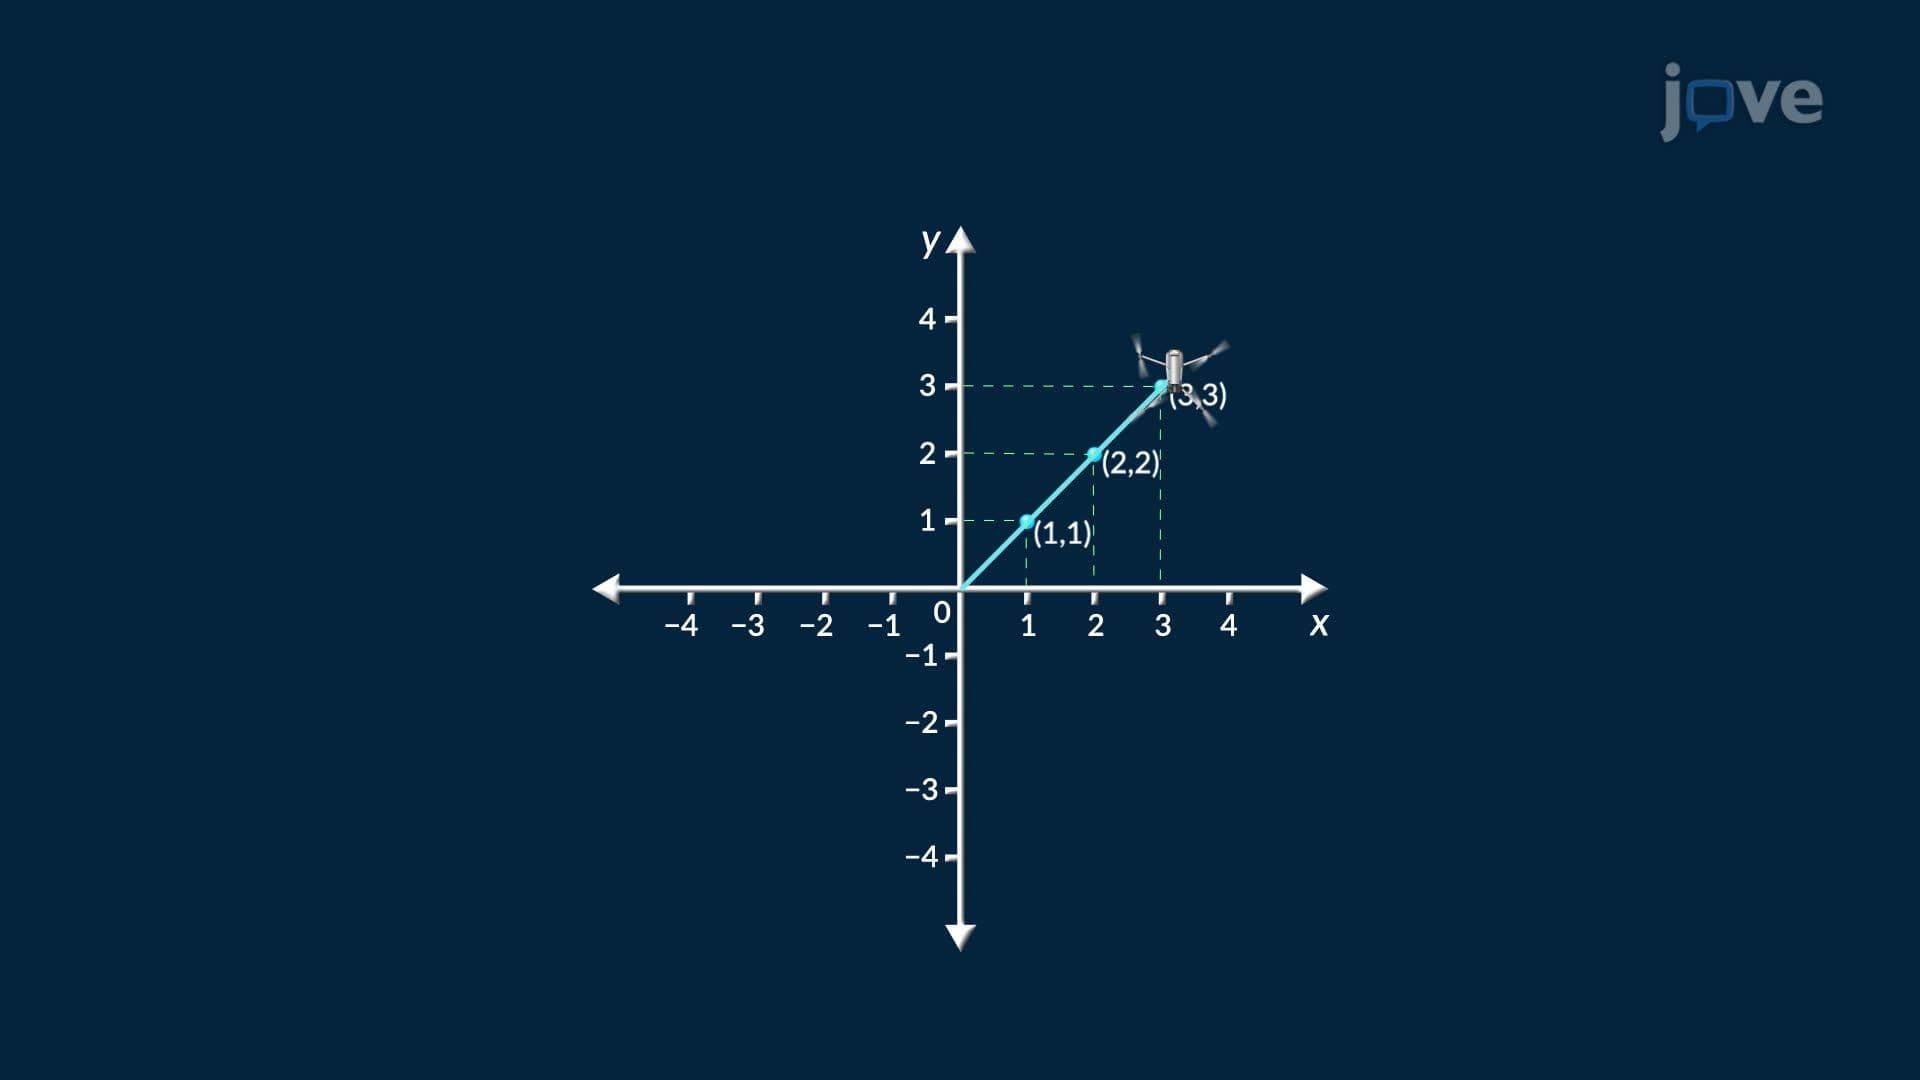
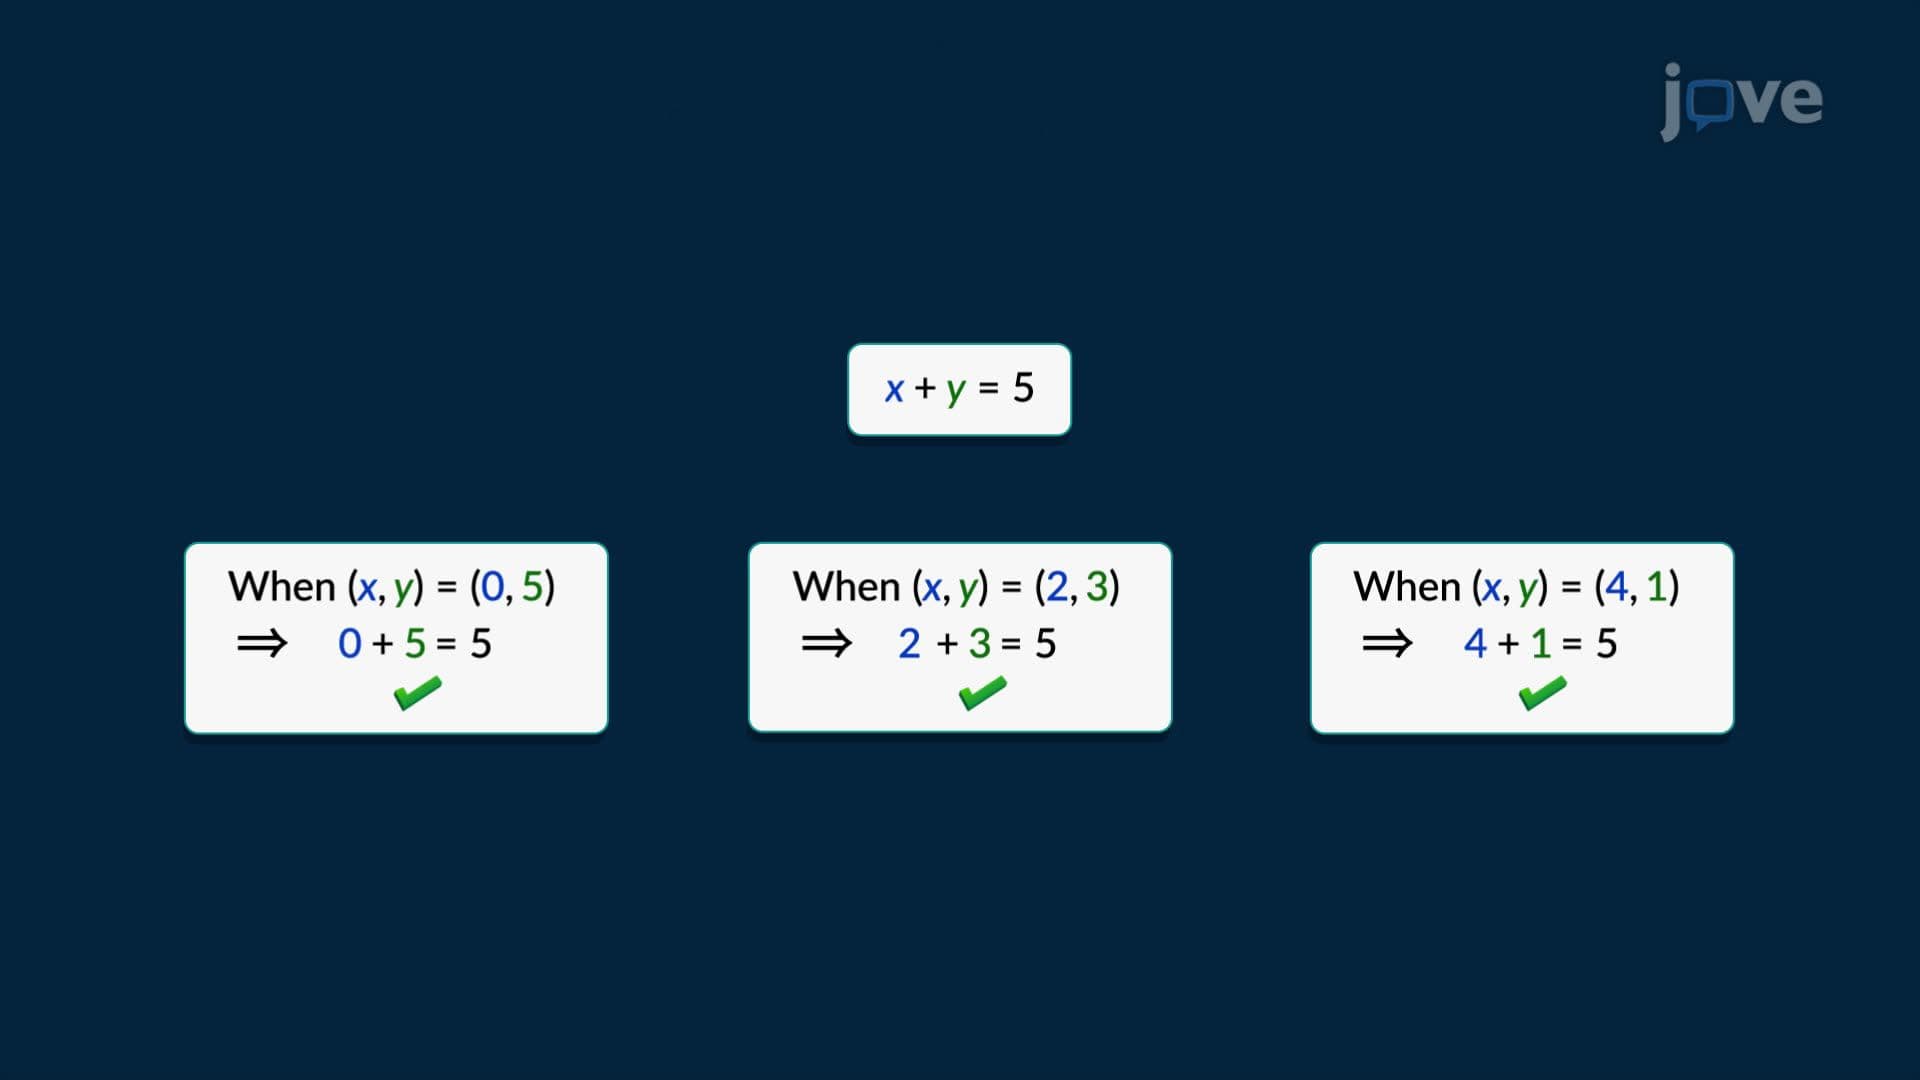
Solving equations graphically represents a visual approach to finding mathematical solutions by converting algebraic expressions into coordinate plane representations. This method involves systematically selecting x-values, computing their corresponding y-values using the given equation, and plotting these coordinate pairs to create a visual graph. The power of this approach lies in transforming abstract numerical relationships into concrete visual patterns that students can interpret and analyze.
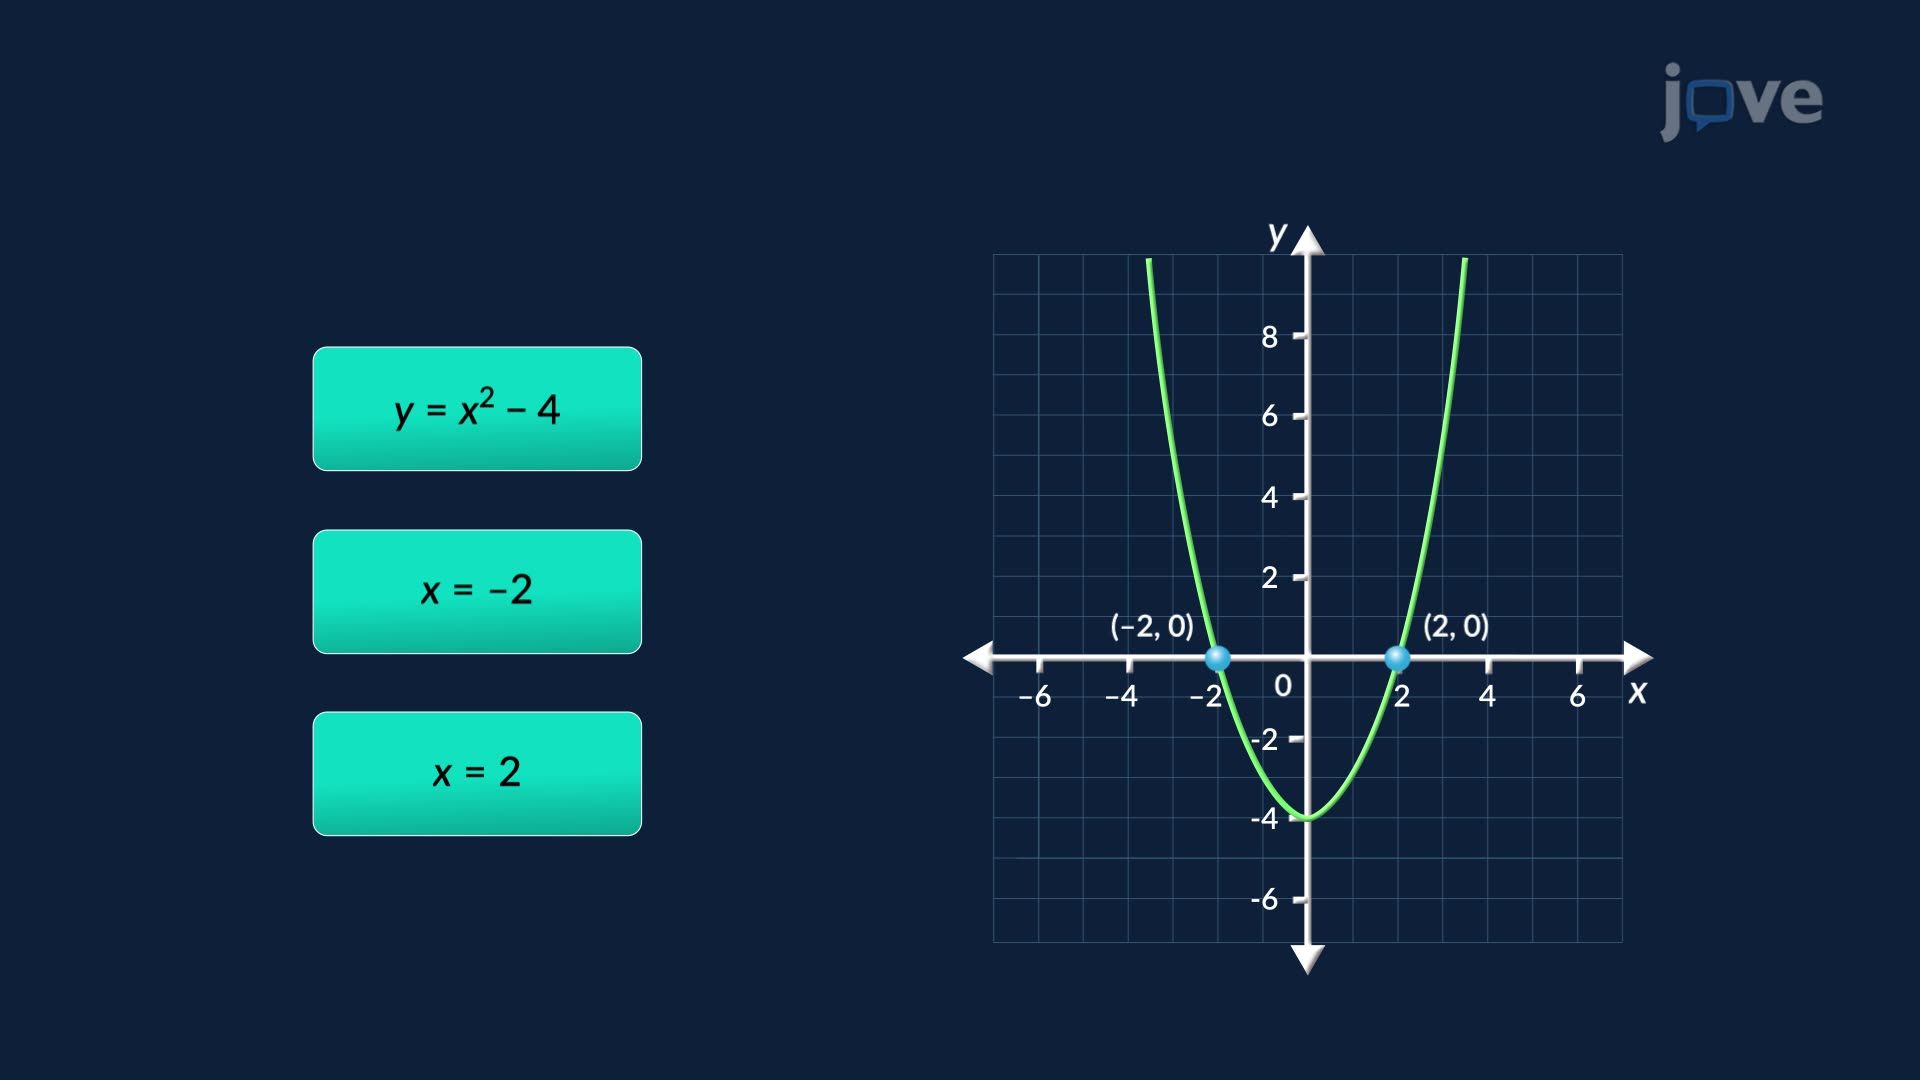
The fundamental principle centers on identifying x-intercepts-points where the graph crosses the x-axis. At these critical locations, the y-value equals zero, making the x-coordinate a solution to the original equation. This visual identification process often proves more intuitive than purely algebraic manipulation, especially for students preparing for standardized tests like the SAT Math section or AP Calculus exams.
Quadratic equations benefit tremendously from graphical analysis because their parabolic shapes immediately reveal solution characteristics. When a parabola intersects the x-axis at two distinct points, the quadratic equation has two real solutions. A parabola that touches the x-axis at exactly one point (vertex touching) indicates one repeated real solution, while a parabola that never touches the x-axis signals no real solutions exist.
This visual approach proves invaluable for college algebra courses and AP Mathematics preparation. Students can quickly verify their quadratic formula calculations by examining whether their computed solutions align with the graph's x-intercepts. Major universities like MIT and Stanford emphasize this dual approach-algebraic precision combined with graphical verification-in their introductory calculus sequences.
Graphical solving extends powerfully to systems of equations, where multiple relationships must be satisfied simultaneously. By plotting each equation on the same coordinate plane, intersection points reveal values that satisfy all equations in the system. This technique proves especially valuable for linear systems commonly featured in college entrance exams and business mathematics courses.
The intersection method helps students visualize why some systems have unique solutions (lines intersecting at one point), infinite solutions (identical lines), or no solutions (parallel lines). Universities across the United States, from UC Berkeley to Harvard, utilize this graphical foundation before advancing to matrix methods and advanced algebraic techniques.
Business applications demonstrate the practical power of graphical equation solving, particularly in break-even analysis. Companies plot total cost functions (fixed costs plus variable costs per unit) against total revenue functions (price per unit times quantity sold). The intersection point identifies the precise production level where revenue equals cost-the break-even point crucial for business planning.
Major corporations like Apple and Google regularly employ these graphical techniques for financial modeling, market analysis, and strategic planning. Students pursuing business degrees or preparing for GMAT examinations benefit from understanding these applications, as they frequently appear in quantitative reasoning sections and case study analyses.
Related Micro-courses