Loading concepts…


14 Concepts
8 Concepts
14 Concepts
10 Concepts
8 Concepts
5 Concepts
12 Concepts
4 Concepts
8 Concepts
7 Concepts
15 Concepts
 8 Concepts
 399 Views
 Popular topics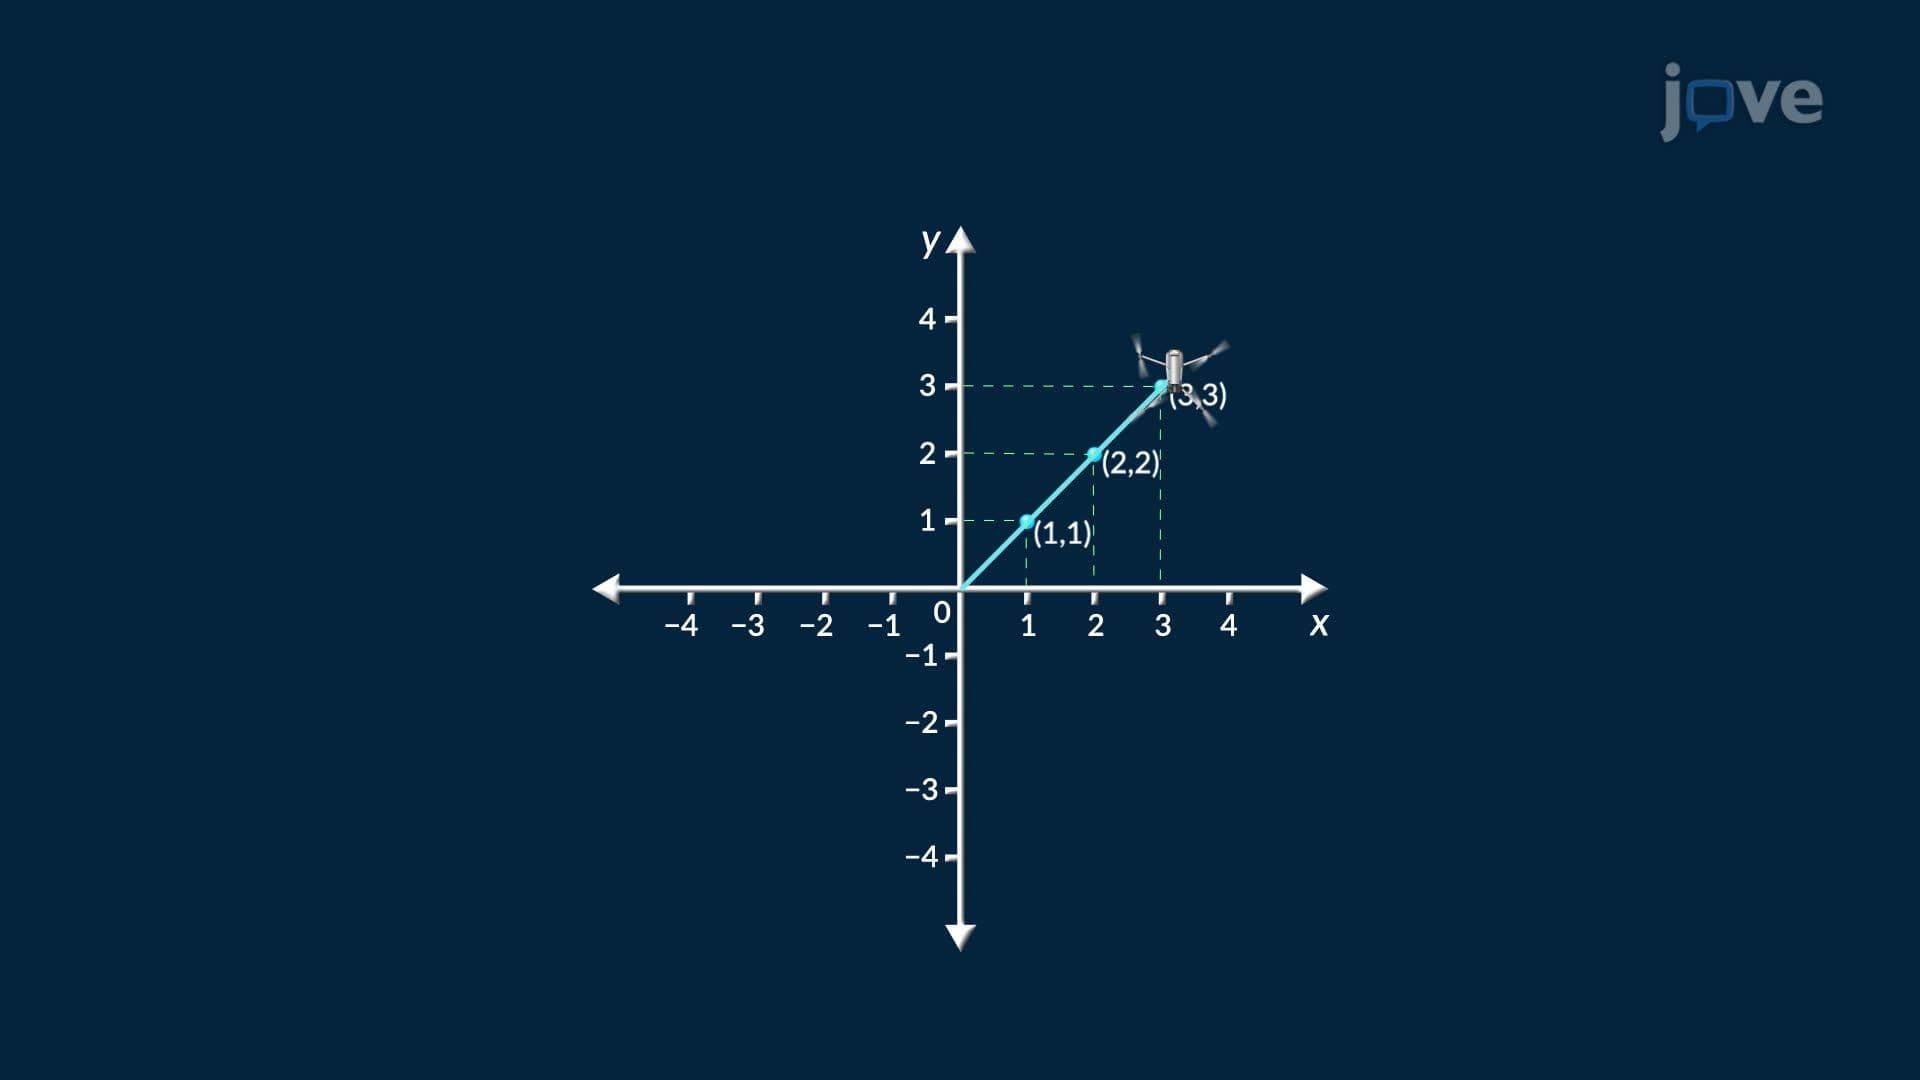


Coordinates and graphs form the foundation of mathematical visualization and analytical problem-solving. This JoVE Coach micro-course explores coordinate plane graphing, from basic Cartesian coordinates to advanced applications in graphing equations and inequalities. Students will master essential skills including the distance and midpoint formulas, plotting points in coordinate systems, and solving real-world problems using coordinate geometry principles applied in fields like telecommunications, business analytics, and navigation systems.
1. Coordinate Plane Fundamentals The coordinate plane consists of perpendicular x and y axes intersecting at the origin, creating four distinct quadrants. Every point has unique coordinates (x,y) that function like a GPS address system. Positive x-values appear right of the y-axis, while negative values appear left. Similarly, positive y-values lie above the x-axis. This system enables precise location identification in applications ranging from mapping drone flight paths to plotting economic data trends. Understanding quadrant placement helps students navigate complex graphing problems and interpret real-world coordinate applications effectively.
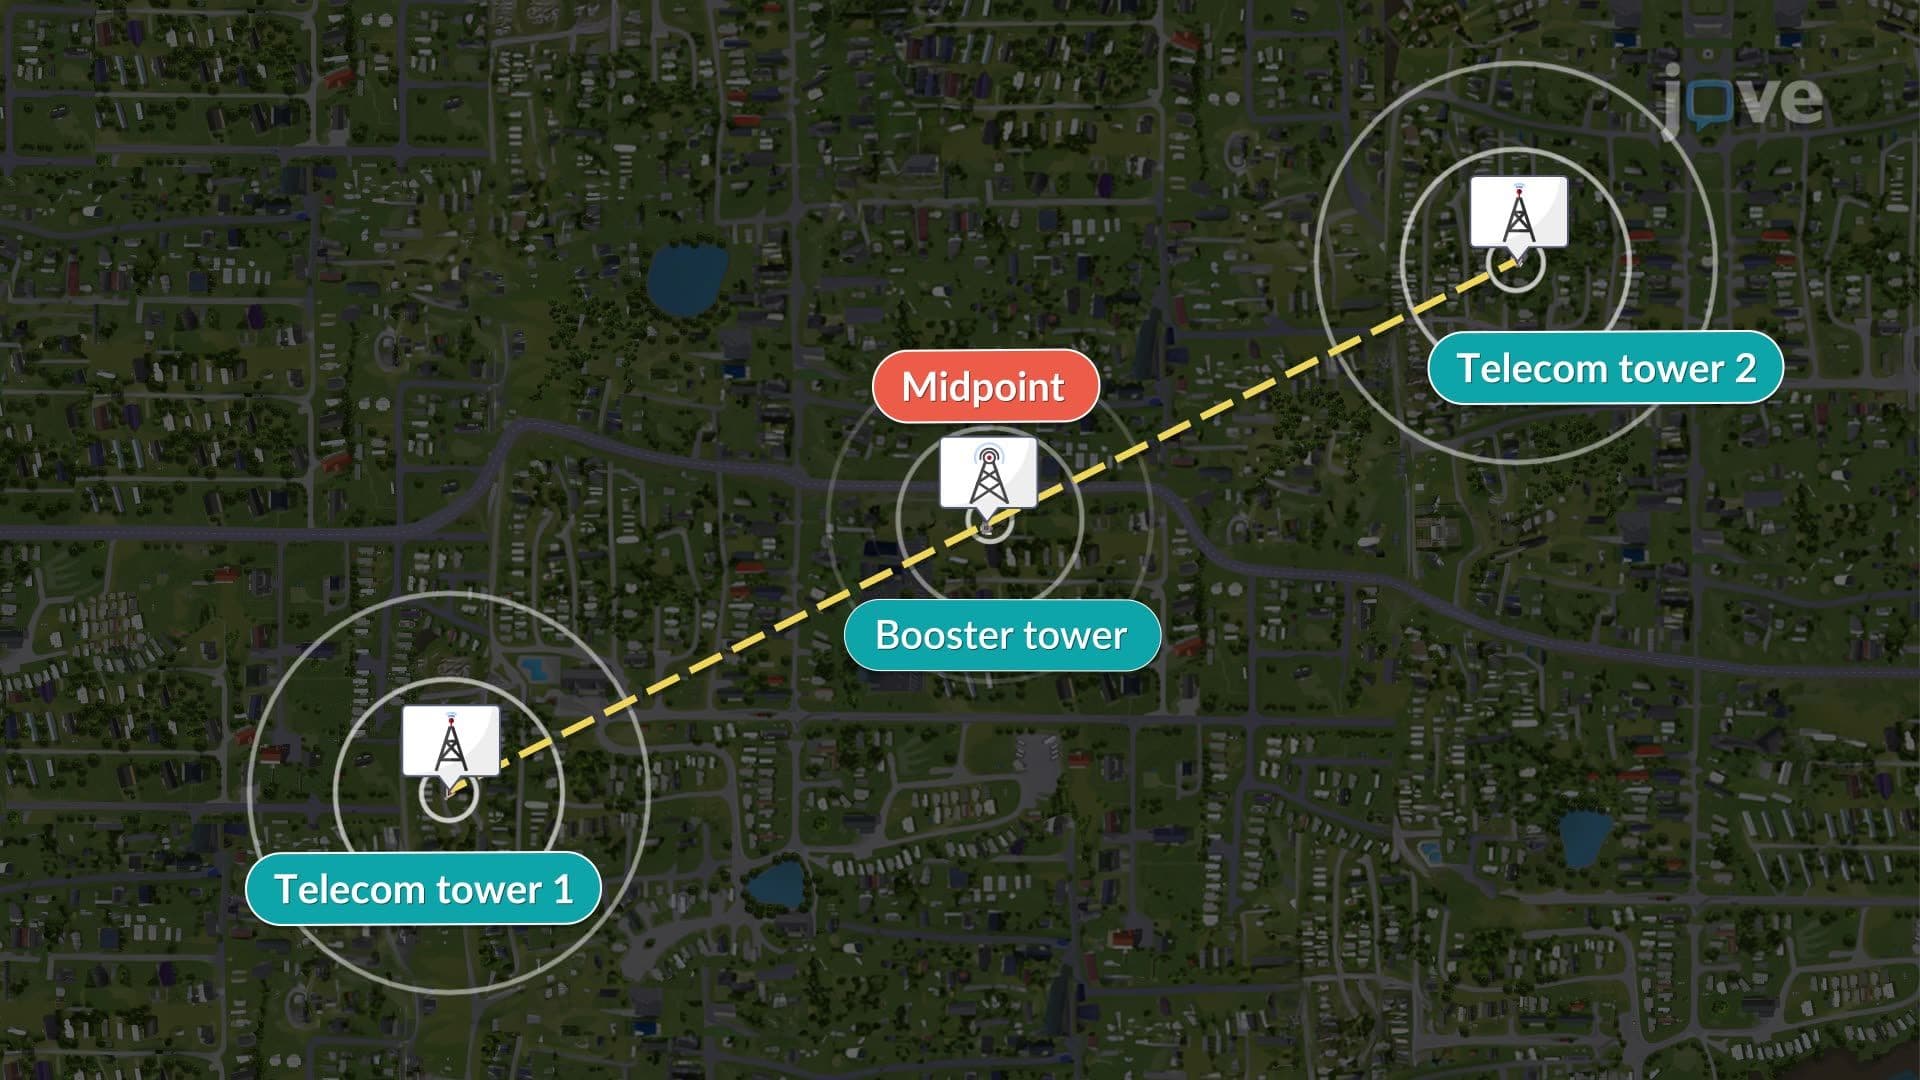
2. Distance and Midpoint Calculations The distance formula, derived from the Pythagorean theorem, calculates straight-line distances between coordinate points by finding the hypotenuse of right triangles formed by horizontal and vertical differences. The midpoint formula determines exact center points by averaging x and y coordinates separately. These calculations prove essential in telecommunications for optimal cell tower placement, in urban planning for equidistant facility locations, and in logistics for efficient distribution center positioning. Mastering these formulas enables students to solve practical geometry problems and understand spatial relationships in coordinate systems.
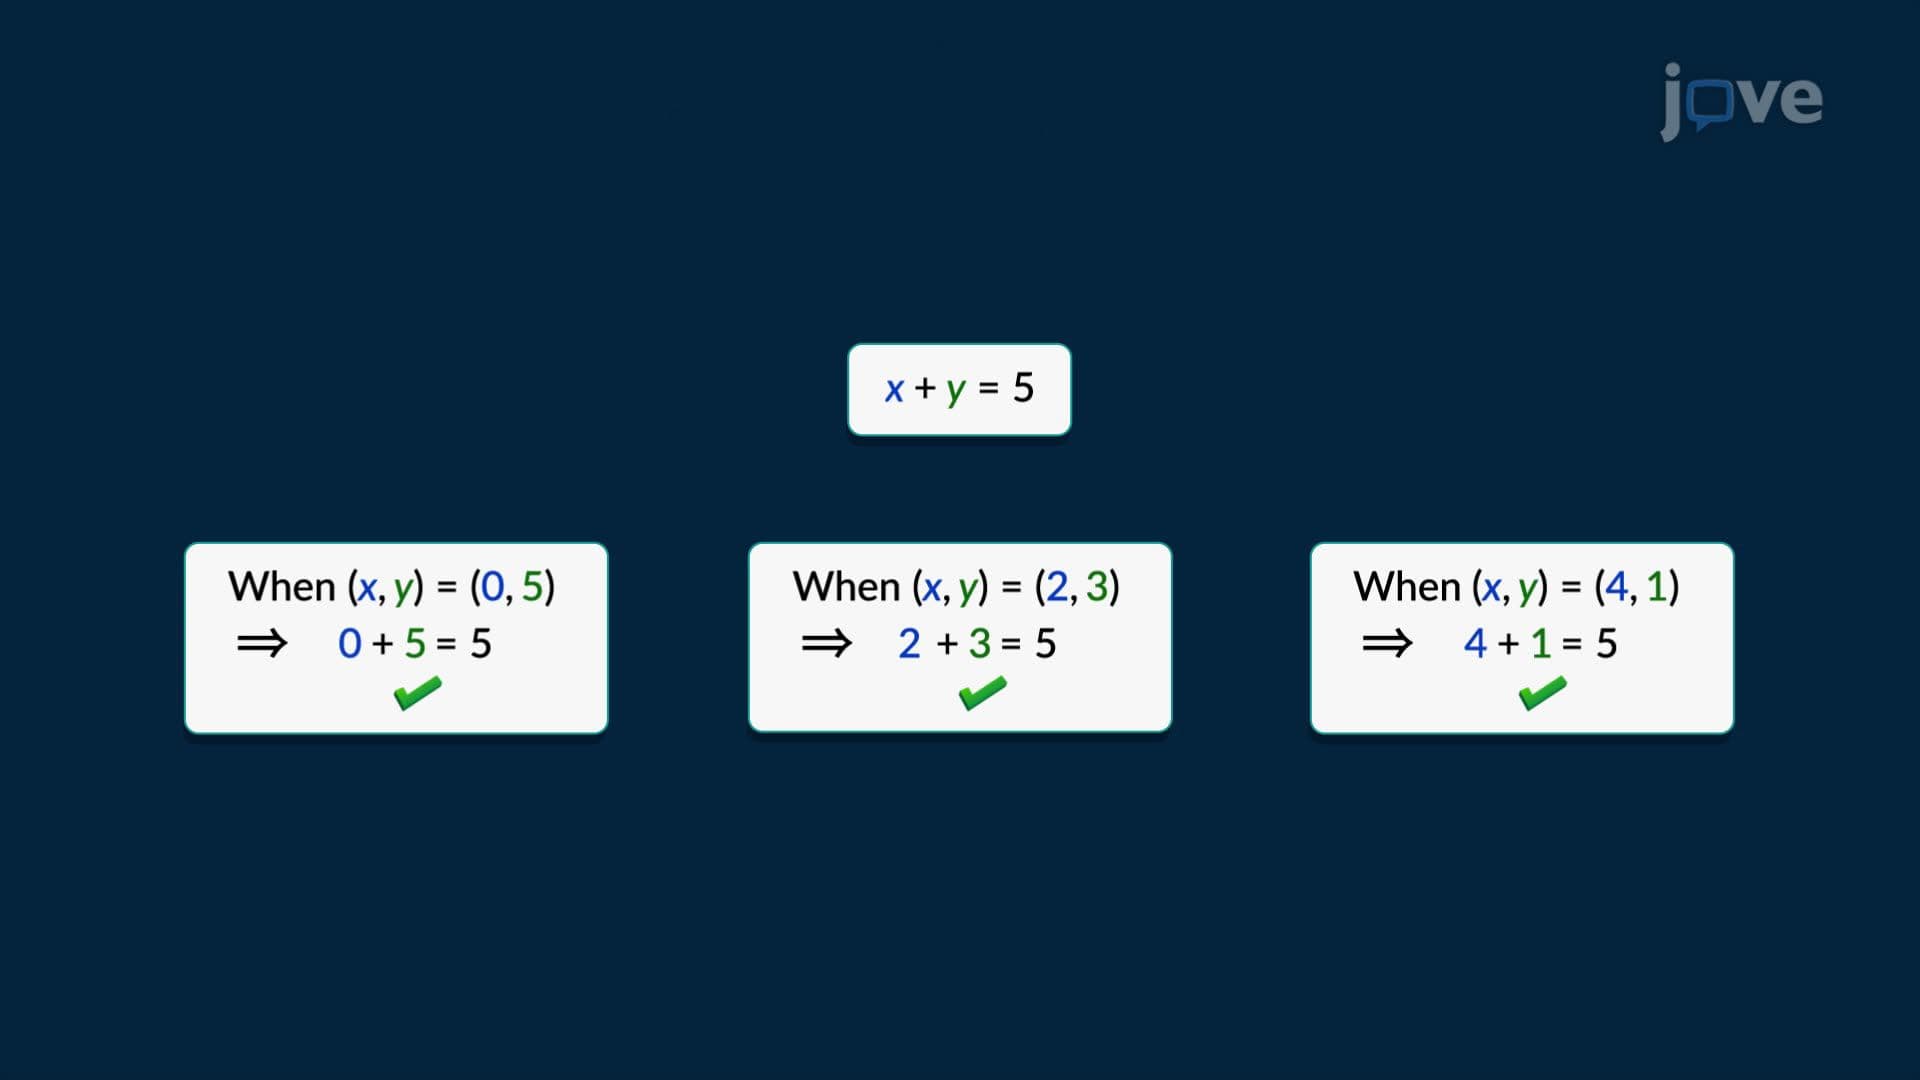
3. Graphing Equations and Functions Graphing equations involves selecting x-values, calculating corresponding y-values, and plotting ordered pairs to reveal visual patterns. Intercepts mark where graphs cross axes, providing crucial reference points for analysis. Linear equations create straight lines, while quadratic equations form parabolas. This visualization technique helps analyze business data like tracking movie ticket sales over time, where daily sales patterns emerge clearly through coordinate plotting. Understanding graphing fundamentals enables students to interpret mathematical relationships visually and make predictions based on observed trends and patterns.
4. Circles and Geometric Shapes Circle equations derive from the distance formula, representing all points equidistant from a center point. The standard form reveals center coordinates and radius length directly. Completing the square transforms non-standard equations into recognizable formats. These concepts apply to designing circular sports facilities, determining broadcast coverage areas, and modeling planetary orbits. Students learn to convert between algebraic equations and geometric representations, developing skills essential for advanced mathematics and real-world applications requiring circular or elliptical modeling in engineering and design projects.
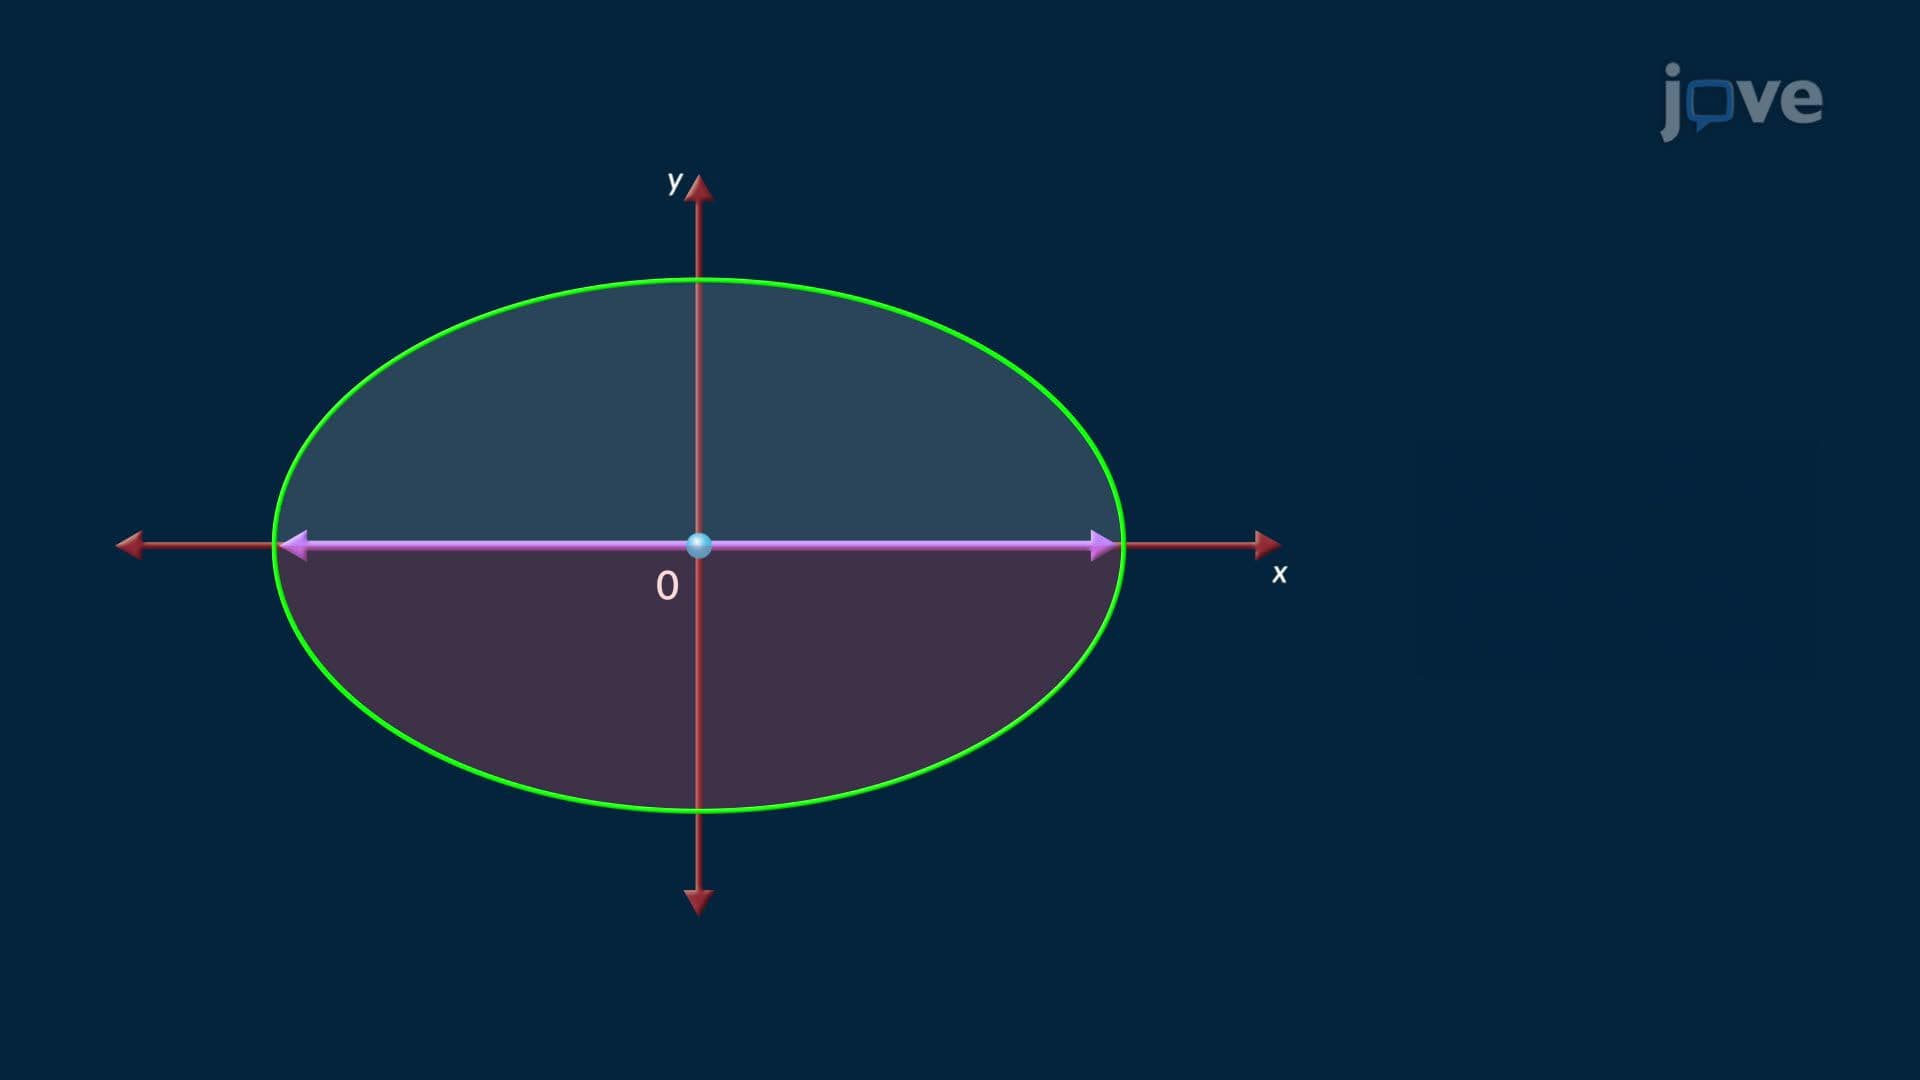
5. Symmetry and Pattern Recognition Graphs exhibit three symmetry types: reflection across x-axis, y-axis, or rotation about the origin. Testing symmetry involves substituting negative values and observing equation behavior. Symmetric patterns appear in architectural designs, manufacturing specifications, and natural phenomena modeling. Recognition of symmetry simplifies graphing complex functions and helps predict curve behavior. Students develop visual analysis skills that transfer to physics applications, engineering design problems, and artistic applications where symmetric properties create aesthetic appeal and functional efficiency in coordinate-based design systems.
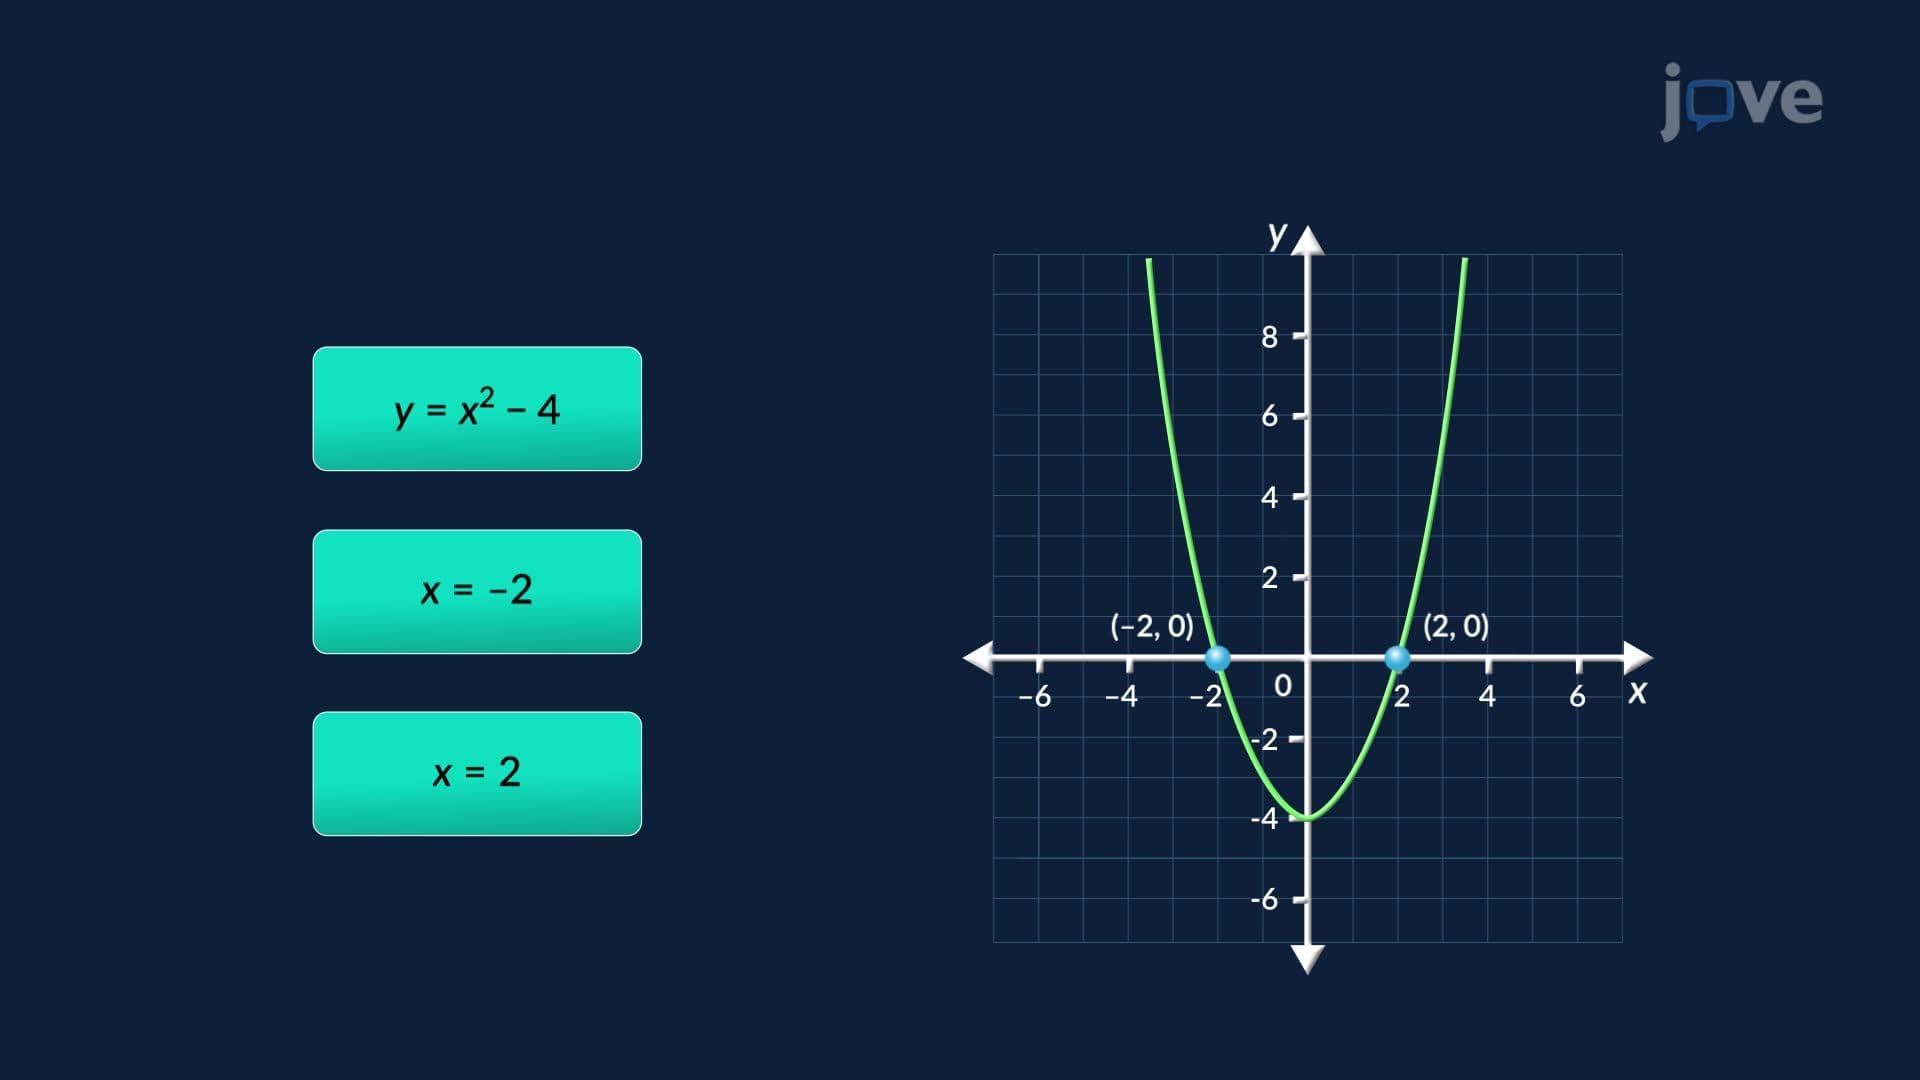
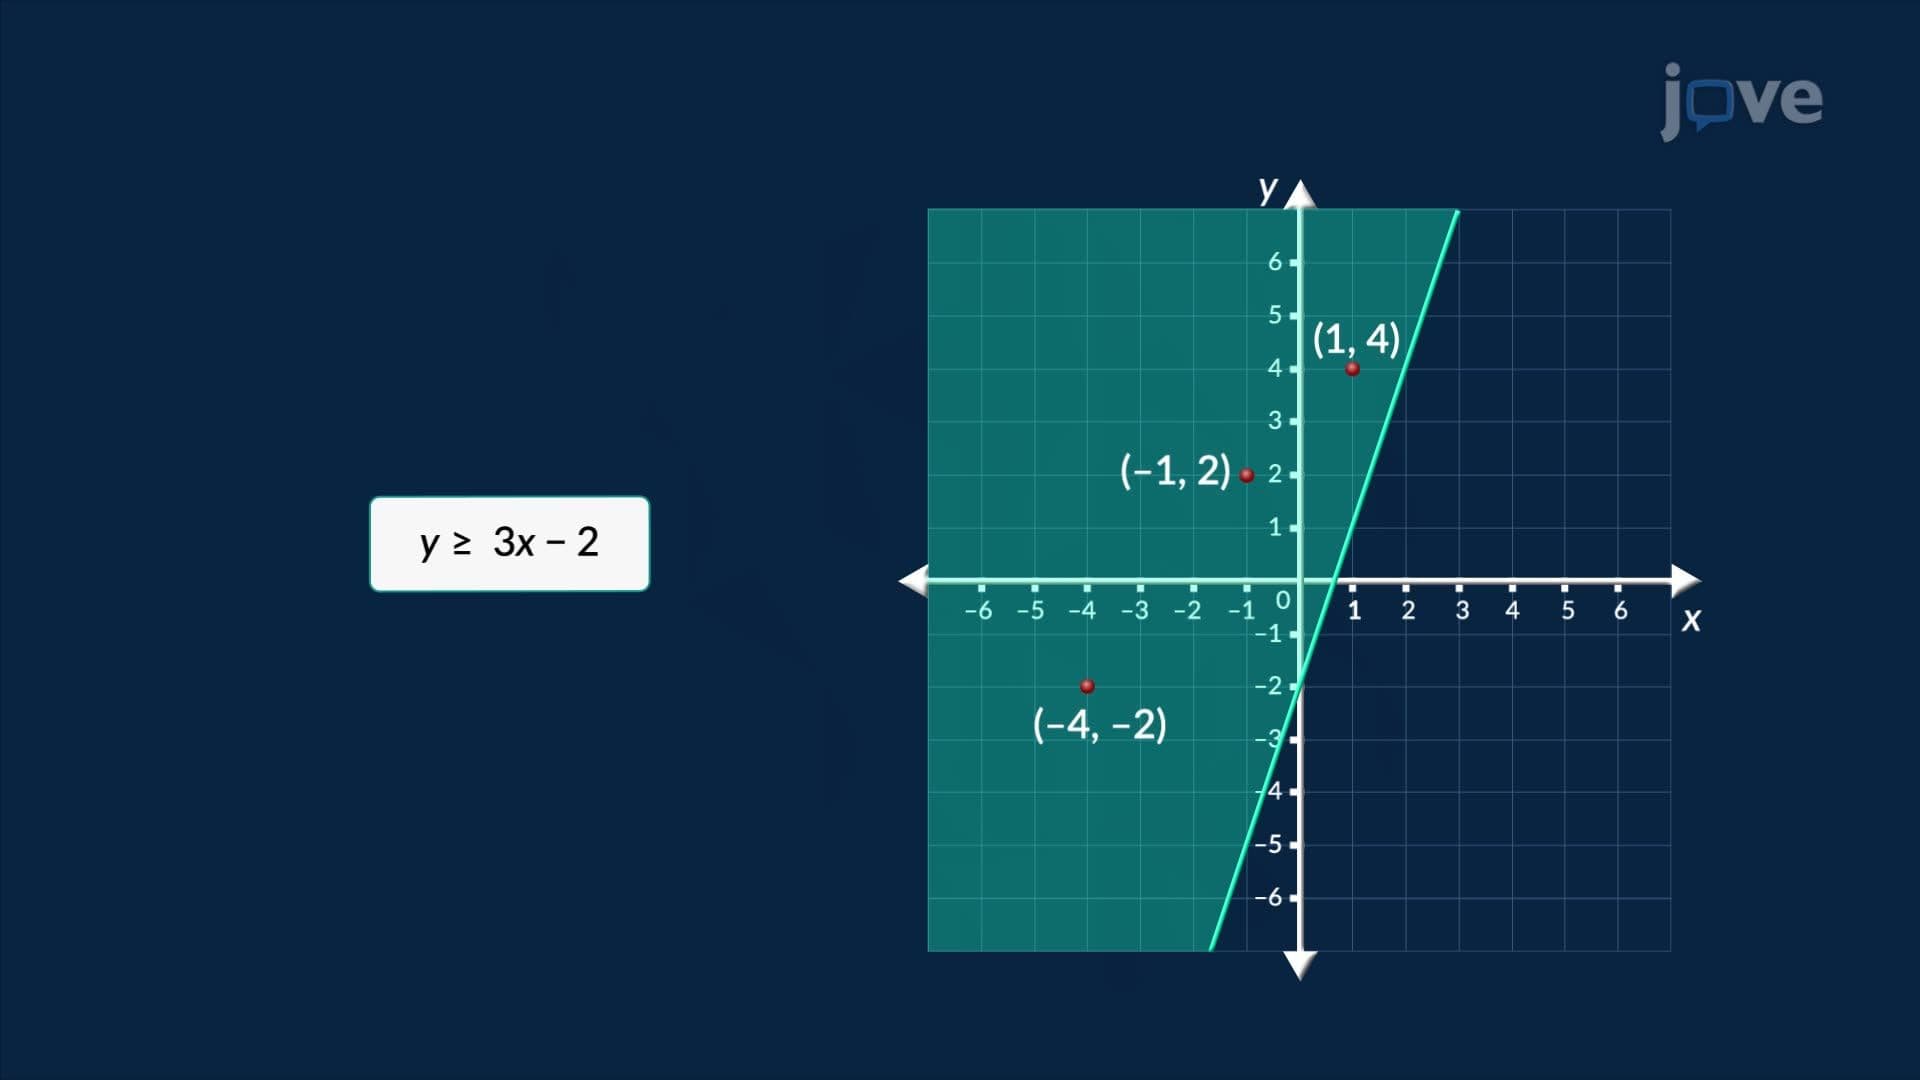
6. Solving Equations and Inequalities Graphically Graphical equation solving identifies x-intercepts where functions equal zero, while systems solutions occur at intersection points. Quadratic equations may have zero, one, or two real solutions based on x-axis interaction patterns. Inequality solutions appear as shaded regions representing value ranges satisfying given conditions. Business applications include finding break-even points where revenue equals costs, and budget analysis comparing expenses against allocated funds. These visual problem-solving techniques help students understand solution sets intuitively and apply mathematical reasoning to practical decision-making scenarios.