Loading subject page…

- Finance
- Financial Ratio Analysis
- Profitability Ratios: Gross Profit Ratio
Micro-course: Financial Ratio Analysis
5,239 views
Learn key concepts and earn your certificate.








Profitability Ratios: Gross Profit Ratio

00:00
01:26
Video Summary: Profitability Ratios Gross Profit Ratio Explained
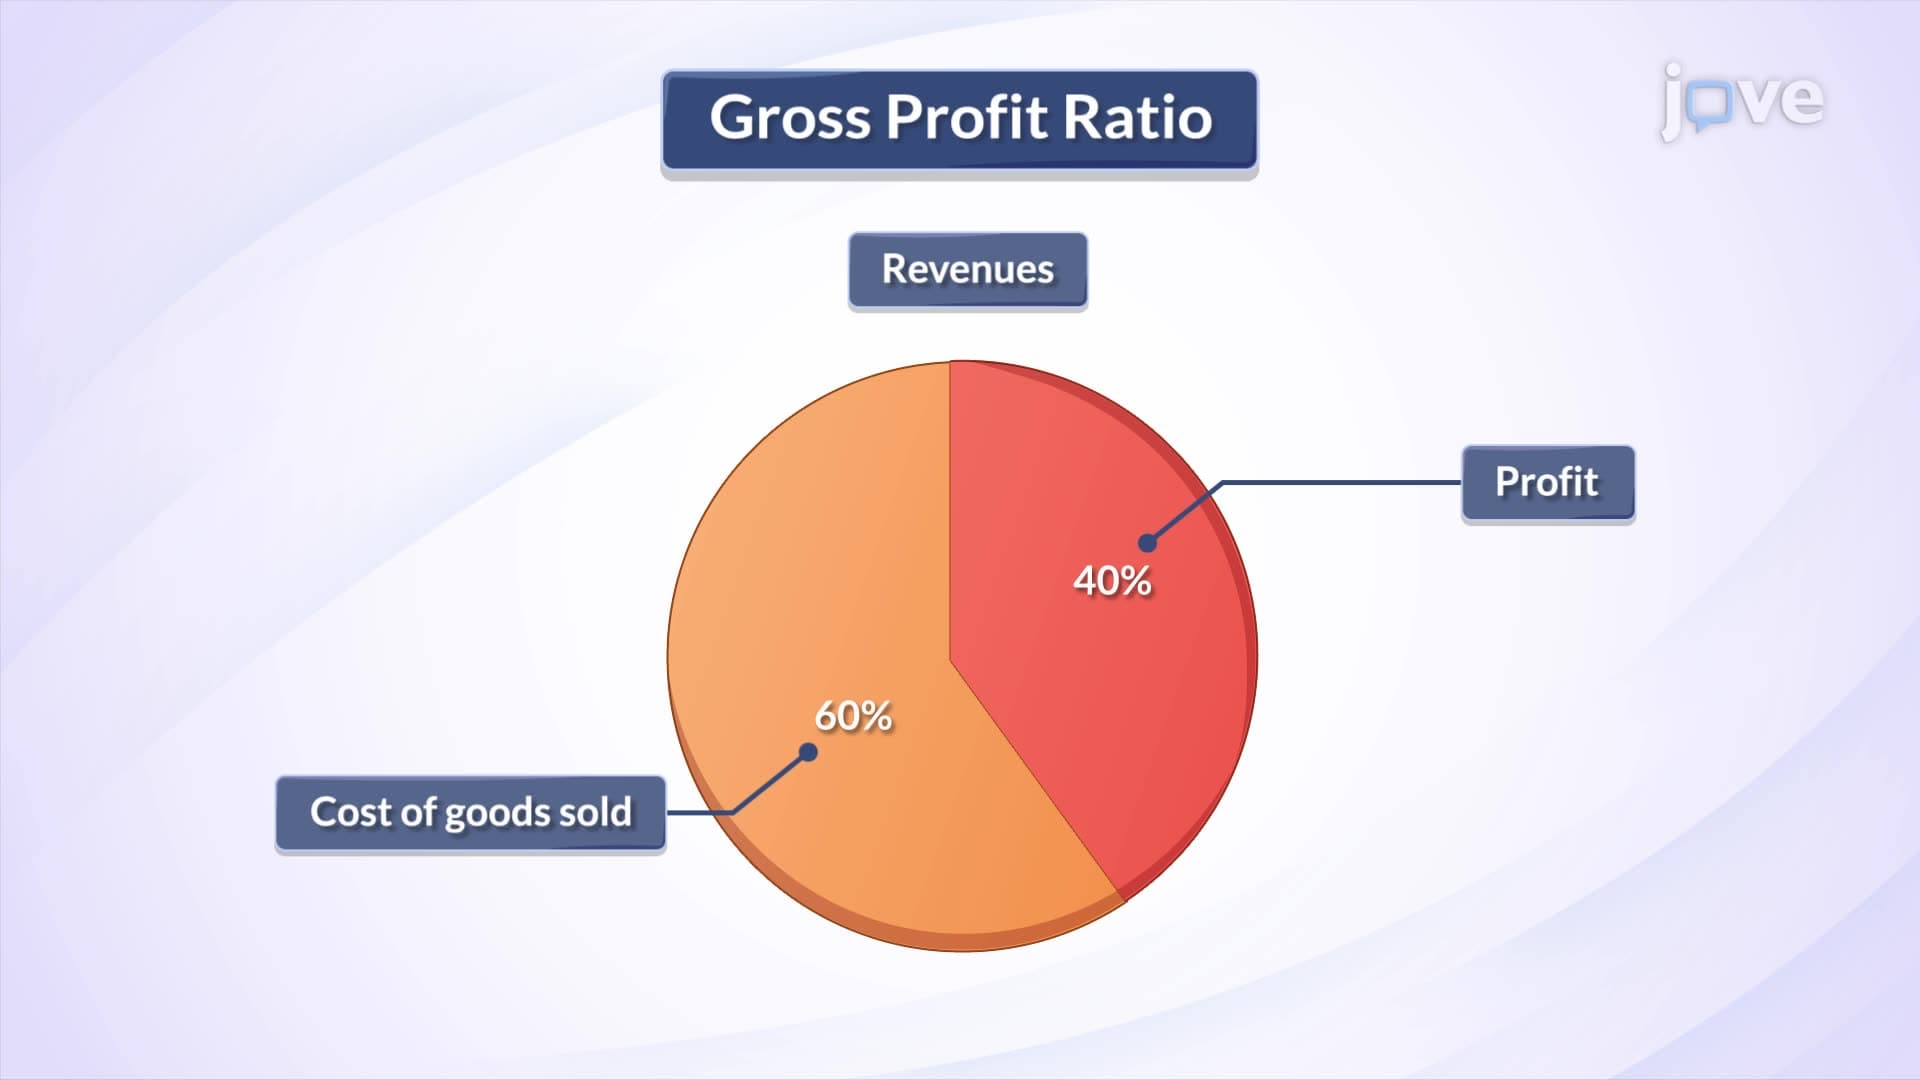
When Walmart reports quarterly earnings, analysts immediately scrutinize its gross profit margins to assess operational efficiency amid rising supply chain costs. Profitability ratios gross profit analysis reveals how effectively companies convert revenue into profit before operational expenses. This critical metric helps executives like those at Target evaluate pricing strategies and cost management effectiveness when competing against Amazon's aggressive pricing. The Profitability Ratios Gross Profit Ratio Explained framework provides the foundation for strategic decision-making in retail, manufacturing, and service industries. Watch the full video on JoVE Coach to master this concept with expert-led visuals and step-by-step explanations.
- Apply gross profit ratio analysis to evaluate supplier negotiations and pricing power in competitive markets
- Assess operational efficiency by comparing gross margins across industry peers and identifying cost optimization opportunities
- Analyze quarterly earnings reports to identify trends in production cost management and revenue quality
- Implement margin improvement strategies by understanding the relationship between COGS and revenue generation
- Evaluate acquisition targets by examining their gross profit sustainability and operational leverage potential
- Compare cross-functional department performance using gross margin metrics for budget allocation decisions
- Identify early warning signals of competitive pressure through declining gross profit ratio trends
- Leverage gross margin analysis for strategic planning sessions and board-level financial discussions
Understanding Profitability Ratios Gross Profit Ratio in Strategic Context
Modern executives face intense pressure to optimize operational performance while maintaining competitive positioning. The gross profit ratio serves as a fundamental diagnostic tool, revealing how effectively management converts sales revenue into profit before accounting for overhead expenses. Unlike net profit margins, which include all operational costs, gross profit ratios isolate the core efficiency of a company's primary value-creation activities.
Competitive Intelligence Through Margin Analysis
Industry leaders like Apple consistently maintain gross margins above 35%, reflecting their premium positioning and supply chain mastery. In contrast, traditional retailers like Costco operate on razor-thin gross margins around 13%, compensating through membership fees and inventory velocity. These differences reveal strategic positioning: Apple prioritizes innovation and brand premium, while Costco focuses on volume efficiency and customer loyalty.
Smart executives use competitor gross margin analysis to benchmark operational performance and identify strategic vulnerabilities. When a competitor's gross margins suddenly decline, it often signals pricing pressure, rising input costs, or operational inefficiencies-creating potential market opportunities.
Operational Leverage and Investment Decisions
Gross profit ratios directly impact capital allocation decisions and growth strategies. Companies with higher gross margins possess greater operational leverage, meaning revenue increases translate more effectively into profit growth. This relationship influences everything from expansion timing to acquisition valuations.
Consider Microsoft's software business model, which generates gross margins exceeding 65%. This efficiency allows Microsoft to invest heavily in R&D and strategic acquisitions while maintaining profitability. Manufacturing companies like General Motors, operating with lower gross margins around 15-20%, must carefully balance growth investments against margin preservation.
Strategic Applications for Business Leaders
Forward-thinking managers use gross profit ratio trends to anticipate market shifts and adjust strategies proactively. Rising gross margins might indicate successful cost reduction initiatives or pricing power expansion. Declining margins often signal the need for operational restructuring, supplier renegotiation, or product mix optimization.
The metric also guides resource allocation decisions. Business units with consistently higher gross margins typically deserve increased investment, while low-margin divisions require efficiency improvements or strategic repositioning. This analysis becomes particularly crucial during economic uncertainty when margin preservation determines survival.
Frequently Asked Questions
The gross profit ratio measures the percentage of revenue remaining after direct production costs, calculated as (Revenue - COGS) ÷ Revenue × 100. It's crucial because it isolates operational efficiency from overhead decisions, providing clear insight into core business performance. Unlike net margins, gross profit ratios reveal whether fundamental value creation is healthy or declining.
Compare your gross margins against previous quarters, industry benchmarks, and key competitors to identify performance trends. Use declining ratios to trigger discussions about supplier negotiations, pricing strategies, or process improvements. Rising ratios can justify expansion investments or reveal successful cost management initiatives worth replicating.
Target ratios vary significantly by industry-software companies often achieve 60-80%, while grocery retailers operate around 20-25%. Focus on maintaining or improving your ratio relative to direct competitors rather than absolute numbers. Consider your strategic positioning: premium brands can support higher ratios through value-based pricing.
Amazon's retail gross margins hover around 20-25%, but the company compensates through AWS cloud services (gross margins near 70%) and advertising revenue streams. This diversification strategy demonstrates how companies can offset low-margin core businesses with higher-margin complementary services, creating overall portfolio strength.
No extensive finance background is required-the calculation is straightforward division and multiplication. The key skill is interpreting results within your industry context and competitive landscape. Focus on understanding what drives your COGS and how pricing decisions impact the ratio rather than complex financial modeling.
Executive roles require strategic thinking about profitability and operational efficiency. Demonstrating fluency in margin analysis shows you understand fundamental business drivers and can make data-driven decisions about pricing, cost management, and resource allocation. This expertise becomes essential for P&L responsibility and board-level discussions.
Explore operating profit margins and EBITDA analysis to understand how overhead costs impact overall profitability. These metrics build on gross profit foundations and provide deeper insight into management effectiveness and scalability potential across your business operations.
Related Micro-courses