Loading subject page…

- Finance
- Financial Ratio Analysis
- Profitability Ratios: Net Profit Ratio
Micro-course: Financial Ratio Analysis
5,239 views
Learn key concepts and earn your certificate.




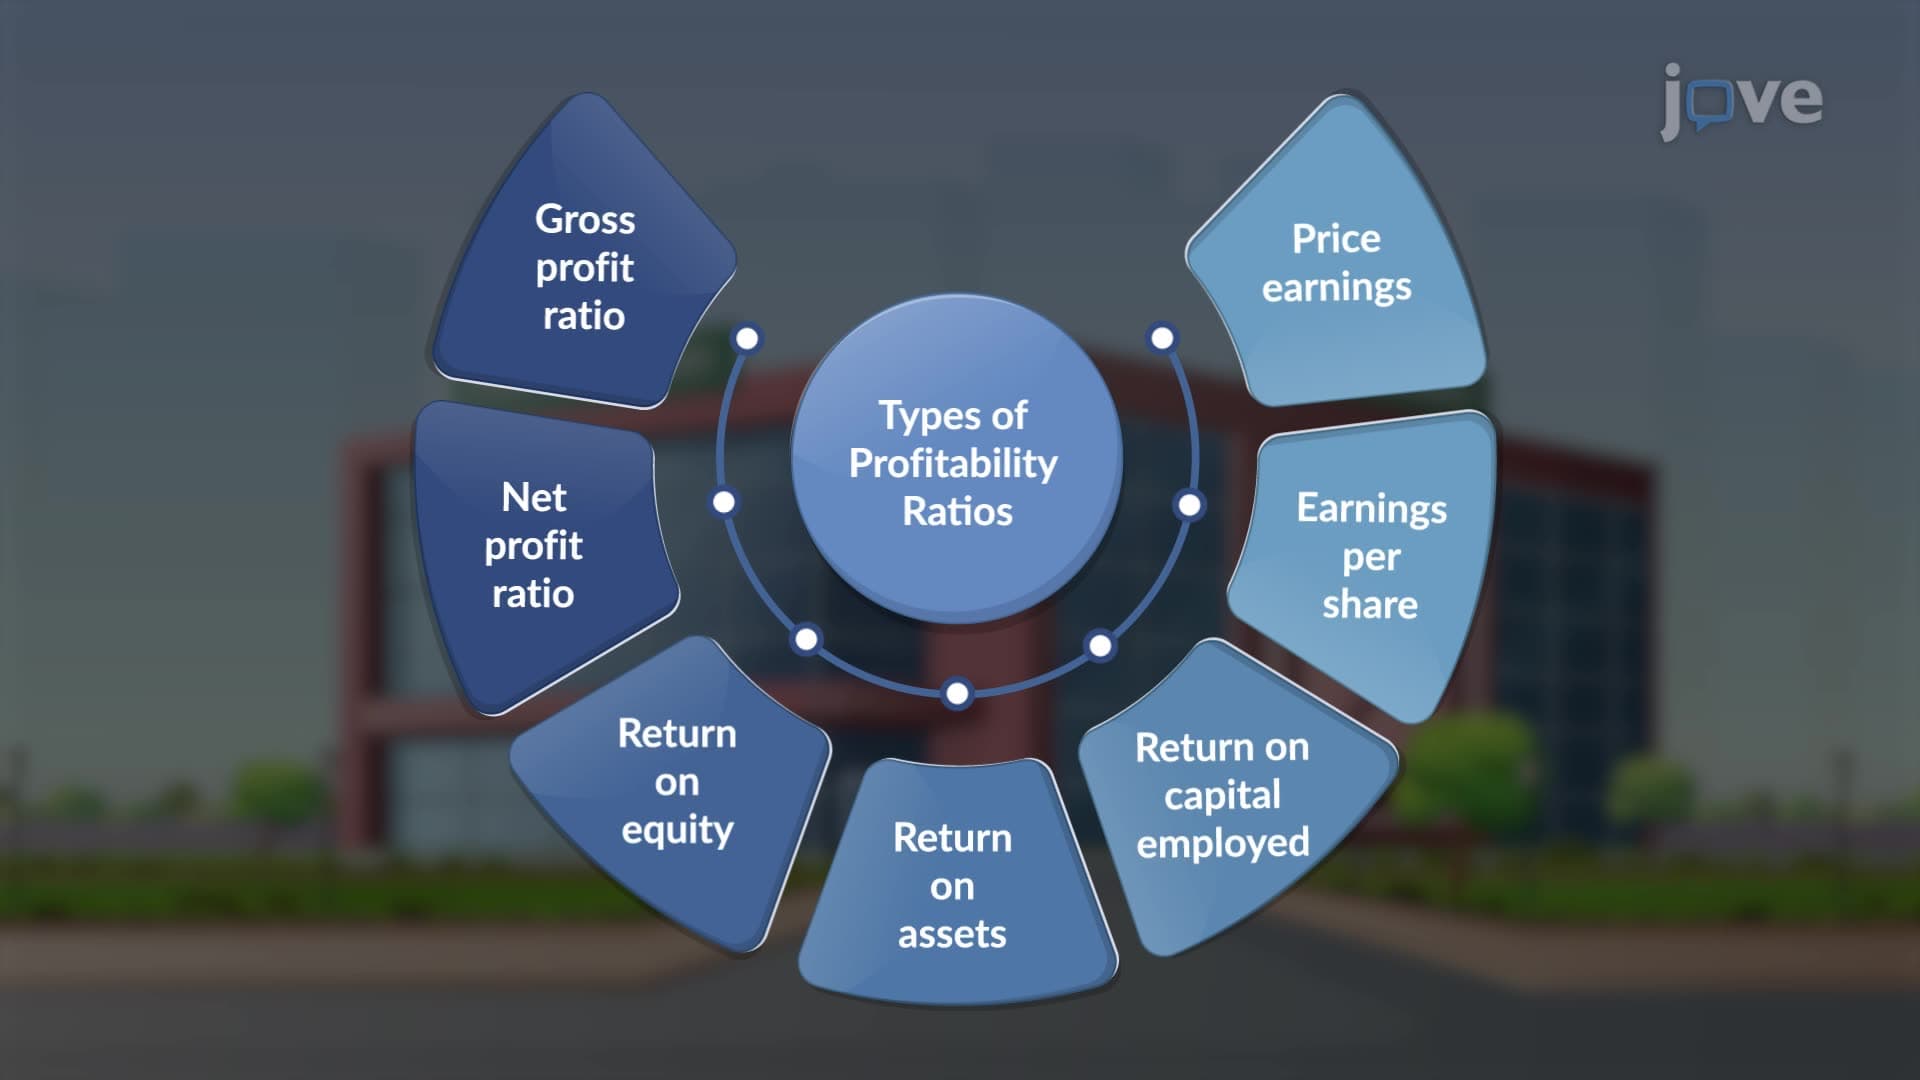
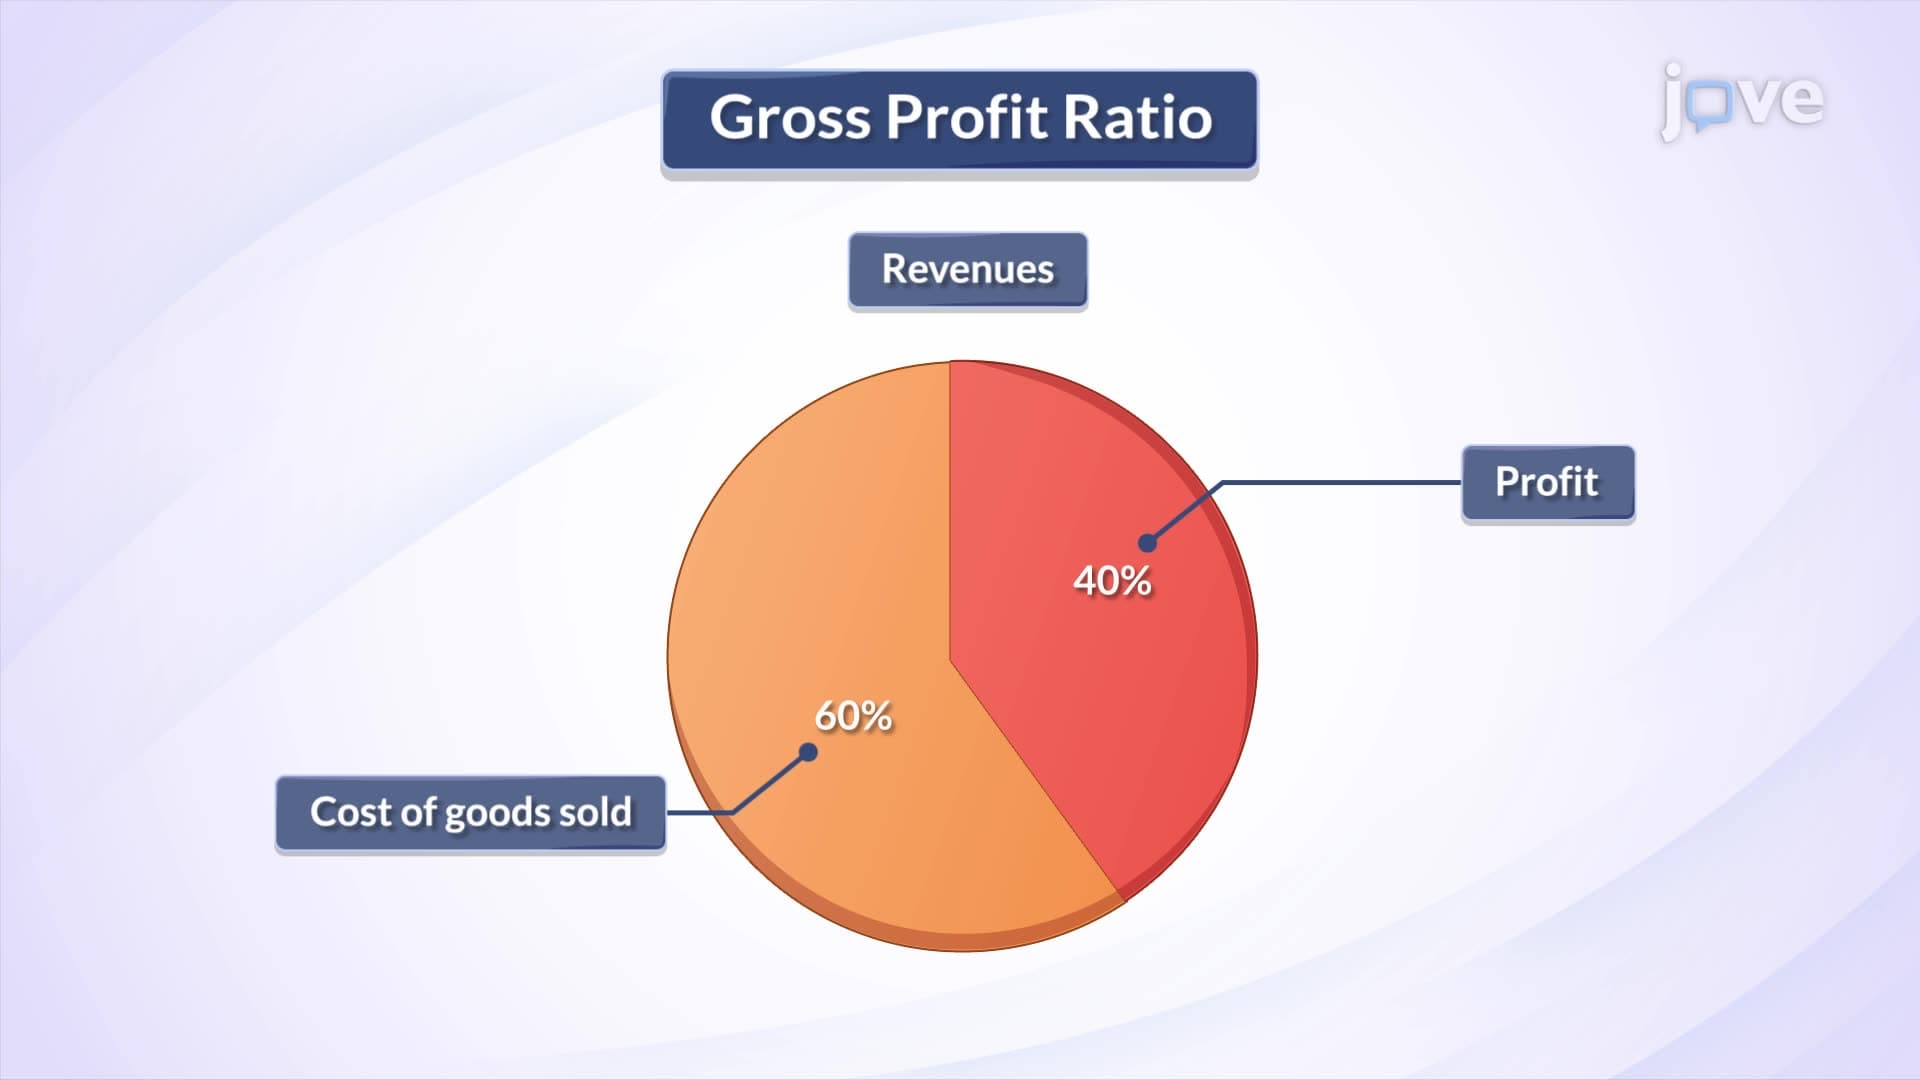
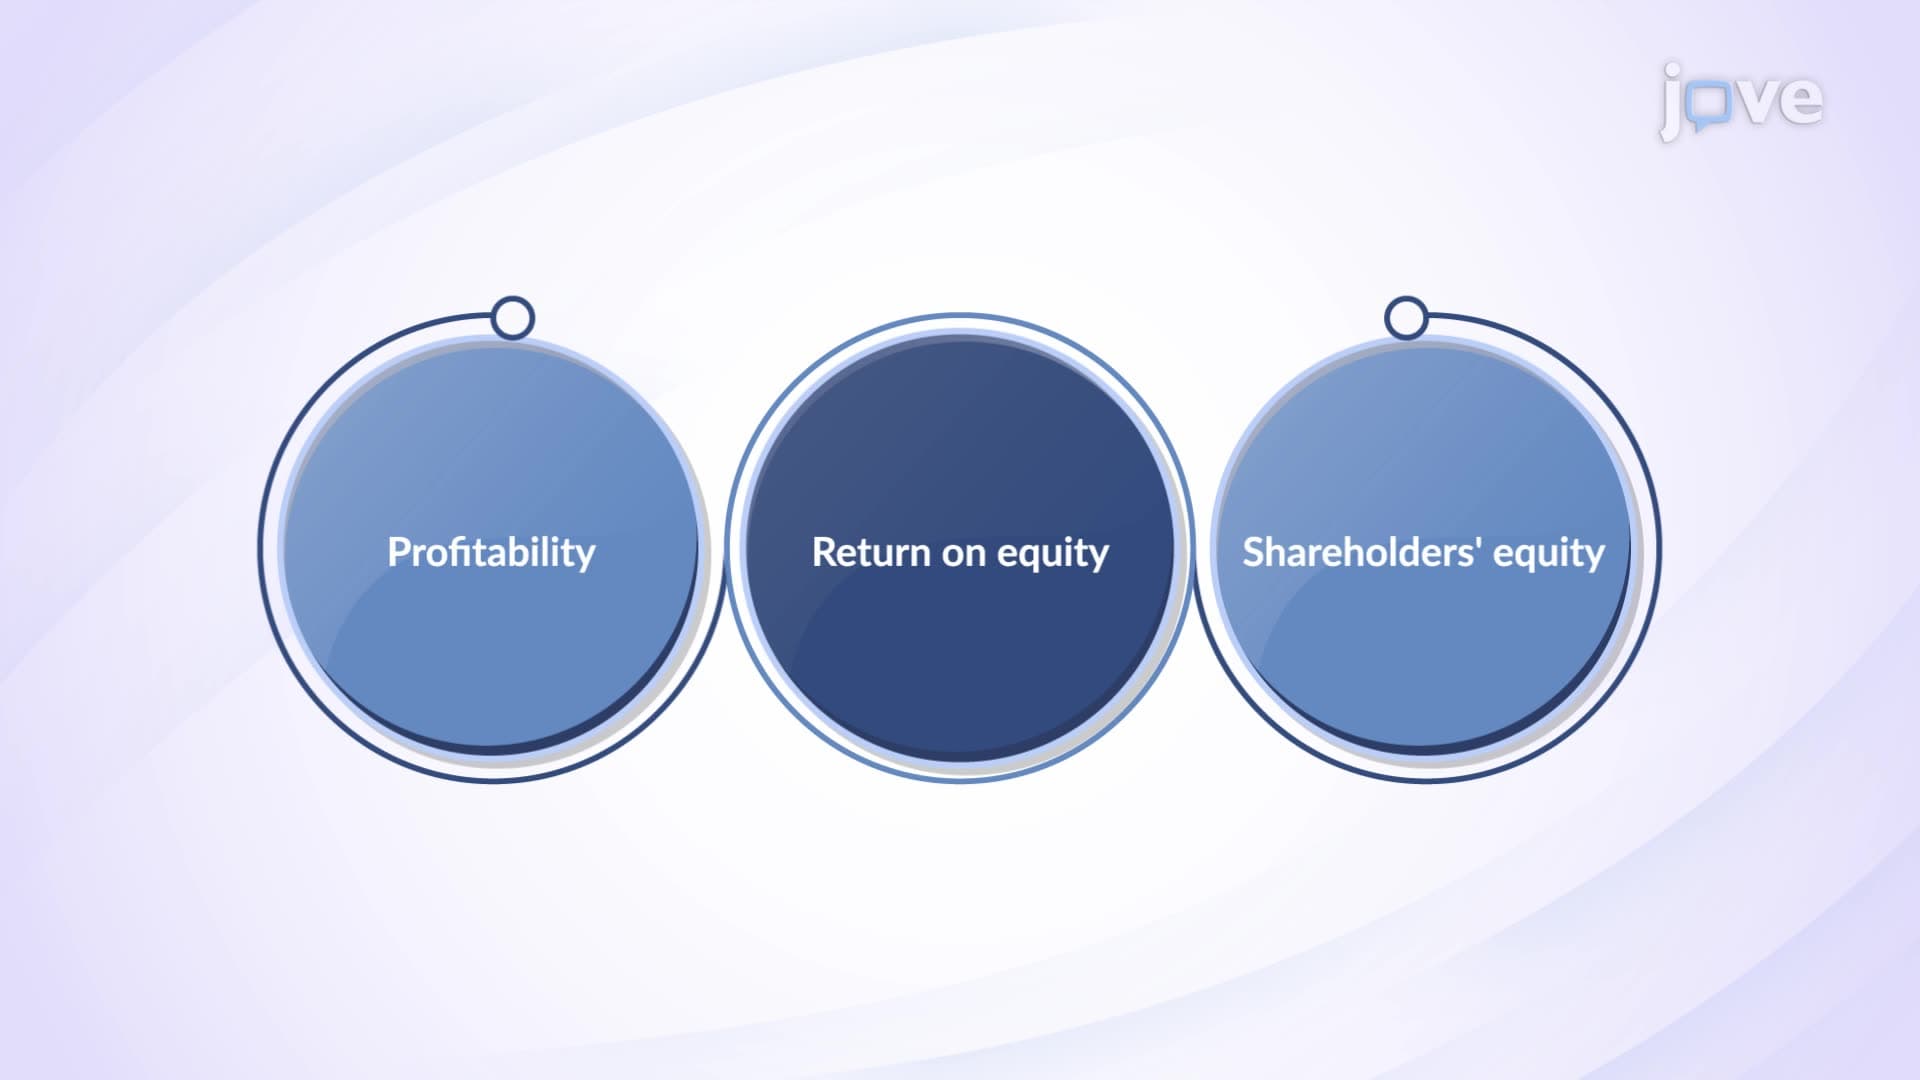


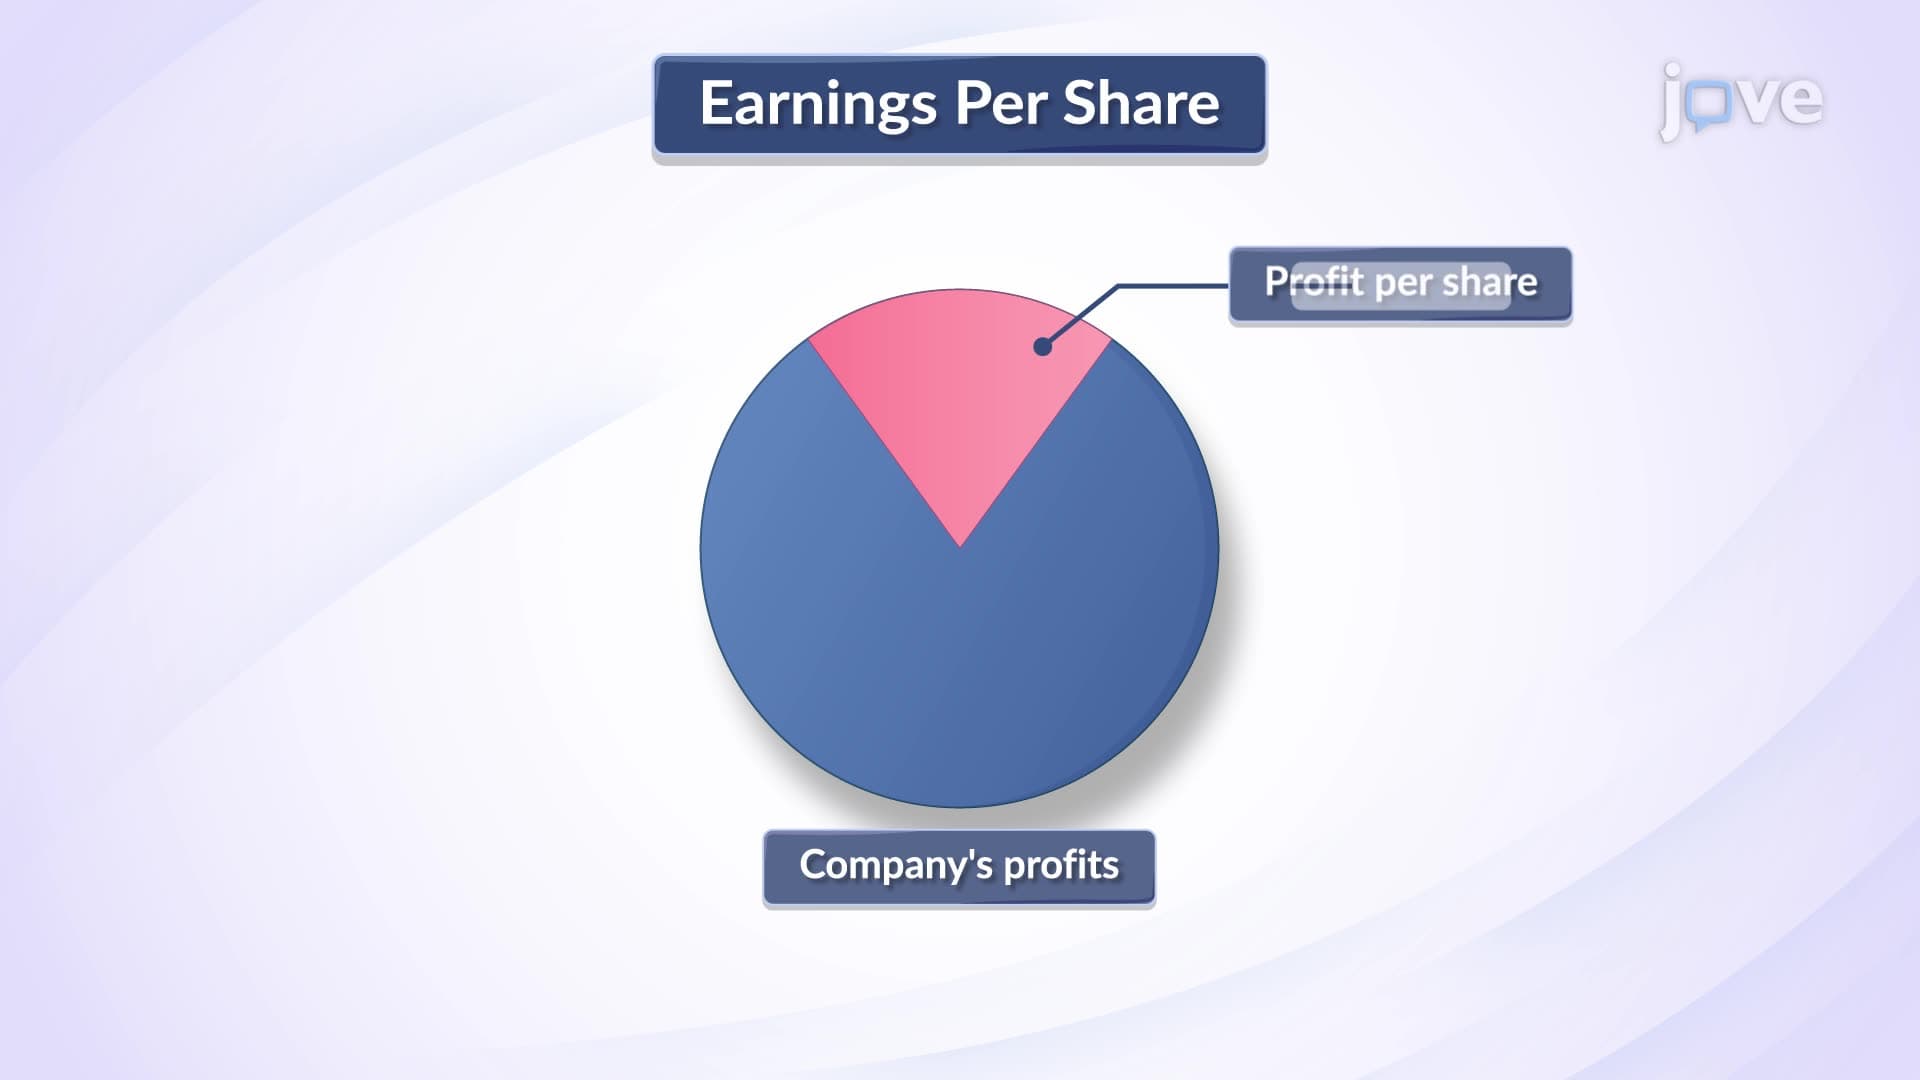







Profitability Ratios: Net Profit Ratio


00:00
01:28
Video Summary: Profitability Ratios Net Profit Ratio Explained
Profitability ratios net profit analysis remains critical as businesses navigate margin pressures from inflation and supply chain disruptions. Companies like Home Depot use net profit ratio calculations to benchmark operational efficiency and guide strategic pricing decisions across their retail footprint. The Profitability Ratios Net Profit Ratio Explained framework demonstrates how dividing net profit by total revenue reveals the percentage of each sales dollar retained after all expenses. This metric directly impacts executive compensation, investor confidence, and capital allocation decisions. Watch the full video on JoVE Coach to master this concept with expert-led visuals and step-by-step explanations.
- Apply net profit ratio calculations to evaluate your division's financial performance and identify operational efficiency opportunities
- Analyze competitive positioning by benchmarking your company's profitability ratios against industry leaders and sector averages
- Assess pricing strategy effectiveness using net profit margins to determine optimal price points that maximize profitability
- Evaluate cost management initiatives by tracking net profit ratio improvements across quarterly reporting periods
- Implement data-driven decision frameworks that incorporate profitability metrics into budget planning and resource allocation
- Leverage net profit analysis to prepare compelling business cases for capital investments and expansion opportunities
- Identify performance trends that signal need for strategic pivots in operations, pricing, or market positioning
- Compare business unit profitability to optimize portfolio management and identify underperforming divisions
Understanding Net Profit Ratio in Strategic Context
When Starbucks reports quarterly earnings, analysts immediately focus on profitability ratios net profit margins to assess operational health beyond just revenue growth. The net profit ratio reveals how effectively management converts sales into actual profit after accounting for cost of goods sold, operating expenses, interest, taxes, and other obligations.
The Strategic Formula: Net Profit Ratio = (Net Profit ÷ Total Revenue) × 100
This calculation provides immediate insight into operational efficiency. Consider Target Corporation's recent performance: with annual revenues exceeding $100 billion and net profits around $3 billion, their net profit ratio of approximately 3% reflects the competitive retail landscape and thin margins typical in mass merchandising.
Industry Context and Competitive Benchmarking
Different sectors maintain vastly different profitability expectations. Software companies like Microsoft often achieve net profit ratios exceeding 30%, while grocery chains like Kroger typically operate with ratios below 2%. Understanding these benchmarks enables executives to set realistic targets and identify improvement opportunities.
Manufacturing companies face unique challenges in maintaining consistent profitability ratios. Supply chain disruptions, raw material cost volatility, and labor expense fluctuations directly impact the bottom line. A furniture manufacturer achieving a 15% net profit ratio, as illustrated in our example, demonstrates strong cost management and pricing power in a capital-intensive industry.
Operational Decision Framework
Successful executives use net profit ratio analysis to drive three critical business decisions. First, pricing strategy optimization requires understanding the relationship between price increases and volume retention. Second, cost structure evaluation identifies which expense categories most significantly impact profitability. Third, growth investment decisions depend on maintaining acceptable profit margins while scaling operations.
Performance Management Applications
Department heads and business unit leaders leverage these metrics for performance reviews and strategic planning. When net profit ratios decline, management must quickly diagnose whether the issue stems from revenue challenges, cost inflation, or operational inefficiencies. This analysis directly informs budget adjustments, headcount decisions, and capital expenditure priorities.
Frequently Asked Questions
Net profit ratio measures what percentage of revenue becomes actual profit after all expenses. It's essential for evaluating operational efficiency, setting pricing strategies, and making informed investment decisions that impact your company's financial health.
Present net profit ratios alongside industry benchmarks to justify budget requests, pricing changes, or operational improvements. Compare quarterly trends to demonstrate progress and identify areas requiring management attention or resource reallocation.
Monitor for consistent quarter-over-quarter declines or performance significantly below industry averages. Investigate immediately if ratios drop due to uncontrolled cost increases, pricing pressure from competitors, or operational inefficiencies affecting your market position.
Amazon leverages high-margin services like AWS cloud computing and advertising to offset low-margin retail operations. Their diversified revenue model demonstrates how companies can maintain overall profitability while accepting lower margins in competitive segments.
Basic financial literacy suffices for most business applications. Understanding income statements and key expense categories enables effective ratio analysis. Focus on trends and comparisons rather than complex accounting principles.
Financial acumen distinguishes high-potential professionals across all functions. Executives who understand profitability metrics make better strategic decisions, communicate more effectively with leadership, and qualify for senior roles requiring P&L responsibility.
Explore gross profit margins, operating profit ratios, and return on assets to build comprehensive financial analysis capabilities. These complementary metrics provide deeper insights into different aspects of business performance and operational efficiency.
Related Micro-courses