Loading subject page…

- Finance
- Financial Ratio Analysis
- Profitability Ratios: Price Earning Ratio
Micro-course: Financial Ratio Analysis
5,239 views
Learn key concepts and earn your certificate.








Profitability Ratios: Price Earning Ratio

00:00
01:21
Video Summary: Profitability Ratios Price Earning Ratio Explained
Market volatility and earnings uncertainty make stock valuation increasingly complex for portfolio managers and investment committees. Profitability ratios price earning ratio analysis provides the foundational framework for assessing whether companies like Apple (trading at 25x earnings) or Walmart (at 15x earnings) represent sound investment opportunities. This critical financial metric helps executives evaluate acquisition targets, benchmark competitive positioning, and communicate investment rationale to stakeholders. Watch the full video on JoVE Coach to master this concept with expert-led visuals and step-by-step explanations.
- Apply P/E ratio calculations to evaluate potential acquisition targets and investment opportunities in your industry sector
- Compare competitor valuations to identify market positioning gaps and strategic advantages in earnings multiples
- Analyze investor sentiment and growth expectations reflected in P/E ratios during quarterly earnings calls and board presentations
- Evaluate whether your company's current P/E ratio signals overvaluation or undervaluation relative to industry benchmarks
- Implement P/E ratio screening to build investment portfolios and recommend equity positions to clients or senior management
- Assess market timing opportunities by identifying sectors with historically low P/E ratios during economic cycles
- Leverage P/E ratio trends to support pricing decisions for IPOs, secondary offerings, and private equity transactions
- Identify red flags in companies with unusually high or low P/E ratios that may indicate operational challenges or unsustainable growth
Understanding Profitability Ratios Price Earning Ratio in Strategic Context
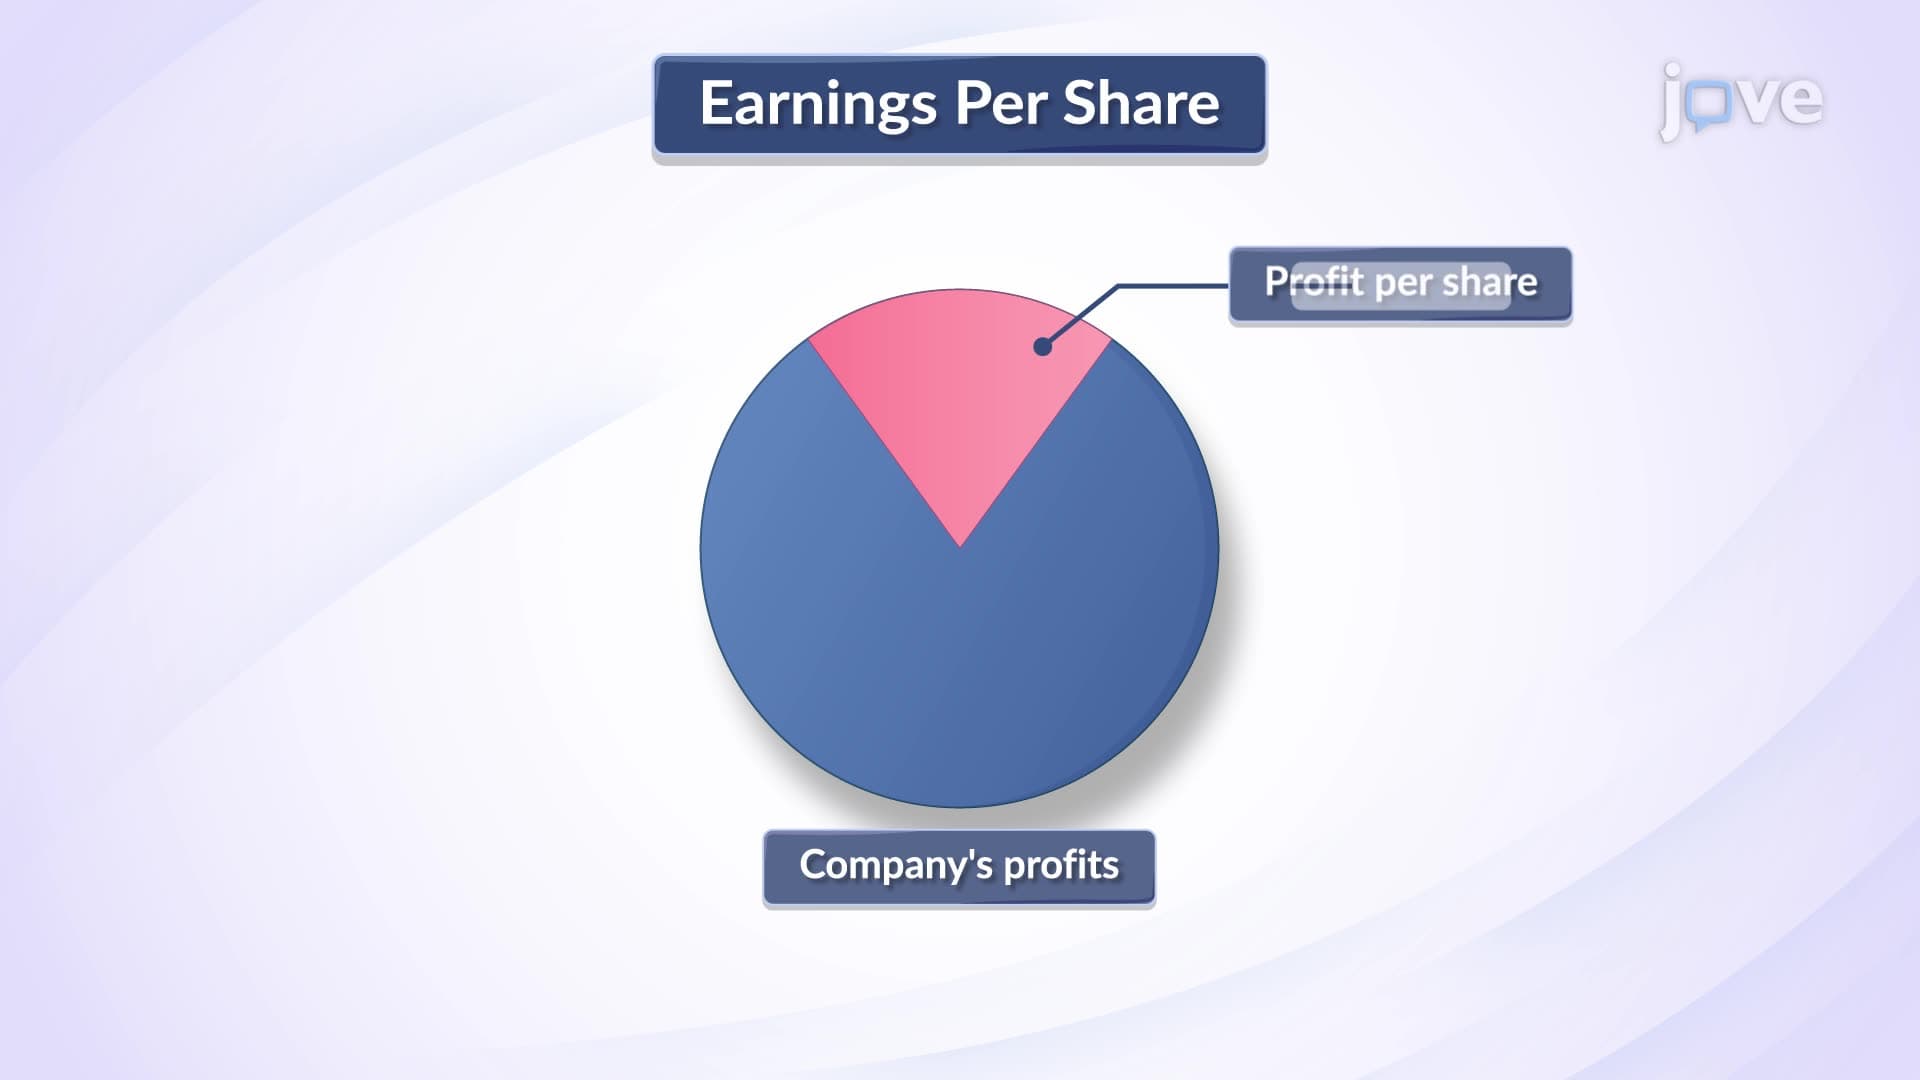
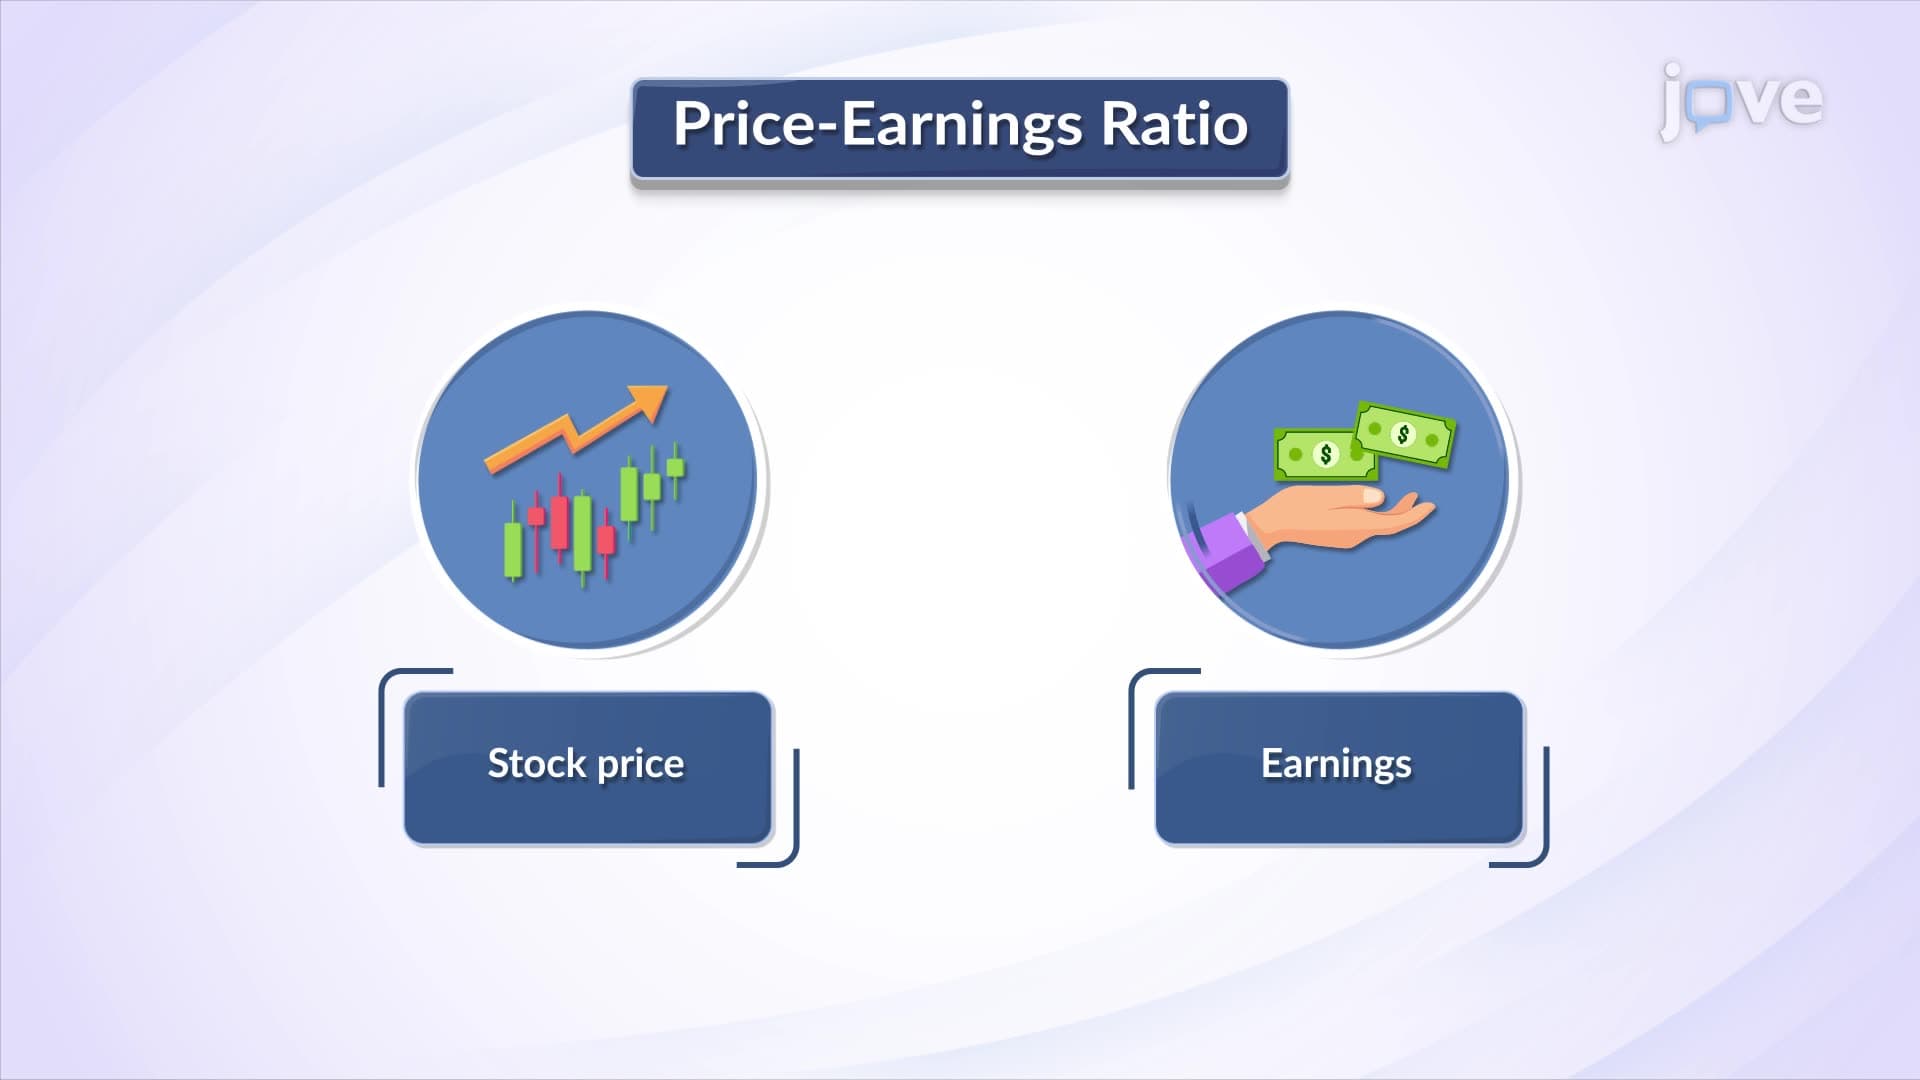
When Berkshire Hathaway's investment team evaluates potential acquisitions, they consistently analyze the price-earnings ratio as a core valuation metric. This fundamental profitability ratio-calculated as Market Price Per Share ÷ Earnings Per Share-reveals how much investors are willing to pay for each dollar of a company's annual earnings, providing critical insights for strategic decision-making.
P/E Ratios as Competitive Intelligence Tools
Smart executives use P/E ratio analysis to decode competitor positioning and market sentiment. Consider the technology sector: Microsoft trades at approximately 28x earnings while IBM trades at 13x earnings. This disparity signals market confidence in Microsoft's growth trajectory versus concerns about IBM's legacy business model transformation. Portfolio managers leverage these insights to identify undervalued opportunities and overheated markets before major corrections occur.
Industry Benchmarking and Valuation Context
P/E ratios vary dramatically across sectors, making industry-specific analysis essential for informed decision-making. Utilities like Consolidated Edison typically trade at 18-22x earnings, reflecting stable but modest growth expectations. Meanwhile, high-growth SaaS companies like Salesforce command P/E ratios exceeding 50x, indicating investor willingness to pay premiums for rapid revenue expansion and market dominance potential.
Strategic Limitations and Risk Management Applications
Seasoned CFOs recognize that P/E ratios provide historical snapshots, not forward-looking growth predictions. Amazon's P/E ratio fluctuated wildly during its expansion phases, sometimes exceeding 100x earnings, yet delivered exceptional long-term returns. This highlights why successful investment committees combine P/E analysis with forward P/E ratios, PEG ratios (Price/Earnings/Growth), and qualitative factors like competitive moats, management quality, and market disruption potential.
Effective business leaders use P/E ratios as starting points for deeper financial analysis, not standalone decision criteria. During merger negotiations, investment banking teams present P/E ratio comparisons alongside DCF models and precedent transaction analysis to build comprehensive valuation arguments that withstand board scrutiny and regulatory review.
Frequently Asked Questions
The P/E ratio measures how much investors pay for each dollar of company earnings, calculated as stock price divided by earnings per share. It's essential for evaluating investment opportunities, benchmarking against competitors, and assessing whether acquisition targets offer fair value.
Compare your target company's P/E ratio against industry averages and direct competitors to demonstrate relative value. Present both trailing P/E (based on past earnings) and forward P/E (based on projected earnings) to show current valuation versus growth expectations.
High P/E ratios above 40x may signal overvaluation or unrealistic growth expectations, while P/E ratios below 10x could indicate underlying business problems or market pessimism. Always investigate the fundamental reasons behind extreme P/E ratios before making investment decisions.
Netflix's P/E ratio dropped from 80x in 2021 to 15x in 2022 as subscriber growth slowed and competition intensified. This dramatic shift helped investors recognize the streaming market's maturation and adjust their growth expectations accordingly.
No advanced degree required-P/E ratios use simple division that any manager can calculate. The key skill is interpreting results within industry context and understanding what drives P/E ratio changes over time.
P/E ratio fluency demonstrates analytical thinking and valuation skills essential for roles in investment banking, corporate development, portfolio management, and executive leadership positions requiring strategic decision-making.
Study PEG ratios (Price/Earnings/Growth) to factor growth rates into valuation, and learn enterprise value ratios like EV/EBITDA for more comprehensive company comparisons that account for debt levels and capital structure differences.
Related Micro-courses