Loading subject page…

- Finance
- Financial Ratio Analysis
- Profitability Ratios
Micro-course: Financial Ratio Analysis
5,239 views
Learn key concepts and earn your certificate.


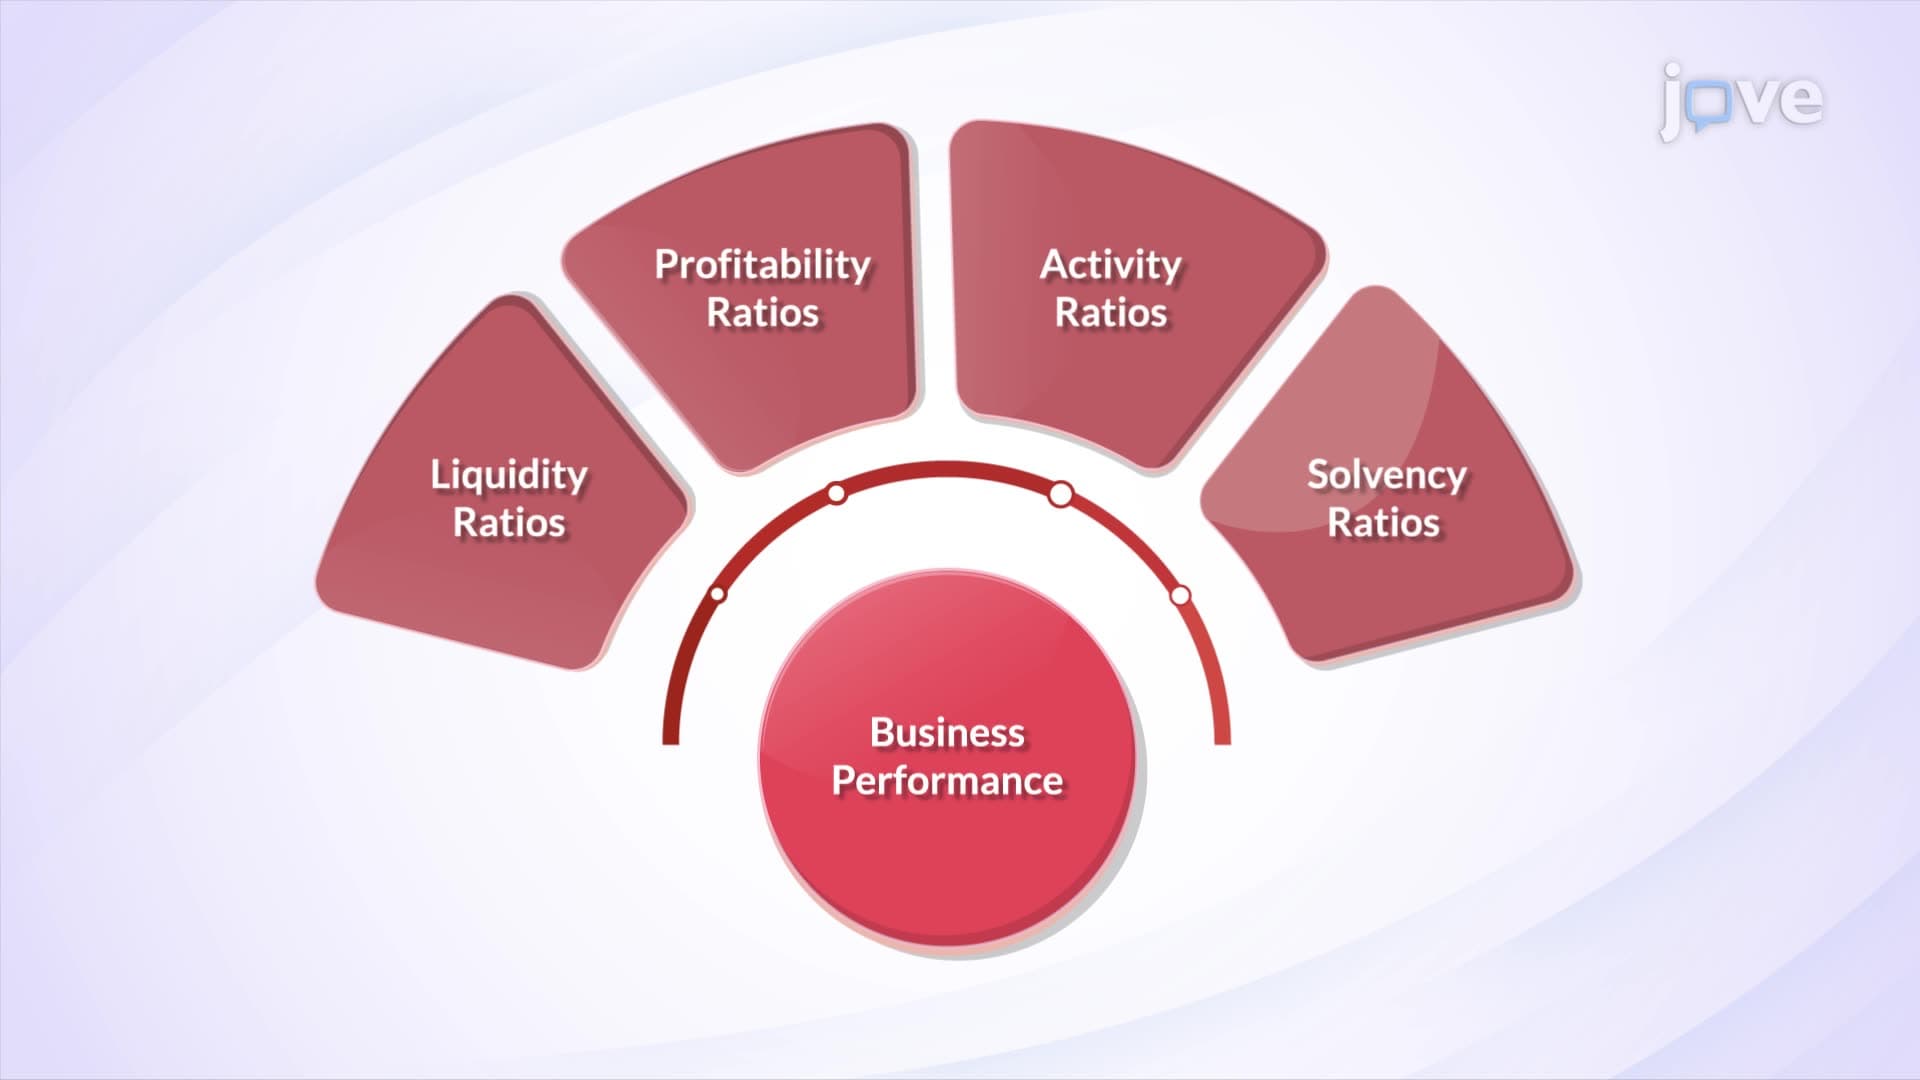
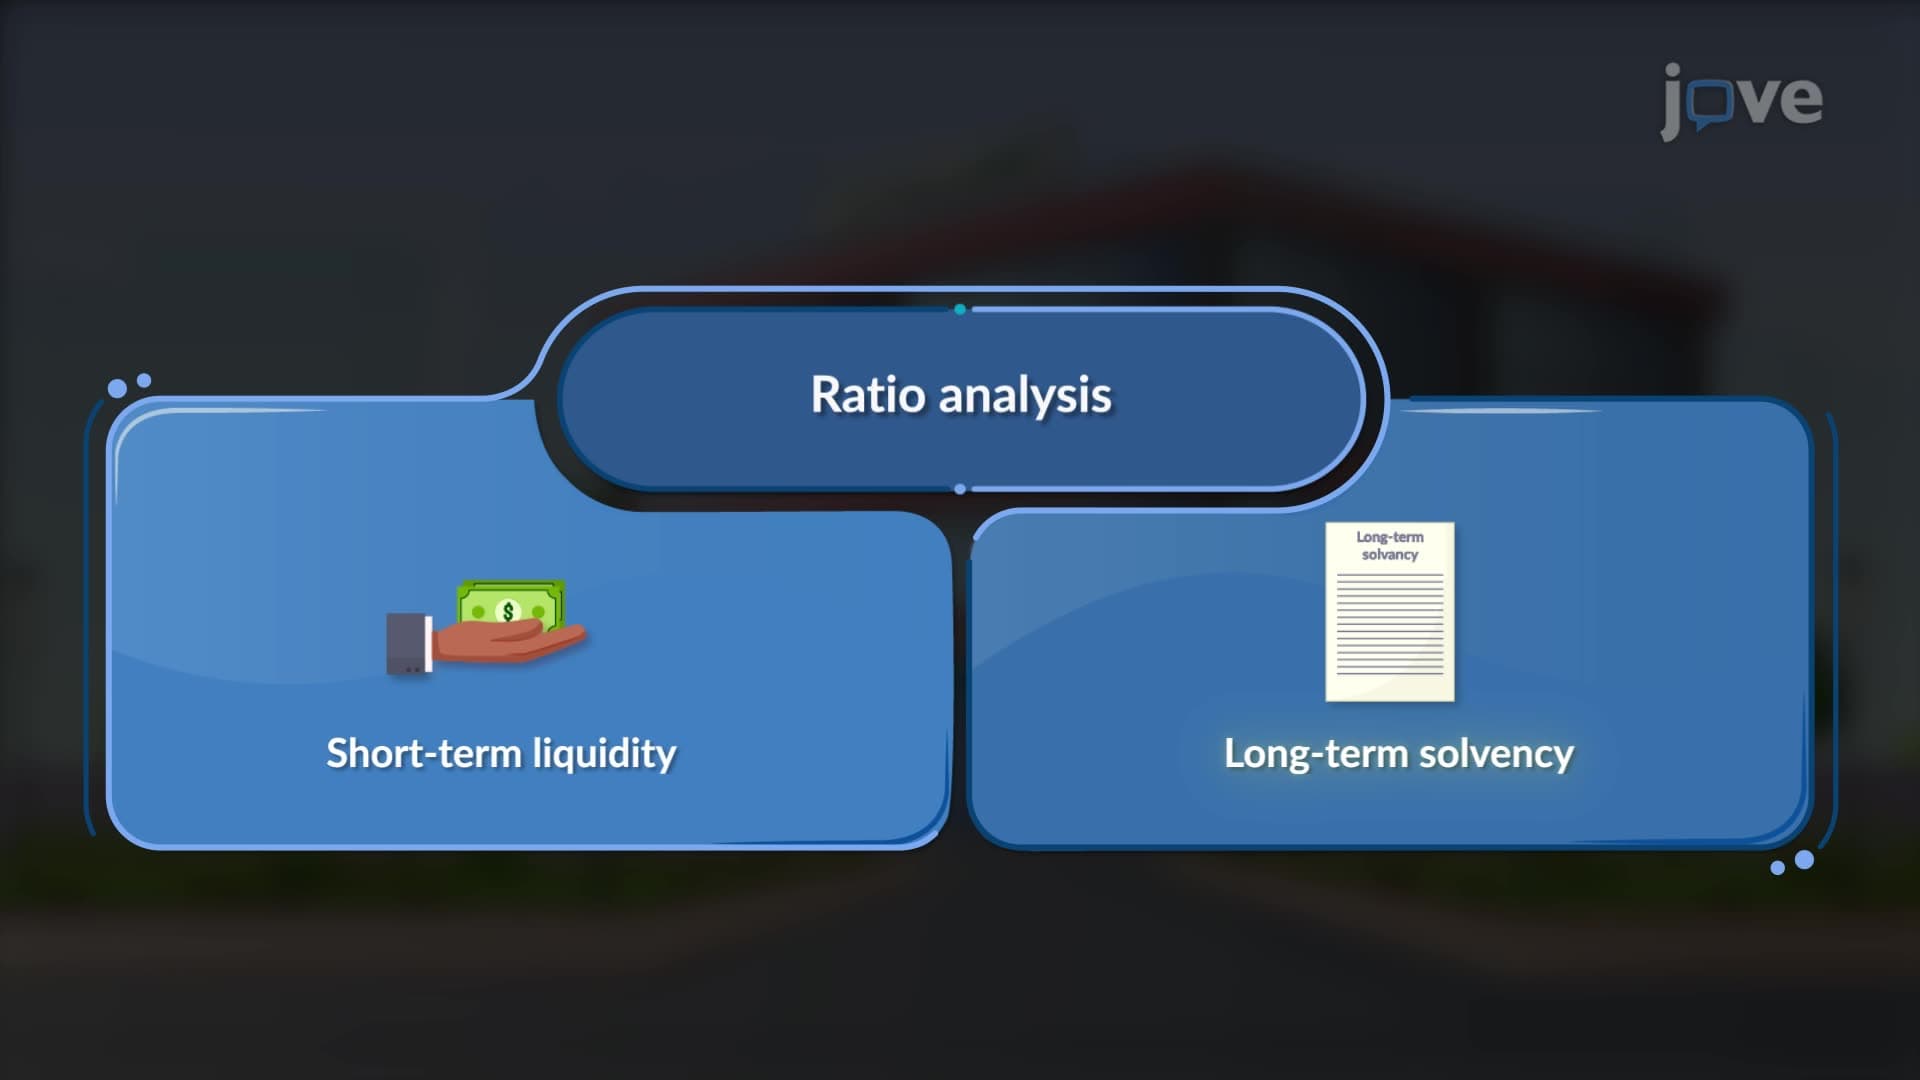
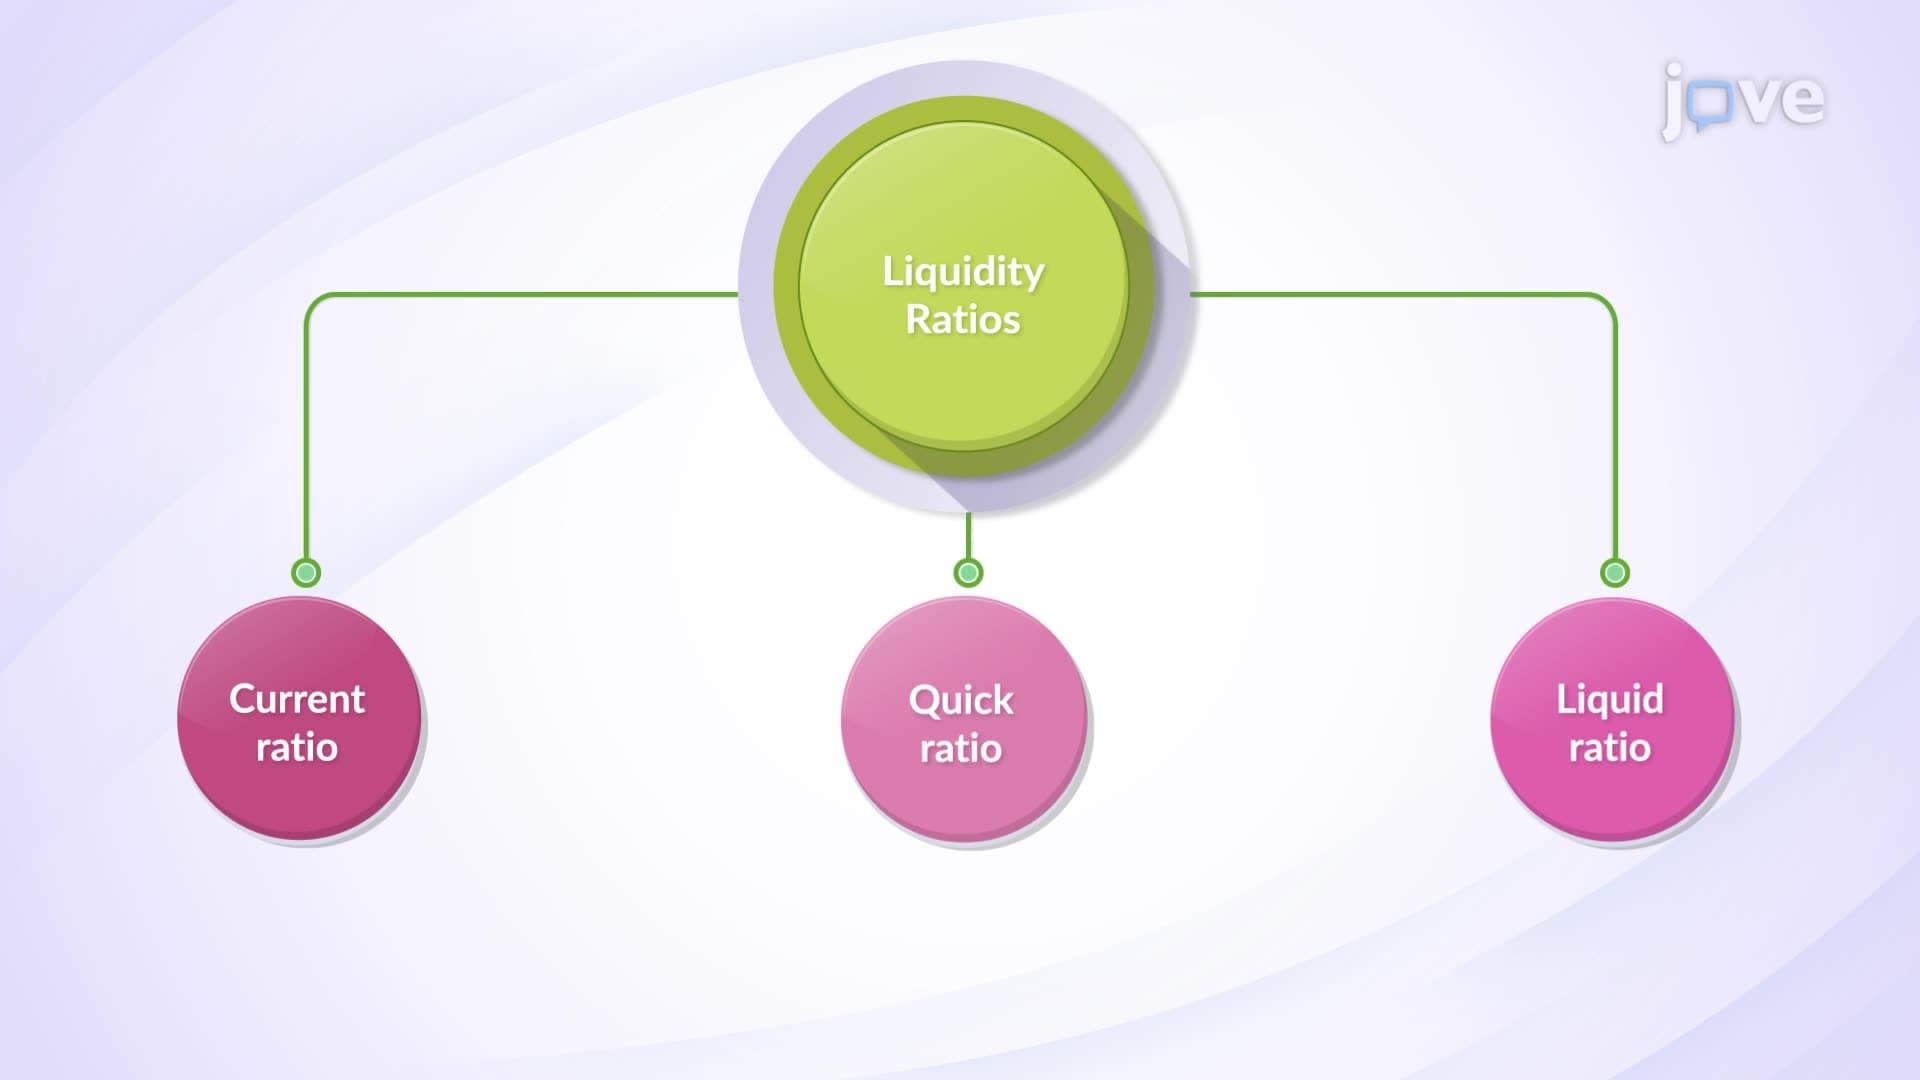














Profitability Ratios

00:00
01:29
Video Summary: What are Profitability Ratios
When Amazon reported a 35% surge in operating income while competitors struggled with margin compression, investors immediately turned to profitability ratios to decode the retail giant's financial superiority. Profitability ratios serve as the financial compass that guides executives through critical resource allocation decisions and competitive positioning strategies. These metrics reveal how effectively companies like Walmart, Apple, and JPMorgan Chase convert revenue into sustainable profits while managing assets and equity efficiently. Watch the full video on JoVE Coach to master this concept with expert-led visuals and step-by-step explanations.
- Apply profitability ratio analysis to evaluate your company's operational efficiency against industry benchmarks and identify areas for strategic improvement
- Assess competitive positioning by comparing your organization's profit margins with market leaders to inform pricing and cost management strategies
- Evaluate investment opportunities using return ratios to guide capital allocation decisions and portfolio management initiatives
- Implement performance measurement frameworks that track profitability trends across business units and product lines
- Analyze stakeholder communications by translating profitability metrics into compelling narratives for board presentations and investor relations
- Compare historical performance patterns to forecast future profitability and support strategic planning initiatives
- Leverage ratio insights to strengthen lending negotiations and demonstrate creditworthiness to financial institutions
- Identify operational inefficiencies through margin analysis to drive process improvements and cost optimization programs
Understanding Profitability Ratios in Strategic Context
Modern business leaders face relentless pressure to demonstrate value creation while managing increasingly complex market dynamics. When Target's gross margins declined from 30% to 26% during the pandemic supply chain crisis, executives relied on profitability ratio analysis to navigate pricing decisions and operational adjustments that ultimately restored investor confidence.
Core Profitability Metrics for Executive Decision-Making
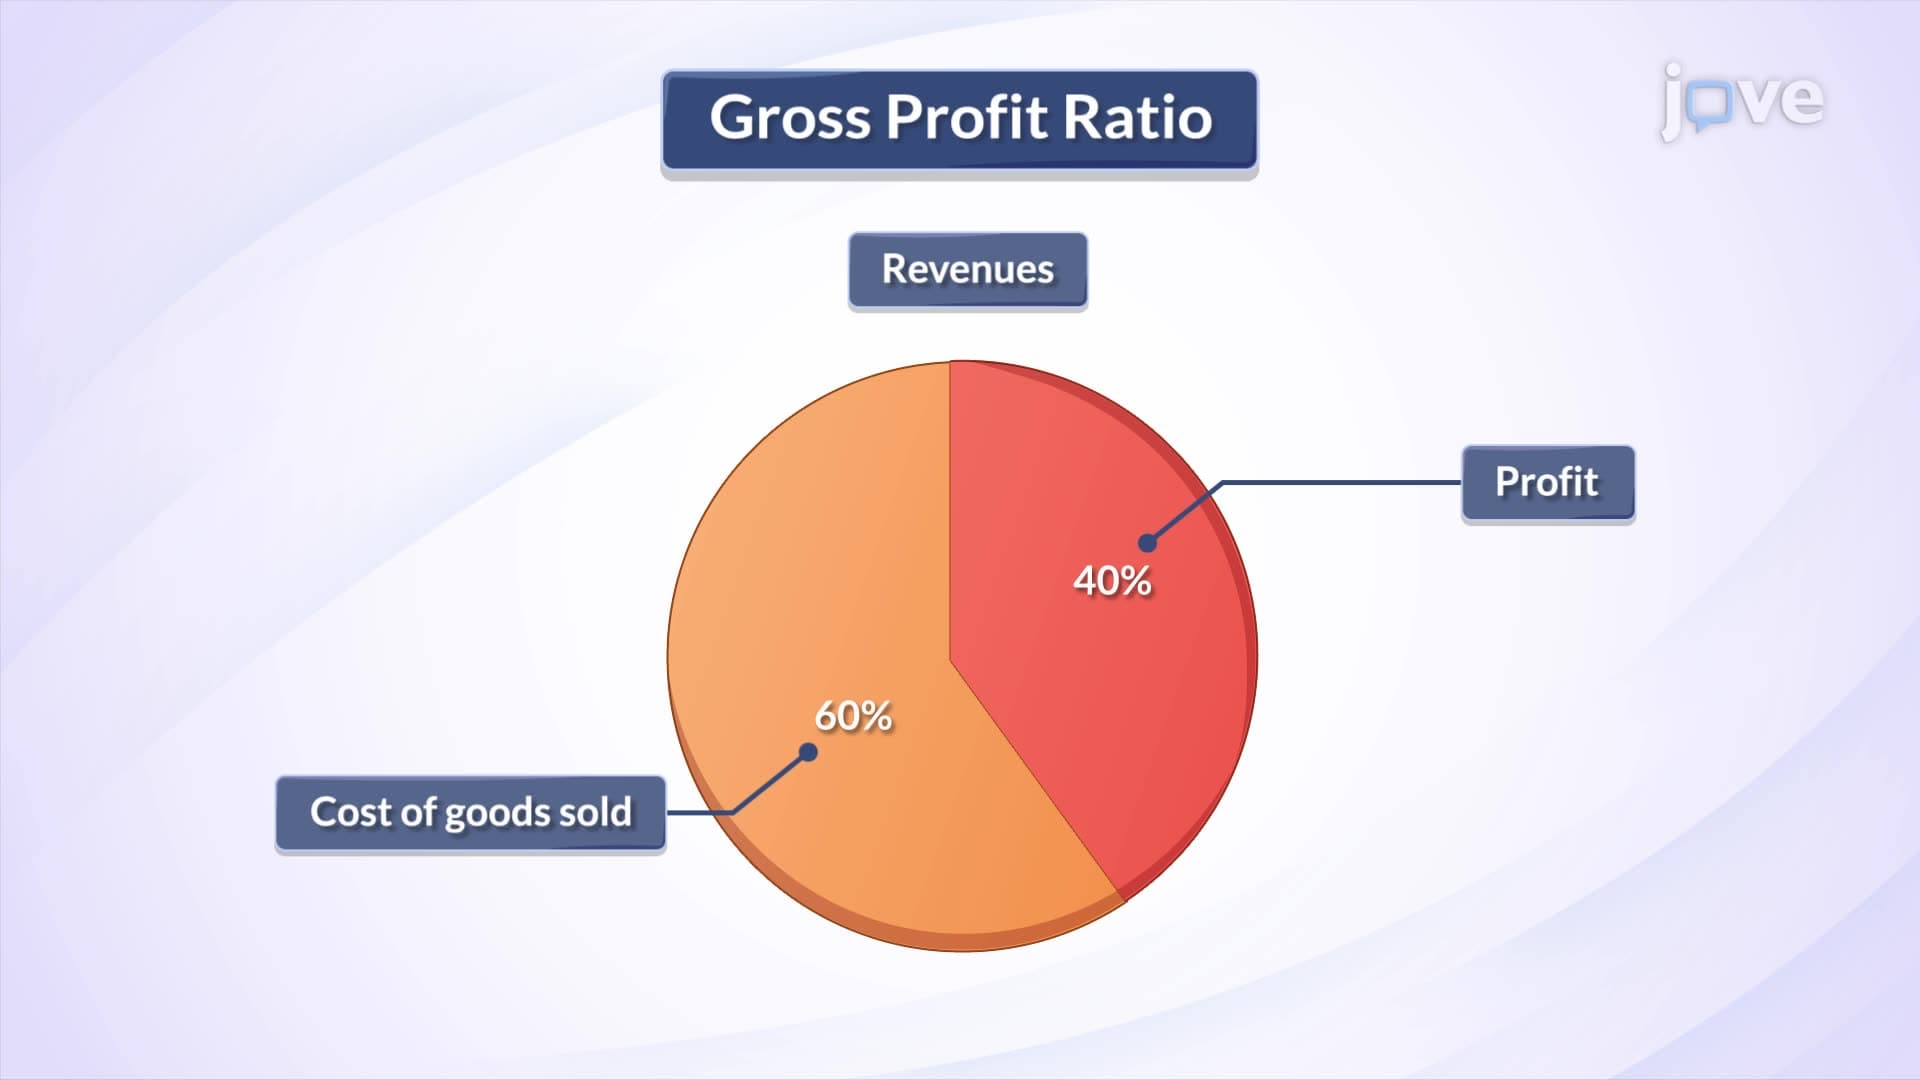
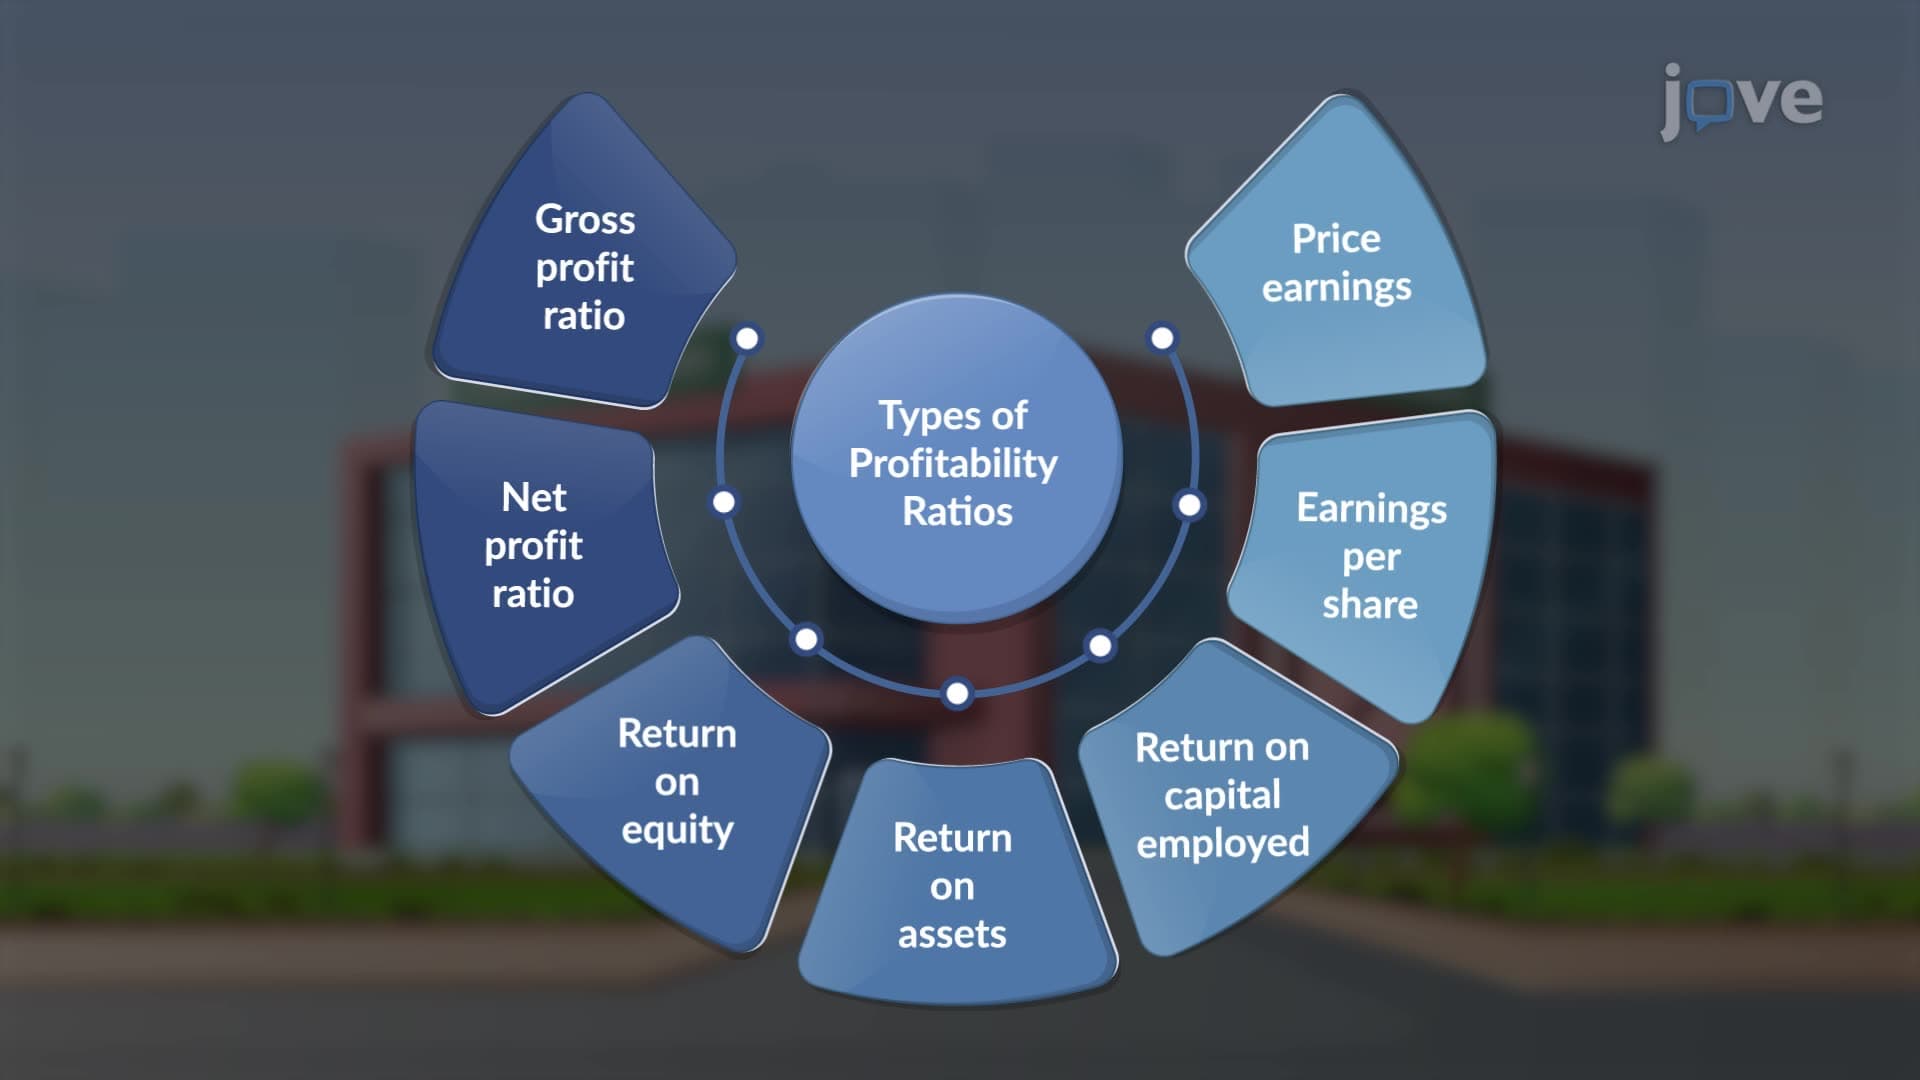
The profitability ratios framework encompasses seven critical measurements that inform strategic decisions across every business function. Gross profit margin reveals operational efficiency in core business activities, while net profit margin captures the complete picture including overhead, interest, and tax impacts. Return on equity (ROE) measures management's effectiveness in generating shareholder returns, making it a cornerstone metric for executive compensation and board evaluations.
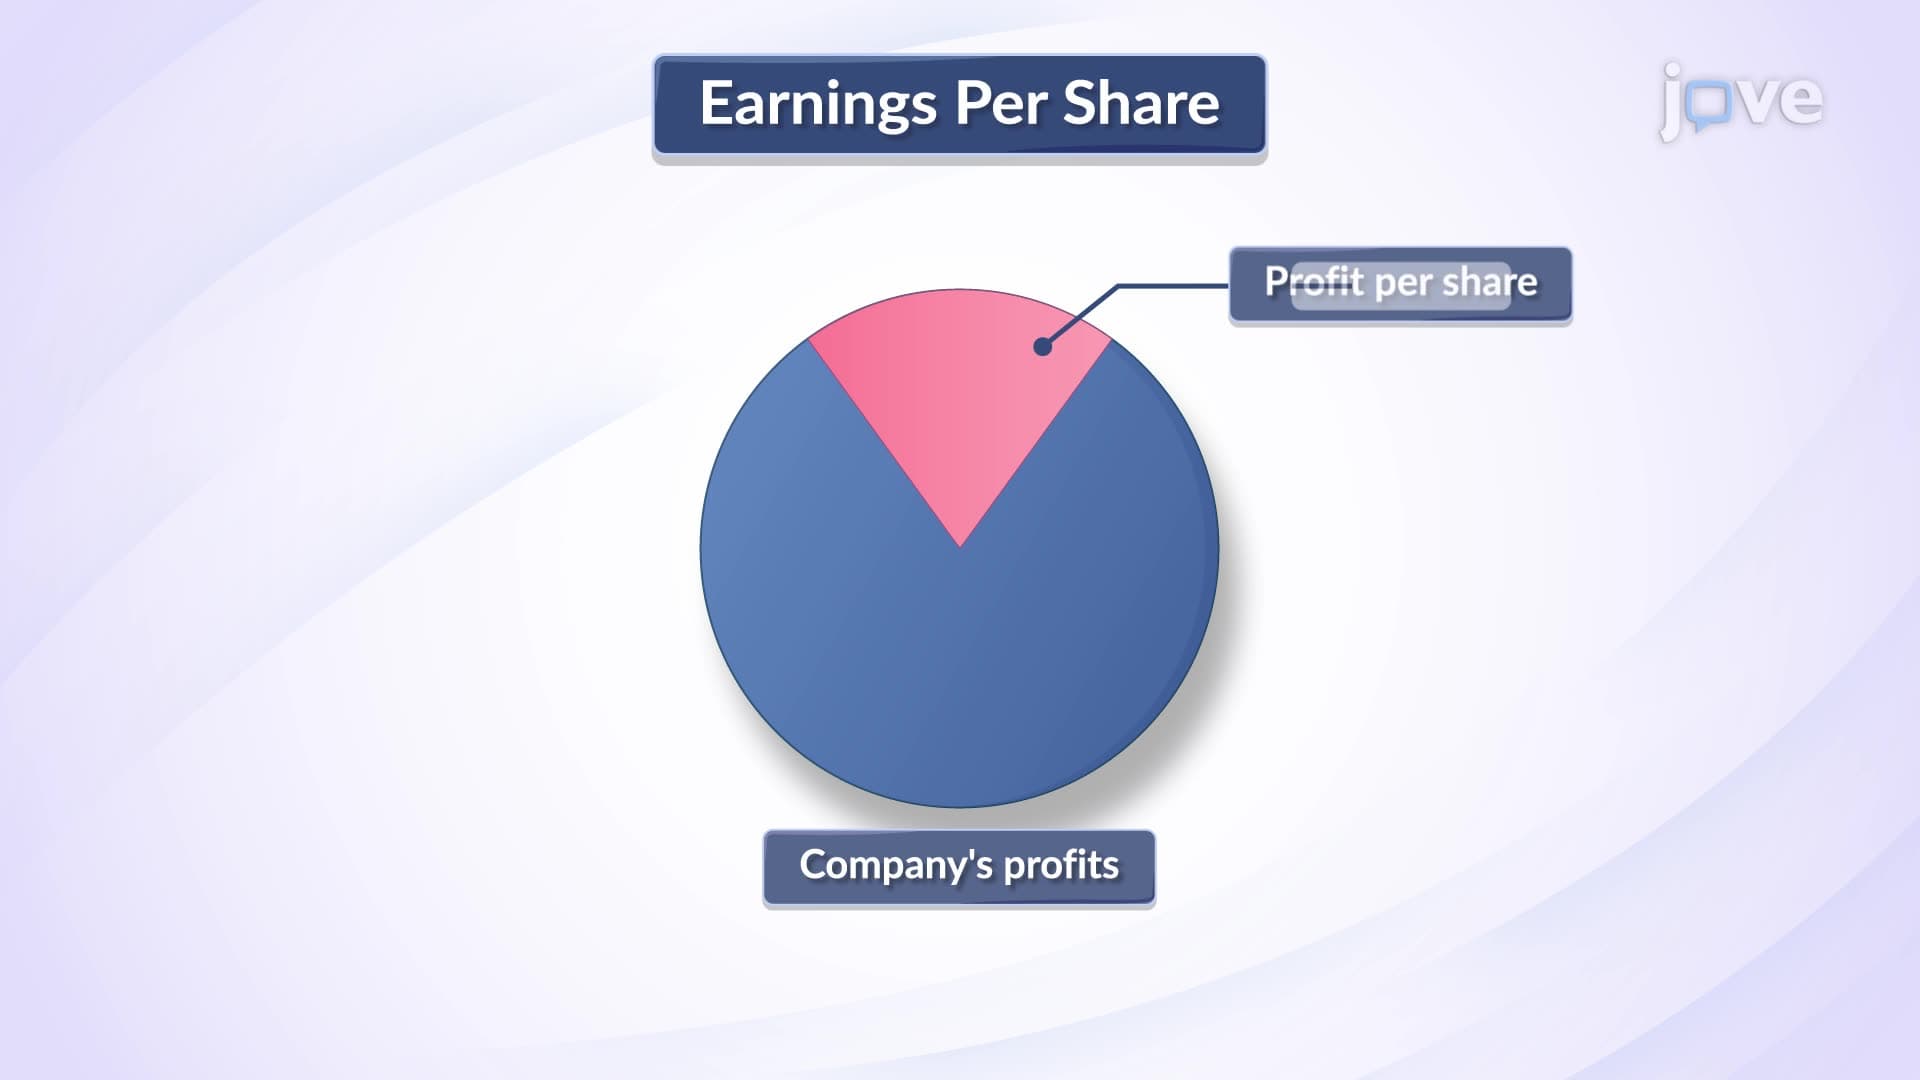
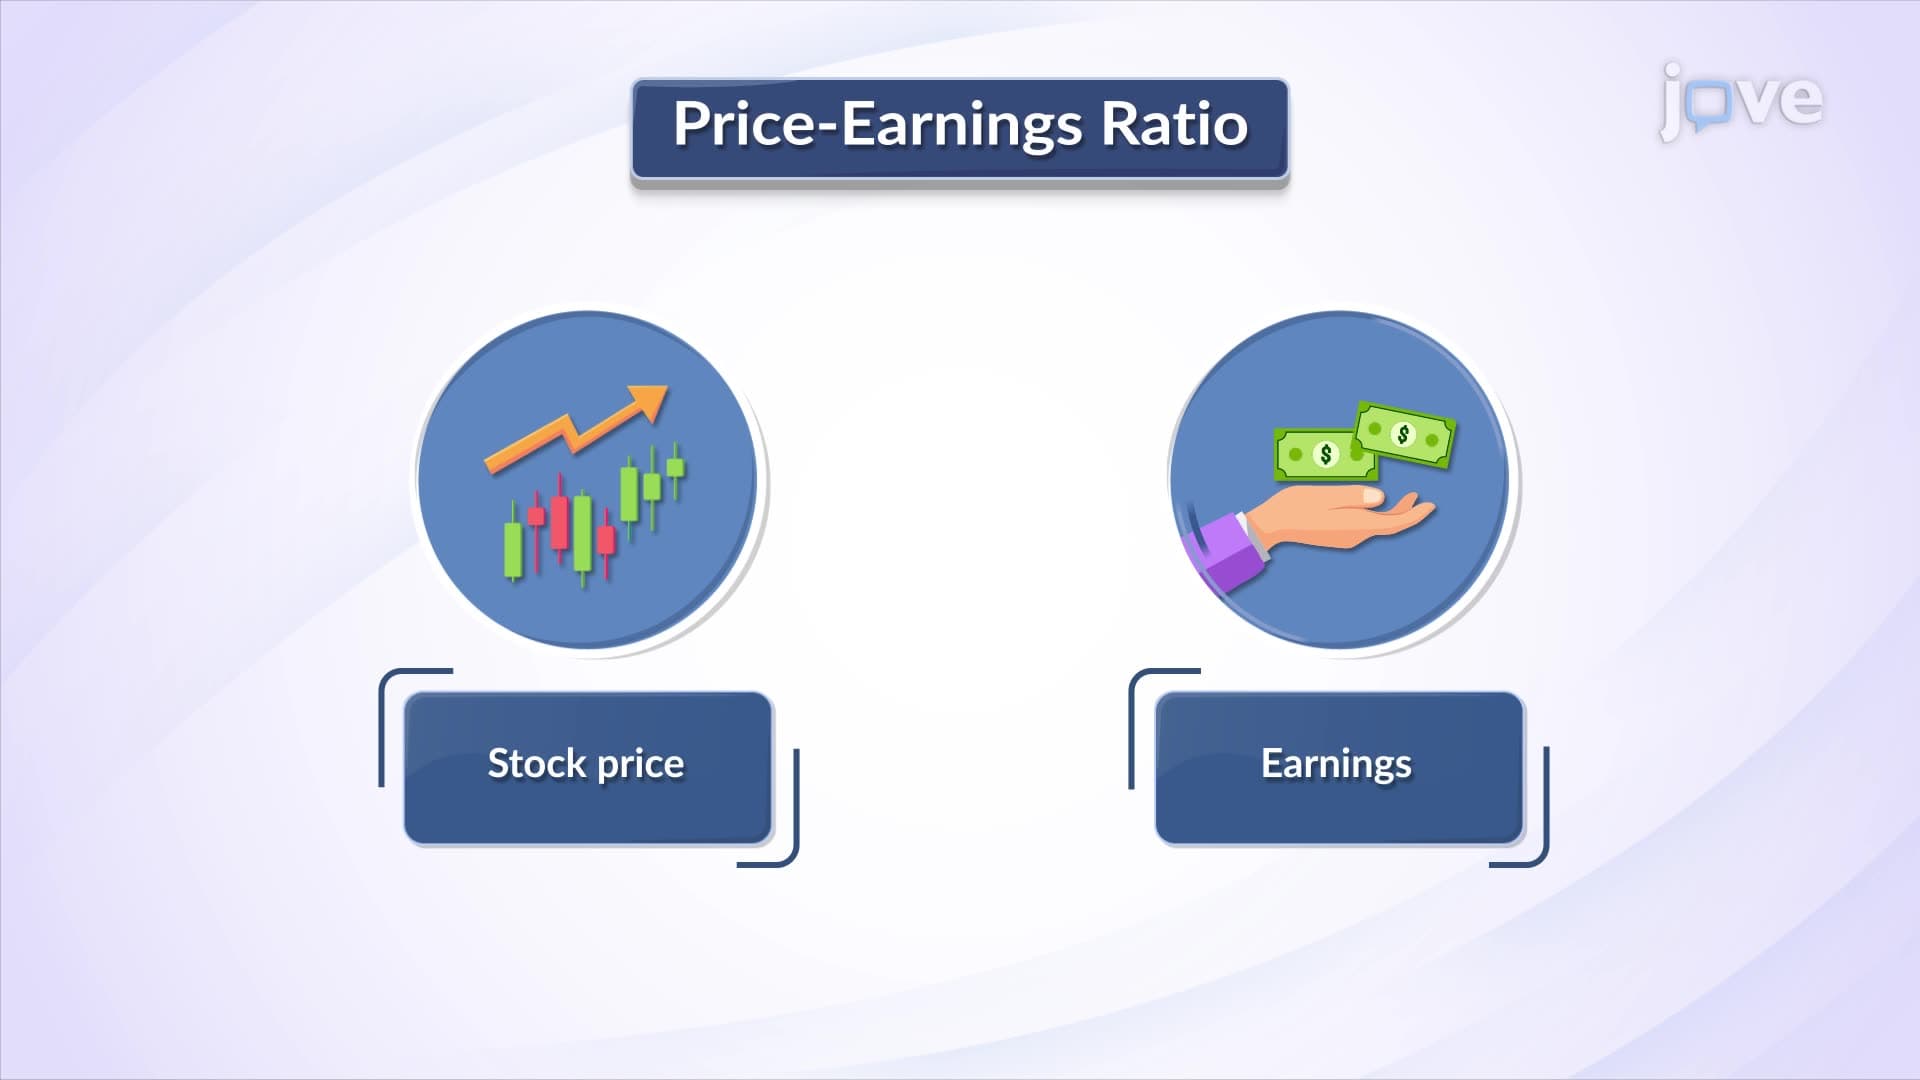
Return on assets (ROA) assesses how well leadership converts corporate resources into profits, particularly valuable for capital-intensive industries like manufacturing and utilities. Consider how Ford's ROA improvement from 1.2% to 4.8% between 2019-2022 signaled successful operational restructuring to investors and analysts. Return on capital employed (ROCE) provides insights into long-term value creation, while earnings per share (EPS) and price-earnings (P/E) ratios bridge internal performance with market valuation expectations.
Strategic Applications Across Business Functions
Finance teams leverage these ratios for budget allocation and performance tracking, while operations managers use margin analysis to optimize procurement and production efficiency. Marketing executives apply profitability insights to evaluate campaign ROI and pricing strategies, ensuring promotional investments generate sustainable returns rather than temporary revenue spikes.
Competitive Intelligence and Market Positioning
Leading organizations benchmark their profitability ratios against industry peers to identify competitive advantages and market positioning opportunities. When Microsoft consistently maintains operating margins above 35% while industry averages hover around 20%, this metric becomes a powerful tool for attracting top talent, securing favorable financing terms, and commanding premium market valuations.
Frequently Asked Questions
Net profit margin typically provides the most comprehensive view for strategic decisions as it captures all operational and financial factors. However, the optimal ratio depends on your specific business context-manufacturing firms often prioritize gross margin for operational insights, while service companies may focus on ROE for shareholder value creation.
Start by establishing baseline profitability metrics for each business unit or product line, then set improvement targets tied to specific operational initiatives. Use quarterly ratio analysis to track progress and adjust resource allocation, ensuring budget decisions support measurable profitability improvements rather than just revenue growth.
Include profitability ratio analysis in monthly financial reviews, quarterly board presentations, and annual strategic planning sessions. Focus on trend analysis and competitive benchmarking rather than standalone numbers-executives want to understand how ratios inform strategic decisions and market positioning.
Starbucks analyzes store-level profit margins and ROA to identify optimal locations and formats, comparing new market performance against established benchmarks. They use these metrics to determine which markets justify premium real estate investments and which require modified store formats to achieve target profitability levels.
Basic business acumen and financial statement familiarity are sufficient to apply profitability ratios effectively. Focus on understanding what drives each ratio and how changes impact business performance rather than memorizing complex calculations-most financial systems generate these metrics automatically.
Profitability ratio expertise demonstrates strategic thinking and business acumen that executives value across all functions. This skill set positions you for roles in business development, strategic planning, and general management while strengthening your credibility in budget discussions and performance evaluations.
Expand into liquidity and leverage ratio analysis to build comprehensive financial analysis capabilities. Understanding how profitability connects with cash flow management and capital structure decisions creates a complete framework for strategic business evaluation and risk assessment.
Monthly tracking provides optimal balance between actionable insights and resource efficiency. Supplement with weekly gross margin monitoring during peak seasons or major initiatives, and conduct comprehensive competitive benchmarking quarterly to maintain strategic perspective.
Related Micro-courses