Loading subject page…


348,602 views

Video Summary: What Is Measures of Central Tendency
Ever wonder how Netflix determines the "average" rating for a show when millions of users rate it differently? Measures of central tendency provide the statistical tools to find that single representative score from complex datasets. Whether analyzing SAT scores across American high schools or determining median household income in different states, these three fundamental measures-mean, median, and mode-help researchers summarize vast amounts of data into meaningful insights. Watch the full video on JoVE Coach to master this concept with expert-led visuals and step-by-step explanations.
Measures of central tendency serve as the foundation of descriptive statistics, providing researchers with tools to distill complex datasets into single, representative values. These measures are crucial for AP Statistics students, college research methods courses, and anyone working with quantitative data in fields ranging from psychology to business analytics.
The mode represents the most frequently occurring value in a dataset and proves particularly valuable when working with categorical variables. In educational settings, consider analyzing the most common college majors among graduating seniors at a typical American high school. If 150 students choose business, 120 select engineering, and 80 pick liberal arts, the mode is "business." This measure excels with nominal data where mathematical operations like averaging don't make logical sense-you can't calculate the "average" of red, blue, and green.
The median identifies the exact center point when data values are arranged in ascending order. For standardized test preparation, understanding median proves crucial. If SAT Math scores in a class are 480, 520, 540, 580, and 720, the median is 540-regardless of how extremely high or low the outer scores might be. With even-numbered datasets, calculate the median by averaging the two middle values. This measure resists the influence of outliers, making it ideal for income data, housing prices, and other variables prone to extreme values.
The arithmetic mean, calculated by summing all values and dividing by the number of observations, remains the most commonly reported measure in academic research and standardized testing. College GPA calculations exemplify this concept: if a student earns grades of 3.2, 3.7, 3.5, and 3.8 across four courses, their mean GPA equals 14.2 ÷ 4 = 3.55. However, the mean's sensitivity to outliers can create misleading representations, particularly in skewed distributions.
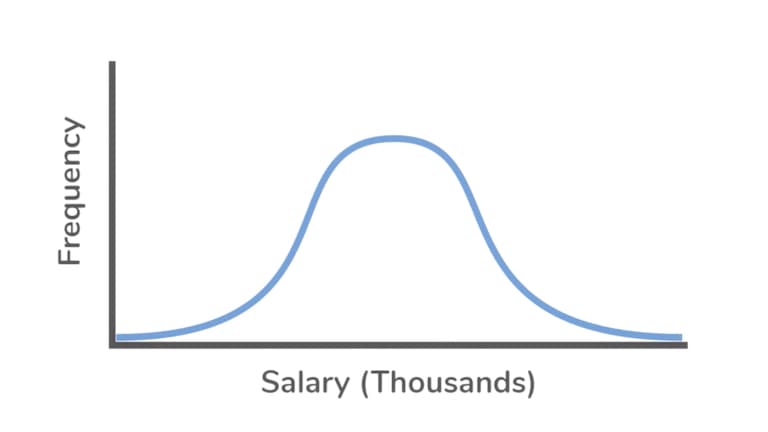
In perfectly normal distributions-the classic bell curve seen in IQ scores or height measurements-all three measures converge at the center. However, real-world data often exhibits skewness. Consider household income data from a wealthy neighborhood where most families earn $75,000-$95,000 annually, but a few tech executives earn over $500,000. Here, the mean might suggest $150,000 as "typical," while the median of $85,000 better represents the average family's experience. Understanding these nuances proves essential for MCAT statistics sections and college-level research methodology courses.
Related Micro-courses