Loading video…


 19 Concepts
 348.6K views

Video Summary: Normal Distribution Range and Standard Deviation
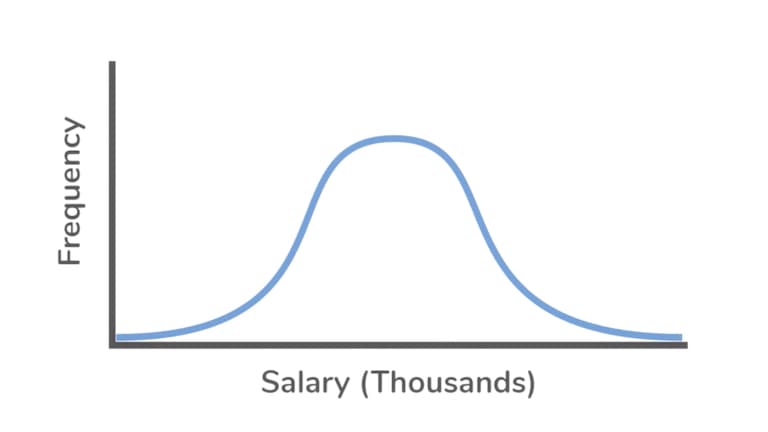
Why do 68% of American men fall within 2.5 inches of the average height? Understanding normal distribution: range and standard deviation reveals the mathematical patterns hidden in everyday measurements, from SAT scores to baseball batting averages. When students at Duke University collected height data from their campus, they discovered the classic bell curve where most measurements cluster around the mean, with fewer extreme values at the edges. This fundamental statistical concept explains how variation spreads in populations and why standard deviation provides more reliable insights than simple range calculations. Watch the full video on JoVE Coach to master this concept with expert-led visuals and step-by-step explanations.
Normal distribution: range and standard deviation form the cornerstone of statistical analysis in fields ranging from psychology to engineering. When data follows a normal distribution, it creates the familiar bell-shaped curve where most values cluster around the central mean, with progressively fewer observations appearing at the extremes. This pattern appears everywhere in nature and society-from students' AP Statistics exam scores to the weights of newborns in American hospitals.
The beauty of normal distribution lies in its predictable properties. Exactly 50% of all data points fall above the mean, and 50% fall below, creating perfect symmetry. This mathematical elegance makes normal distributions invaluable for making predictions and understanding population characteristics.
Range represents the most basic measure of data spread, calculated by subtracting the lowest value from the highest value in a dataset. If surveying heights of NBA players yields a shortest player at 5'7" and tallest at 7'2", the range equals 19 inches. While range provides a quick snapshot of data spread, it suffers from a critical weakness: extreme sensitivity to outliers.
Consider standardized test scores from a typical American high school. If 99 students score between 1000-1200 on the SAT, but one exceptional student scores 1580, the range jumps dramatically despite this single outlier not representing the broader population's performance. This limitation makes range useful for initial data exploration but insufficient for deeper statistical analysis.
Standard deviation overcomes range's limitations by measuring the average distance each data point sits from the mean. Unlike range, which only considers extreme values, standard deviation incorporates every single measurement in the dataset, providing a more comprehensive picture of data spread.
The calculation involves finding each data point's distance from the mean, squaring these distances to eliminate negative values, averaging the results, and taking the square root. While the mathematical process may seem complex, the interpretation remains straightforward: smaller standard deviations indicate data clustered tightly around the mean, while larger values suggest greater spread.
Normal distributions follow a remarkable pattern known as the empirical rule. Within one standard deviation of the mean, exactly 68% of all data points reside. This percentage increases to 95% within two standard deviations and 99.7% within three standard deviations.
American colleges leverage this principle when evaluating applicants. If the average SAT score equals 1050 with a standard deviation of 100 points, admissions officers know that 68% of test-takers scored between 950-1150, while 95% fell between 850-1250. This knowledge helps institutions set realistic admission standards and understand applicant pool competitiveness.
Medical professionals apply similar logic when interpreting lab results, determining whether patient values fall within normal ranges or warrant further investigation.
Related Micro-courses