Loading…
Loading video…

13,330 views
Did you know that 68% of Americans report sleep problems, yet traditional statistical tests can't properly analyze mattress preference rankings? Friedman two way analysis of variance offers a powerful solution for comparing related groups when data doesn't meet normal distribution requirements. This non-parametric test ranks responses within each condition, making it perfect for analyzing ordinal data like customer satisfaction ratings across different products. For instance, when sleep researchers at Stanford University compared three mattress brands using the same participants, they used this method to detect significant differences in sleep quality ratings. Watch the full video on JoVE Coach to master this concept with expert-led visuals and step-by-step explanations.
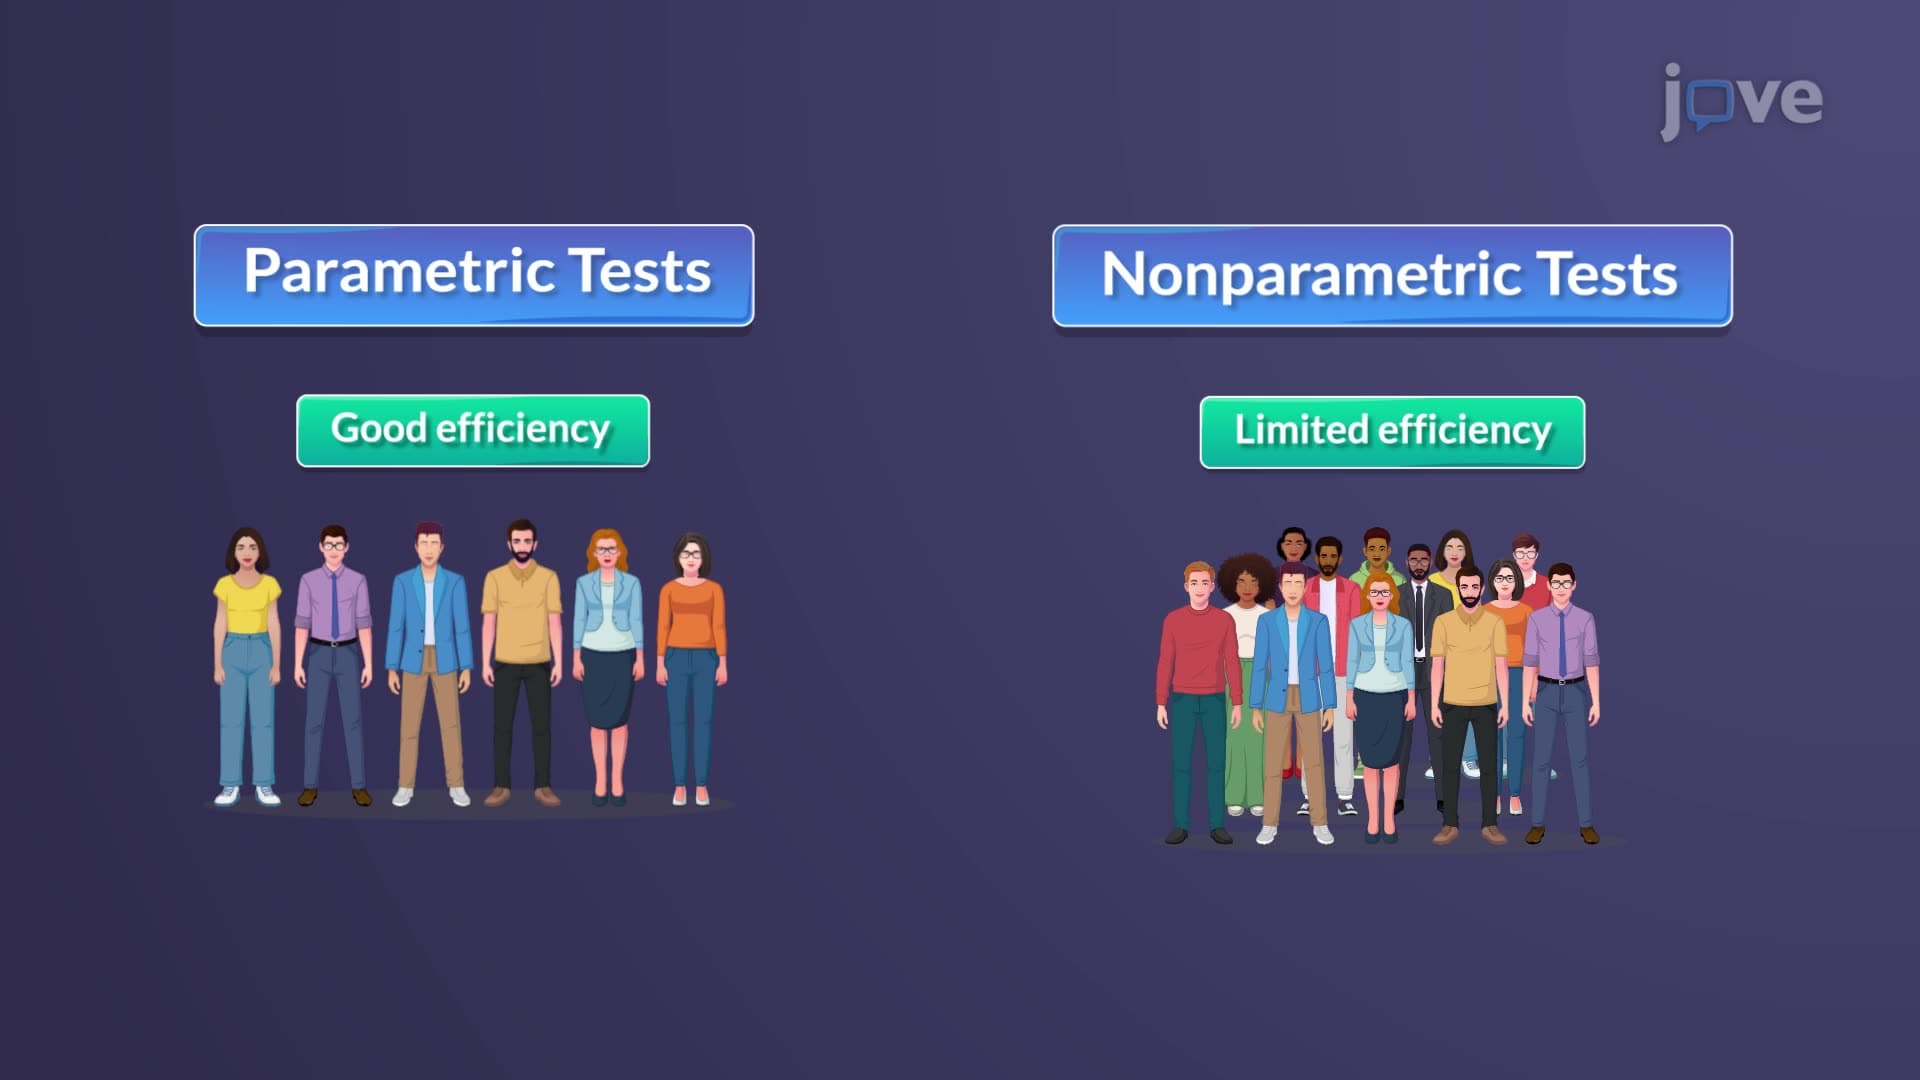
The Friedman Two Way Analysis of Explained serves as a cornerstone non-parametric statistical method for researchers who encounter ordinal data or violations of ANOVA assumptions. Unlike traditional Analysis of Variance, which requires normally distributed data and equal variances, the Friedman test operates on ranks rather than raw scores, making it exceptionally robust for real-world applications.
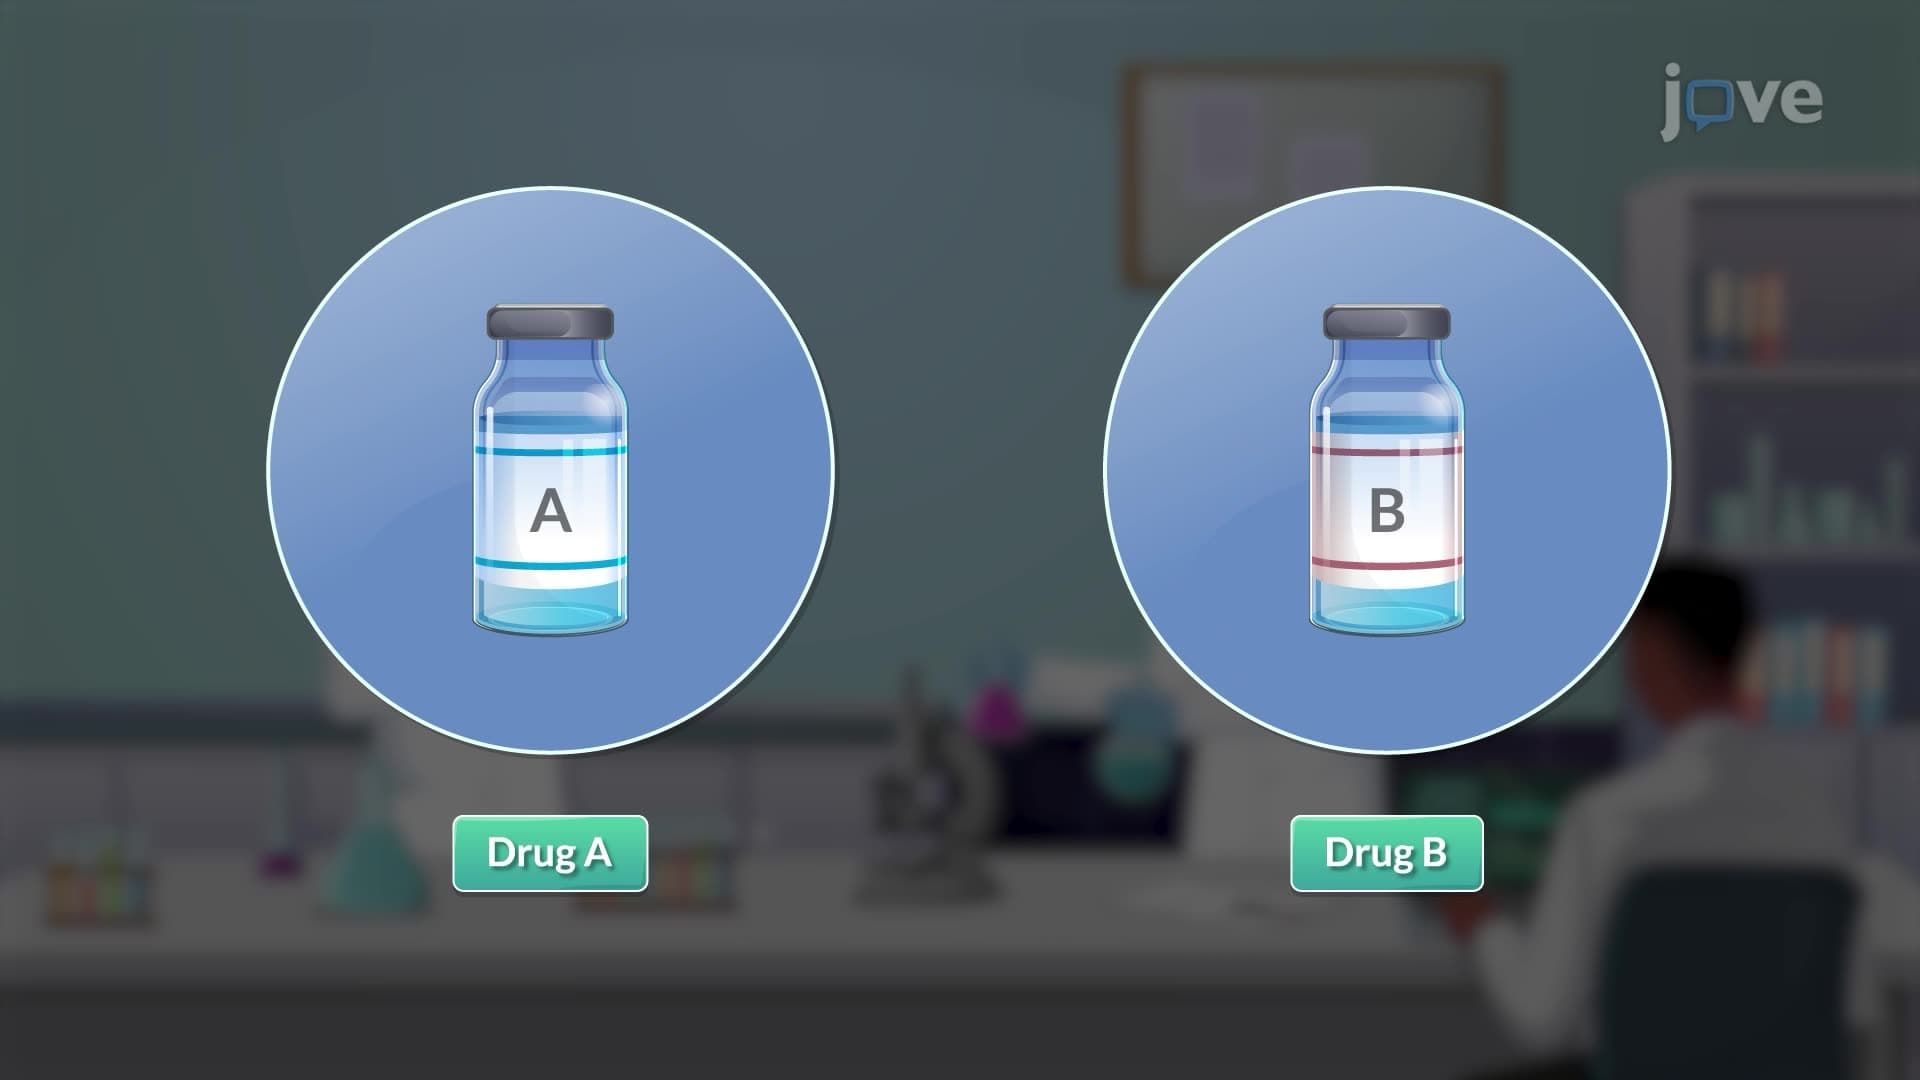
Consider a pharmaceutical company testing three pain medications using the same patients over different time periods. Patient pain ratings on a 1-10 scale represent ordinal data that rarely follows normal distribution patterns. Traditional ANOVA would be inappropriate here, potentially leading to incorrect conclusions about drug effectiveness. The Friedman test transforms these ratings into ranks within each patient, preserving the relative ordering while eliminating distribution concerns.
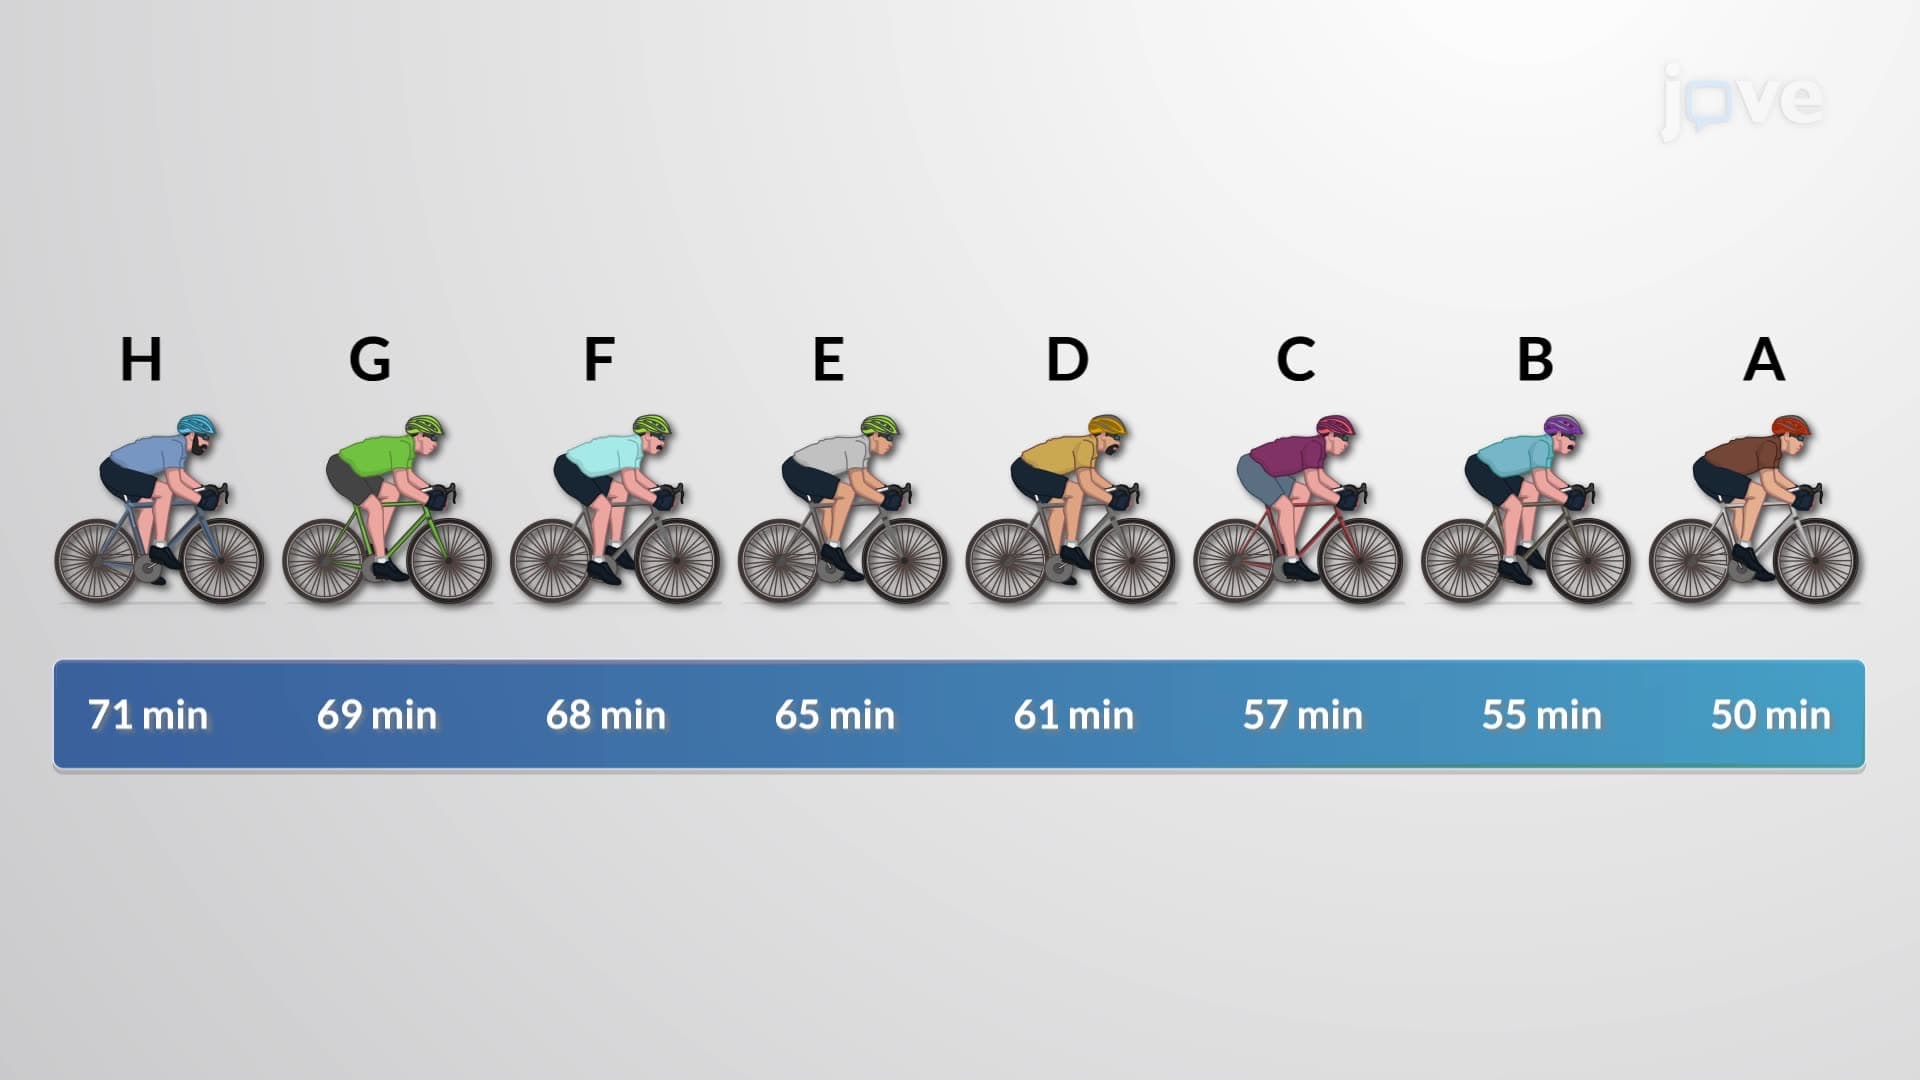
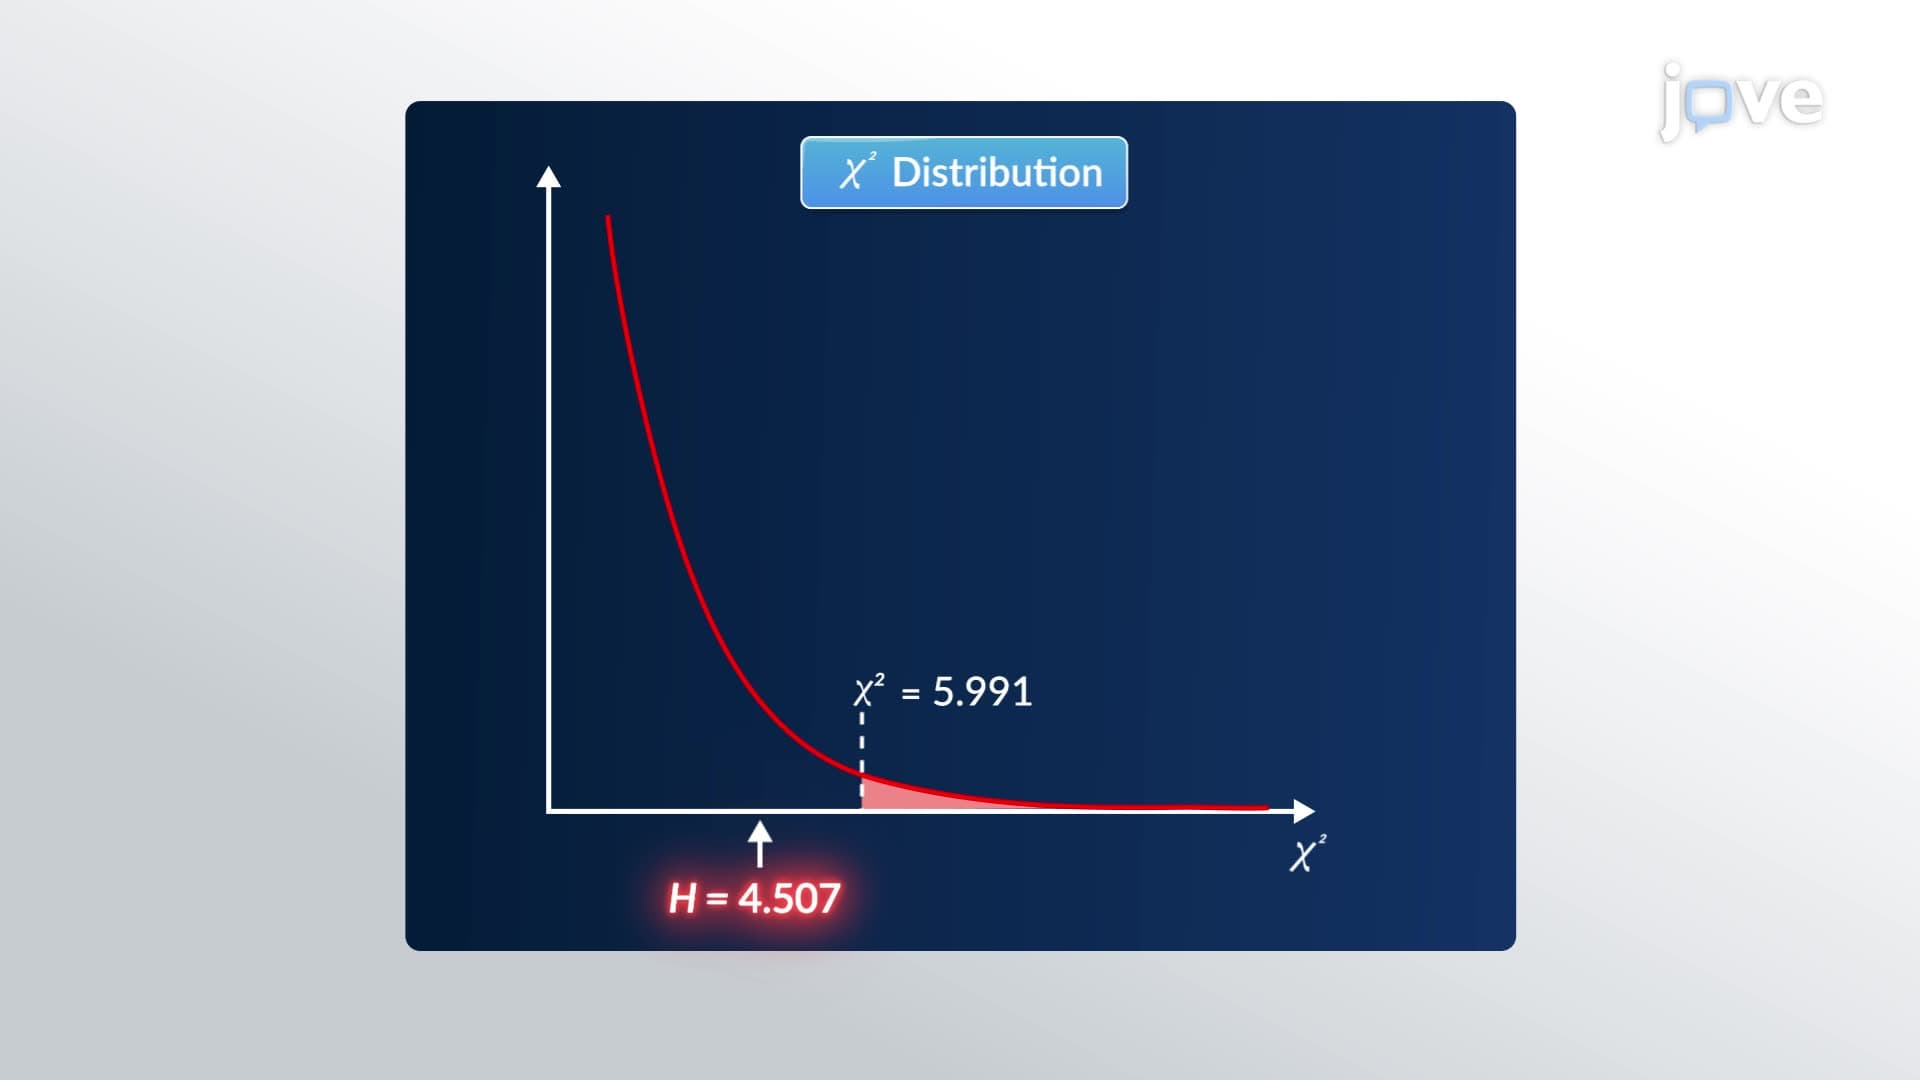
The test's power lies in its systematic ranking approach. For each participant (or block), responses across all conditions receive ranks from 1 to k (where k equals the number of conditions). These ranks then undergo statistical analysis using the Friedman test statistic: Chi-square = [12/(n×k×(k+1))] × Σ(Rank sums)² - 3×n×(k+1), where n represents the number of subjects and k represents the number of conditions.
Market research firms frequently employ this method when analyzing consumer preference rankings across multiple products. For instance, Nielsen Holdings uses similar approaches when evaluating television show preferences among demographic groups. In clinical settings, medical researchers at institutions like Mayo Clinic apply Friedman tests to analyze treatment effectiveness ratings across multiple time points, ensuring robust conclusions despite ordinal measurement scales.
Students preparing for AP Statistics or college-level research methods courses will encounter this test as a crucial alternative to parametric methods. The Friedman test appears regularly on MCAT psychology sections and forms essential knowledge for psychology majors planning graduate research. Understanding when and how to apply non-parametric tests demonstrates statistical sophistication that admissions committees and employers value highly.
Frequently Asked Questions
Friedman Two Way Analysis of is a non-parametric statistical test that compares three or more related groups using ranks instead of raw scores. Use it when your data is ordinal (like satisfaction ratings), when sample sizes are small, or when data doesn't meet ANOVA's normal distribution requirements. It's particularly valuable for repeated measures designs with ranking-based outcomes.
Yes, the Friedman test commonly appears in AP Statistics curricula and college-level statistics courses as part of non-parametric methods. Many universities include it in psychology research methods courses, and it frequently shows up on MCAT psychology sections. Understanding when to choose non-parametric tests demonstrates advanced statistical thinking that exam graders value.
The Friedman test proves invaluable for undergraduate research involving surveys, preference studies, or repeated measures with ordinal data. Psychology majors analyzing therapy effectiveness ratings, business students evaluating product preferences, or pre-med students conducting clinical research often find traditional ANOVA inappropriate for their data types. This test provides a statistically sound alternative that maintains research integrity.
Absolutely! Companies like Amazon, Starbucks, and major hotel chains use similar methods to analyze customer satisfaction across multiple service dimensions or time periods. When customers rate different aspects of service on scales (like 1-5 stars), the Friedman test can detect which areas show significantly different satisfaction levels, guiding business improvement decisions.
The Friedman test is actually more intuitive than many parametric tests because it works with ranks rather than complex mathematical assumptions. If you can rank items from best to worst, you already understand the core concept. Most high school students grasp the ranking process quickly, making this an accessible entry point into non-parametric statistics.
Practice identifying scenarios where non-parametric tests are appropriate, focusing on ordinal data and assumption violations. Create flashcards contrasting when to use Friedman versus ANOVA. Work through step-by-step ranking examples using real datasets. Many students find success by memorizing the key phrase: "ordinal data or assumption violations = consider Friedman."
Explore other non-parametric tests like the Kruskal-Wallis test for independent groups and Wilcoxon signed-rank test for paired comparisons. Understanding the broader family of rank-based statistics strengthens your analytical toolkit. Advanced students might investigate post-hoc testing procedures for significant Friedman results, preparing for graduate-level research methodology.
Related Micro-courses
Related Subjects
 Physics 33 micro-courses›
 Math Fundamentals 11 micro-courses›