Loading subject page…


53,059 views

Video Summary: What Is H Nmr Signal Integration
Ever wonder how chemists at pharmaceutical companies like Pfizer determine exactly how many hydrogen atoms are in a new drug molecule? NMR signal integration explained through the analysis of peak areas reveals the precise number of protons contributing to each signal in a spectrum. For instance, when analyzing aspirin synthesis at Johns Hopkins University, researchers use What is H NMR Signal Integration to confirm the correct 2:3:4 proton ratio in their product. This quantitative technique transforms mysterious peaks into definitive molecular fingerprints. Watch the full video on JoVE Coach to master this concept with expert-led visuals and step-by-step explanations.
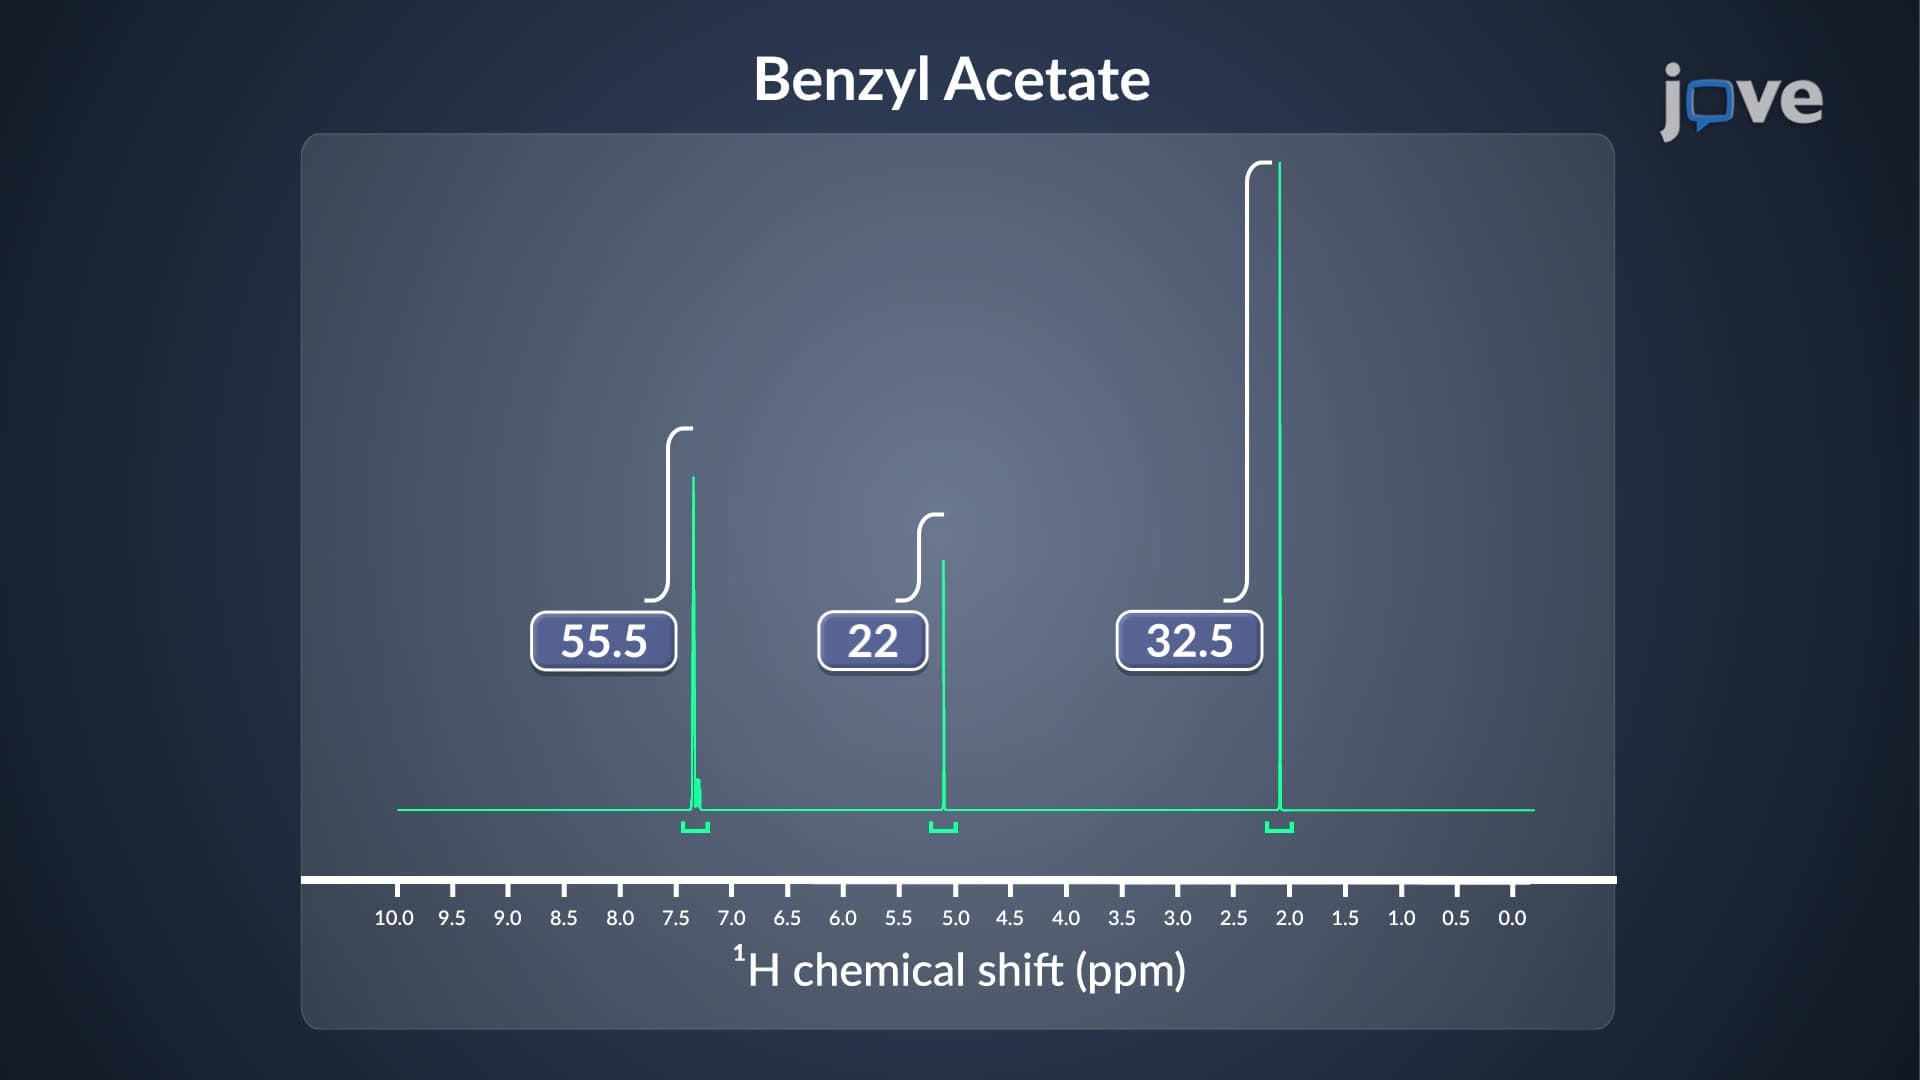
What is H NMR Signal Integration represents one of the most powerful quantitative tools in analytical chemistry. Unlike simple peak identification, integration measures the actual area under each NMR signal, which directly correlates to the number of hydrogen atoms producing that signal. This relationship exists because each proton contributes equally to the total signal intensity, making NMR uniquely quantitative among spectroscopic methods.
The integration process involves sophisticated mathematical algorithms that calculate areas beneath peaks, accounting for baseline variations and peak overlap. Modern NMR instruments display these calculations as integral curves-step-like lines that rise proportionally to the area under each peak. Students preparing for the MCAT or AP Chemistry exams must understand that these integral values provide relative, not absolute, proton counts.
H NMR integration proton counting begins with identifying the smallest integral value in the spectrum, then dividing all other integrals by this number. For example, if integral values are 15.6, 31.2, and 46.8, dividing by 15.6 yields 1:2:3. This mathematical approach eliminates instrument variations and sample concentration effects.
Students at universities like MIT and Stanford learn to round these ratios intelligently. A calculated ratio of 1.9:3.1:1.0 clearly represents 2:3:1, not fractional protons. However, ratios like 1.5:2.5:1.0 might indicate overlapping signals or impurities, requiring careful spectral analysis.
How to use NMR signal integration becomes crucial when distinguishing between structural isomers. Consider analyzing samples from Dow Chemical's research labs: ethyl acetate and methyl propanoate both have molecular formula C4H8O2 but show different integration patterns. Ethyl acetate displays a 3:2:3 pattern, while methyl propanoate shows 3:2:3 with different chemical shifts.
Integration analysis proves invaluable for purity assessment in pharmaceutical manufacturing. FDA guidelines require quantitative NMR for drug substance characterization, where integration ratios confirm molecular identity and detect impurities below 1% concentration levels.
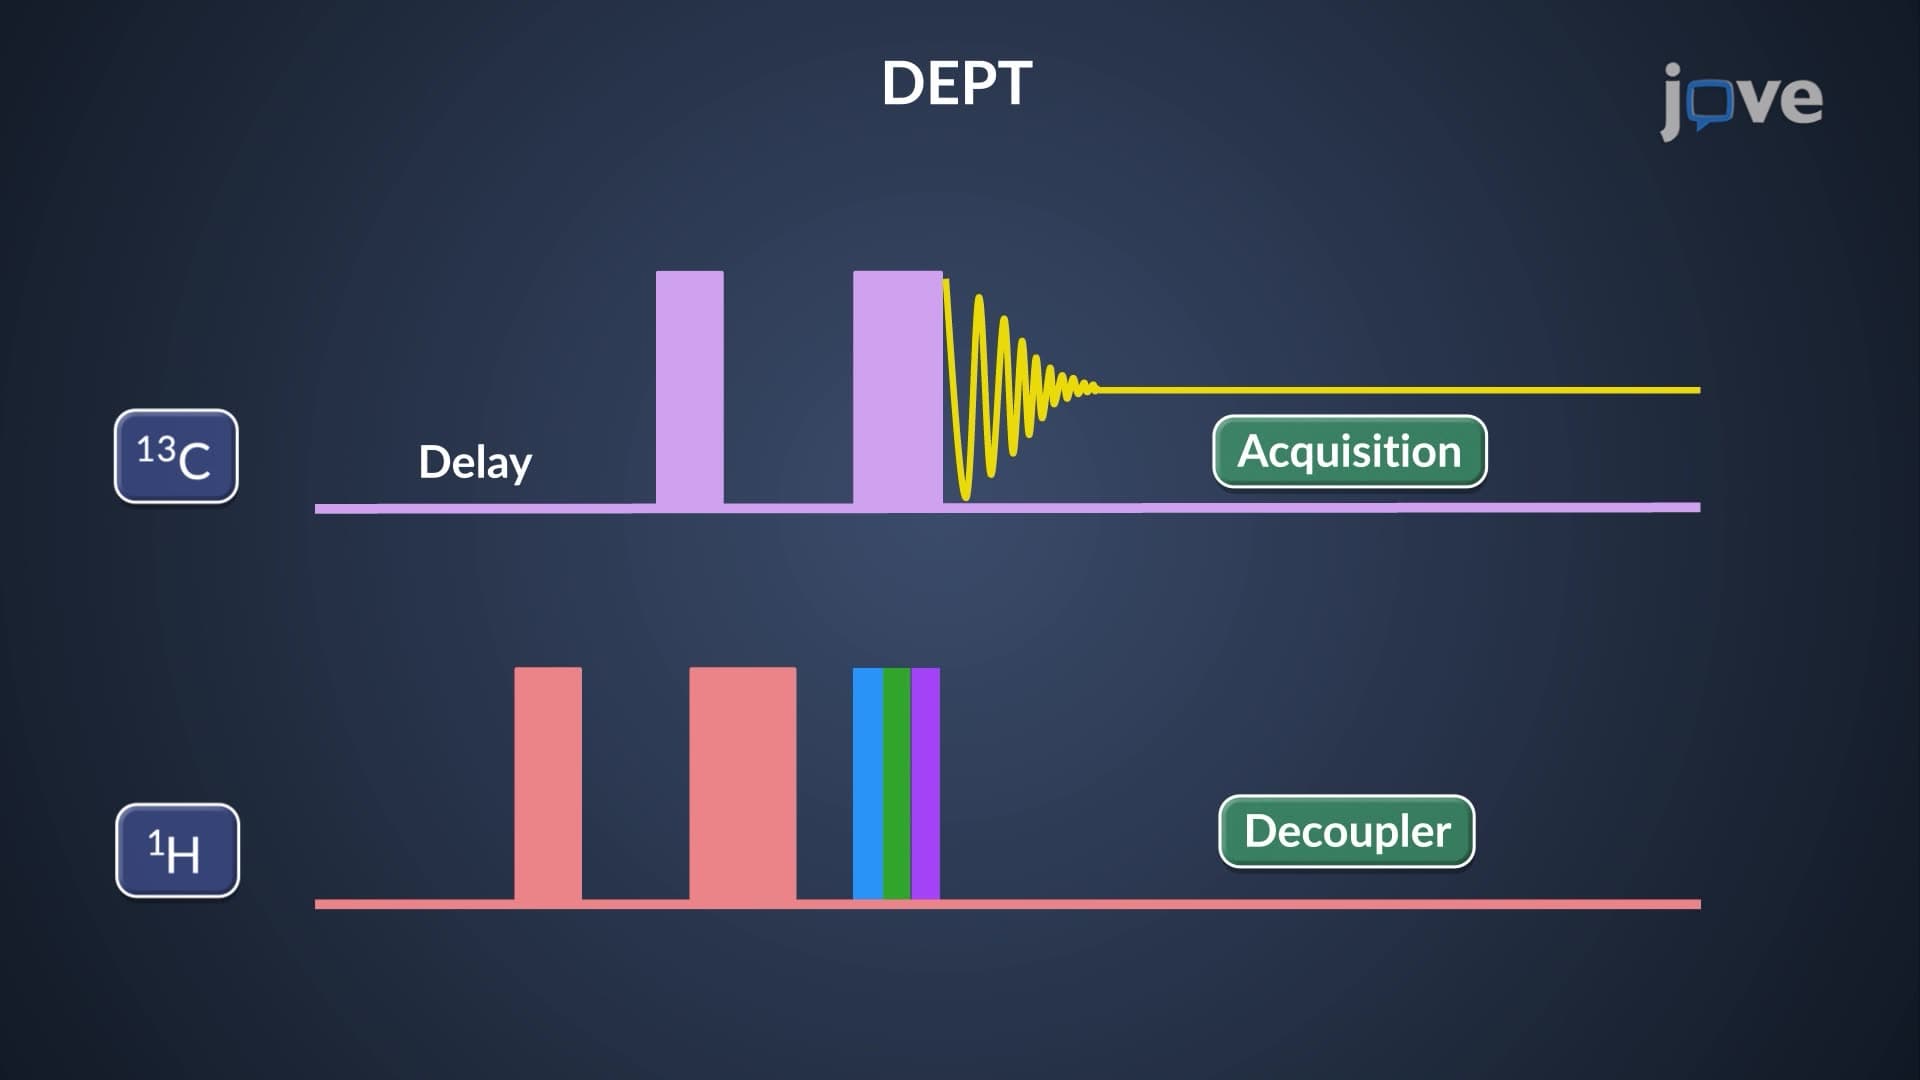
Quantitative NMR integration demands careful attention to experimental parameters. Students preparing for organic chemistry midterms at schools like UC Berkeley learn that inadequate relaxation delays can skew integration values, particularly for quaternary carbons attached to protons. Proper pulse sequences and timing ensure accurate quantification.
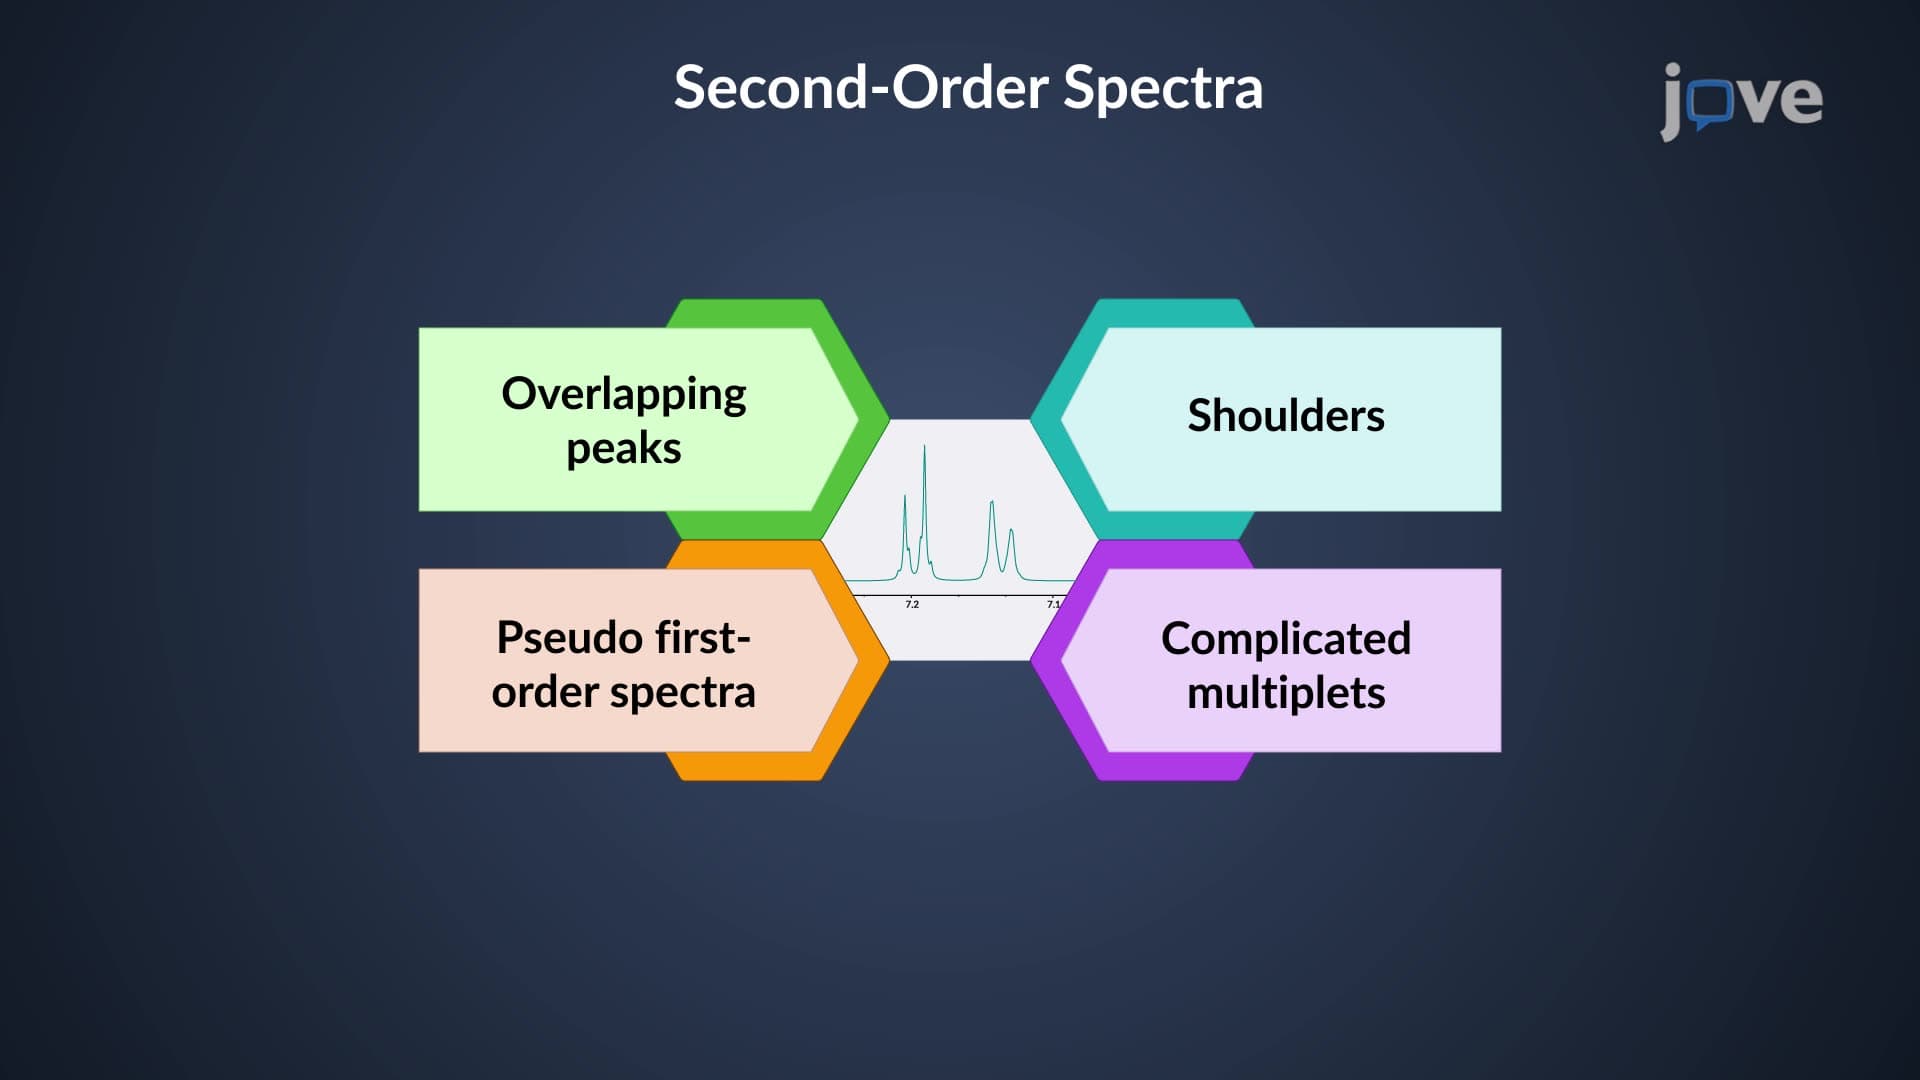
Common integration challenges include overlapping peaks and spinning sidebands. Modern processing software allows peak deconvolution, separating overlapping signals for accurate integration. Understanding these limitations helps students interpret complex spectra encountered in advanced coursework and research projects.
Related Micro-courses