Loading subject page…

- Finance
- Financial Ratio Analysis
- Activity Ratios: Fixed Asset Turnover Ratio
Micro-course: Financial Ratio Analysis
5,238 views
Learn key concepts and earn your certificate.








Activity Ratios: Fixed Asset Turnover Ratio


00:00
01:17
Video Summary: Activity Ratios Fixed Asset Turnover Ratio Explained
Activity ratios fixed asset turnover analysis has become critical as companies like Amazon invest billions in warehouses and fulfillment centers while maintaining razor-thin margins. This Activity Ratios Fixed Asset Turnover Ratio Explained framework helps finance professionals evaluate whether heavy capital investments actually drive proportional revenue growth. Manufacturing giants like General Electric use this metric to benchmark operational efficiency across divisions, while private equity firms rely on it for acquisition due diligence. Watch the full video on JoVE Coach to master this concept with expert-led visuals and step-by-step explanations.
- Apply fixed asset turnover calculations to evaluate capital allocation decisions during budget planning and strategic reviews
- Analyze competitor efficiency by comparing fixed asset utilization ratios within your industry sector
- Evaluate potential acquisition targets by assessing their ability to generate revenue from existing infrastructure investments
- Implement benchmarking frameworks to identify underperforming business units or operational inefficiencies
- Compare asset-heavy versus asset-light business models when developing competitive strategies
- Leverage turnover ratio trends to forecast future capital expenditure requirements and ROI projections
- Identify red flags in financial statements that indicate poor asset management or declining operational performance
- Assess the financial health of suppliers, partners, or investment opportunities using standardized efficiency metrics
Understanding Fixed Asset Turnover in Strategic Context
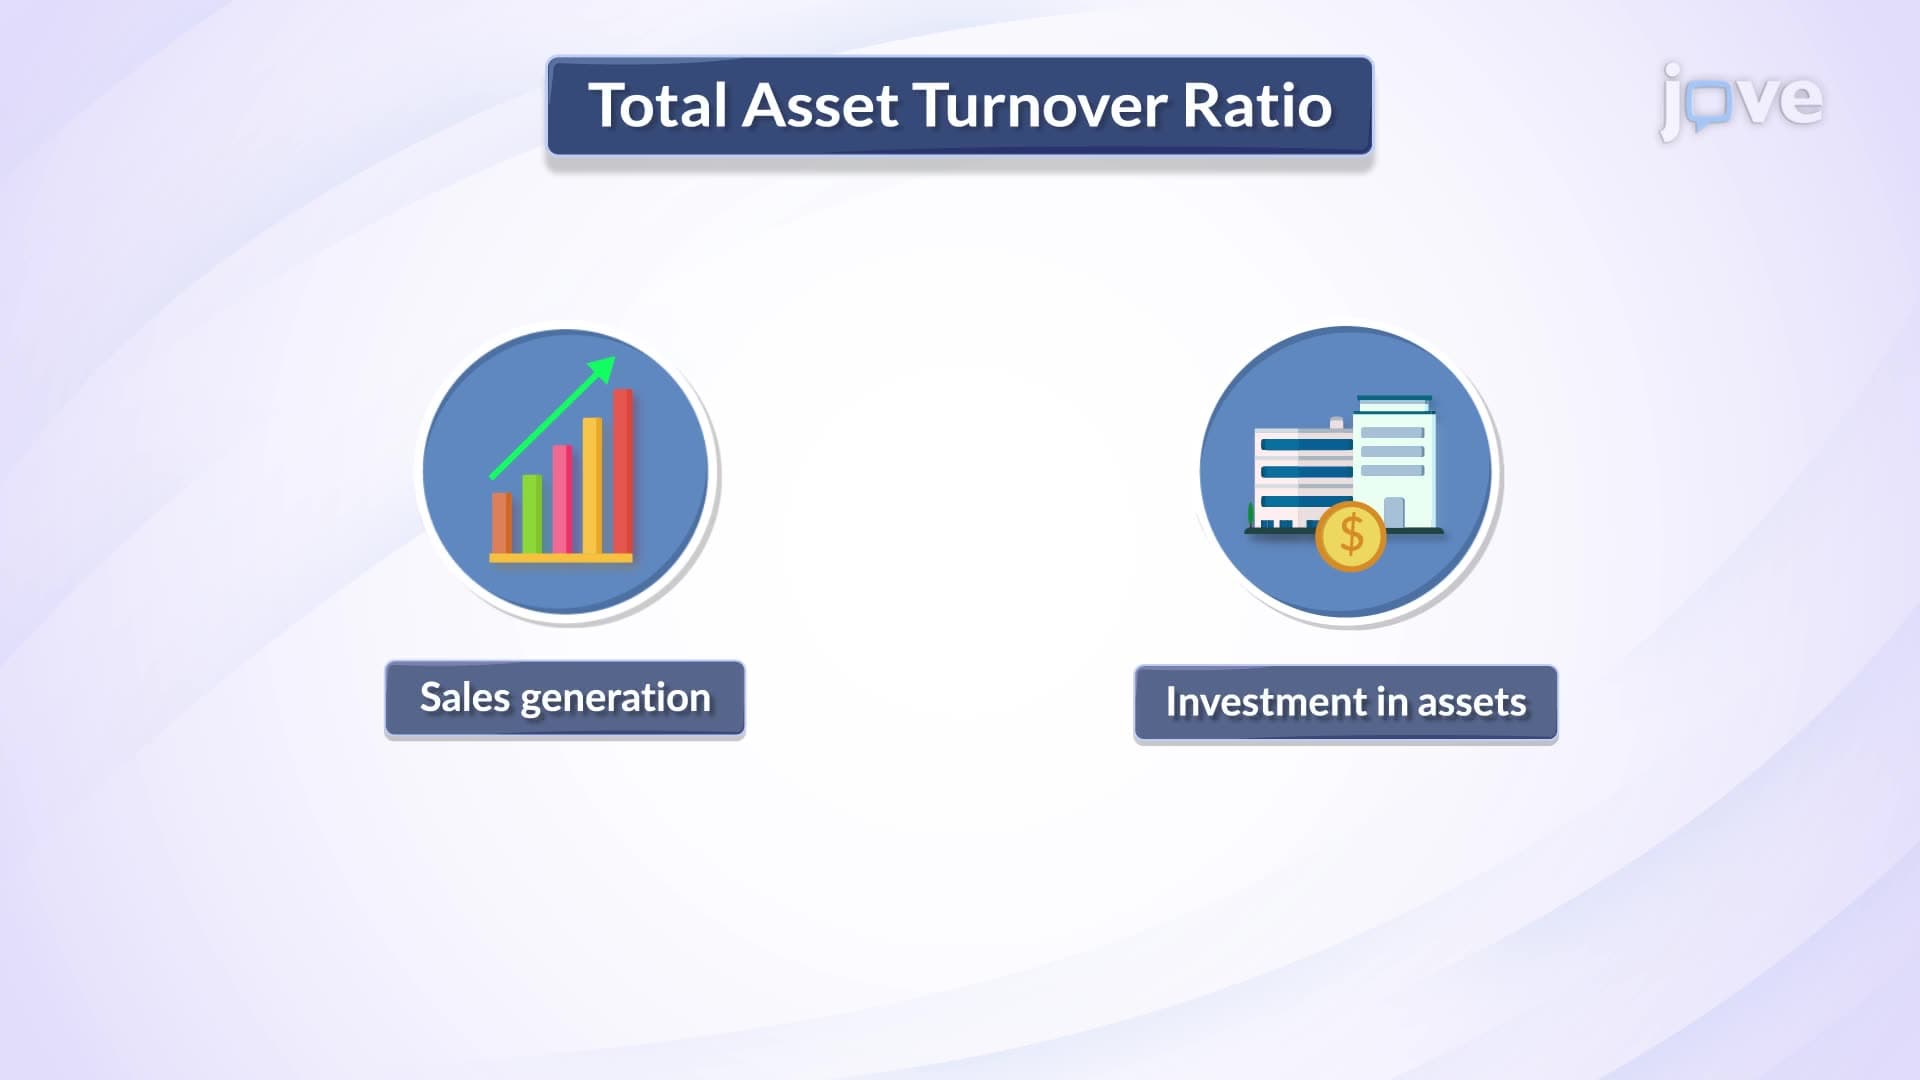
When Walmart's leadership evaluates store expansion versus e-commerce investment, they're fundamentally asking: which approach generates more sales per dollar of fixed assets? The activity ratios fixed asset turnover ratio concept provides the analytical framework for these high-stakes decisions. This metric reveals how efficiently management converts long-term investments-buildings, equipment, technology infrastructure-into revenue streams.
Calculation and Interpretation Framework
The fixed asset turnover ratio formula: Net Sales ÷ Average Fixed Assets. Consider Ford Motor Company's 2023 performance: with approximately $156 billion in net sales and roughly $62 billion in average fixed assets, Ford achieved a ratio of 2.5. This means every dollar invested in manufacturing plants, equipment, and facilities generated $2.50 in sales revenue.
Average fixed assets smooth out seasonal fluctuations and major capital expenditures by using (Beginning Fixed Assets + Ending Fixed Assets) ÷ 2. This approach provides more accurate trend analysis than point-in-time calculations.
Industry Context and Competitive Benchmarking
Asset turnover ratios vary dramatically across sectors. Technology companies like Microsoft achieve ratios above 5.0 due to their asset-light software model, while utilities typically range from 0.3 to 0.7 given massive infrastructure requirements. Manufacturing companies generally target ratios between 1.5 and 3.0, with higher ratios indicating superior operational efficiency.
Smart managers use peer comparison to identify competitive advantages or operational gaps. If your manufacturing division shows a 1.2 ratio while industry leaders maintain 2.0+, it signals potential for significant performance improvement through better asset utilization, capacity optimization, or strategic divestiture of underperforming facilities.
Strategic Applications for Business Leaders
Portfolio managers use these ratios to evaluate acquisition targets and identify operational synergies. Private equity firms particularly focus on companies with declining ratios, seeing opportunities to unlock value through operational improvements, facility consolidation, or strategic asset sales.
Frequently Asked Questions
It measures how many dollars of sales your company generates for every dollar invested in long-term assets like buildings, equipment, and machinery. Higher ratios indicate more efficient use of capital investments. This metric helps executives evaluate whether their fixed asset investments are paying off through increased revenue generation.
Compare your current ratio against industry benchmarks to justify capital expenditure requests or identify cost-cutting opportunities. If your ratio is declining, it may signal overcapacity or inefficient asset utilization requiring immediate attention. Use trend analysis to predict future capital needs and ROI expectations for proposed investments.
Watch for consistent year-over-year declines, ratios significantly below industry peers, or sudden drops following major capital investments. These patterns often indicate poor asset management, market share erosion, or strategic missteps. Consider conducting asset utilization audits and benchmarking studies to identify improvement opportunities.
Amazon's fixed asset turnover exceeds many retailers because they optimize warehouse utilization through advanced logistics technology and multi-client fulfillment services. Their facilities generate revenue not just from direct sales but also from third-party seller storage and shipping services. This multi-revenue stream approach maximizes return on infrastructure investments.
No specialized accounting knowledge required-basic financial statement literacy suffices. Focus on understanding the business logic: efficient companies extract more sales from their asset base. Most financial reporting systems can automatically calculate these ratios, allowing you to concentrate on strategic interpretation and competitive analysis rather than mathematical computations.
Demonstrates financial acumen crucial for senior management roles, particularly in operations, strategy, and general management positions. Shows ability to evaluate capital allocation decisions, assess operational efficiency, and identify improvement opportunities. These skills are essential for P&L responsibility and executive-level strategic planning roles.
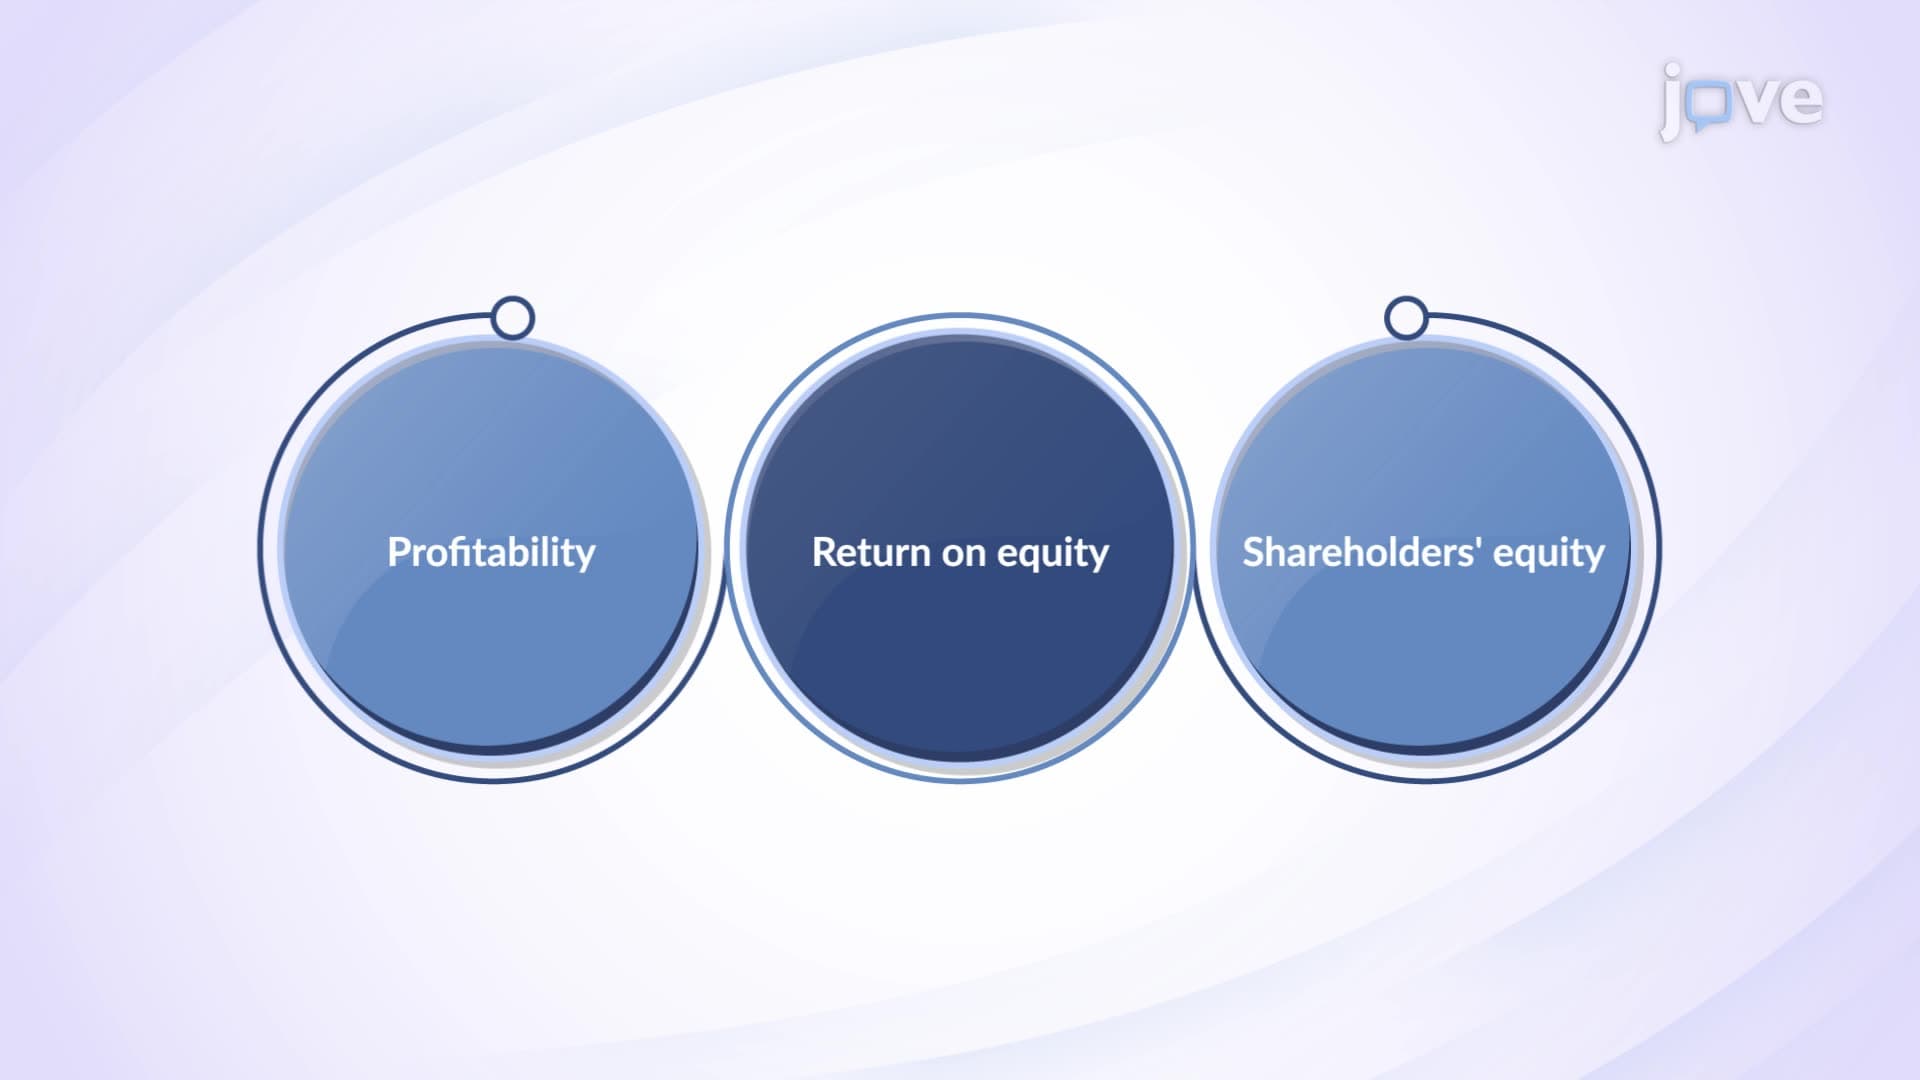
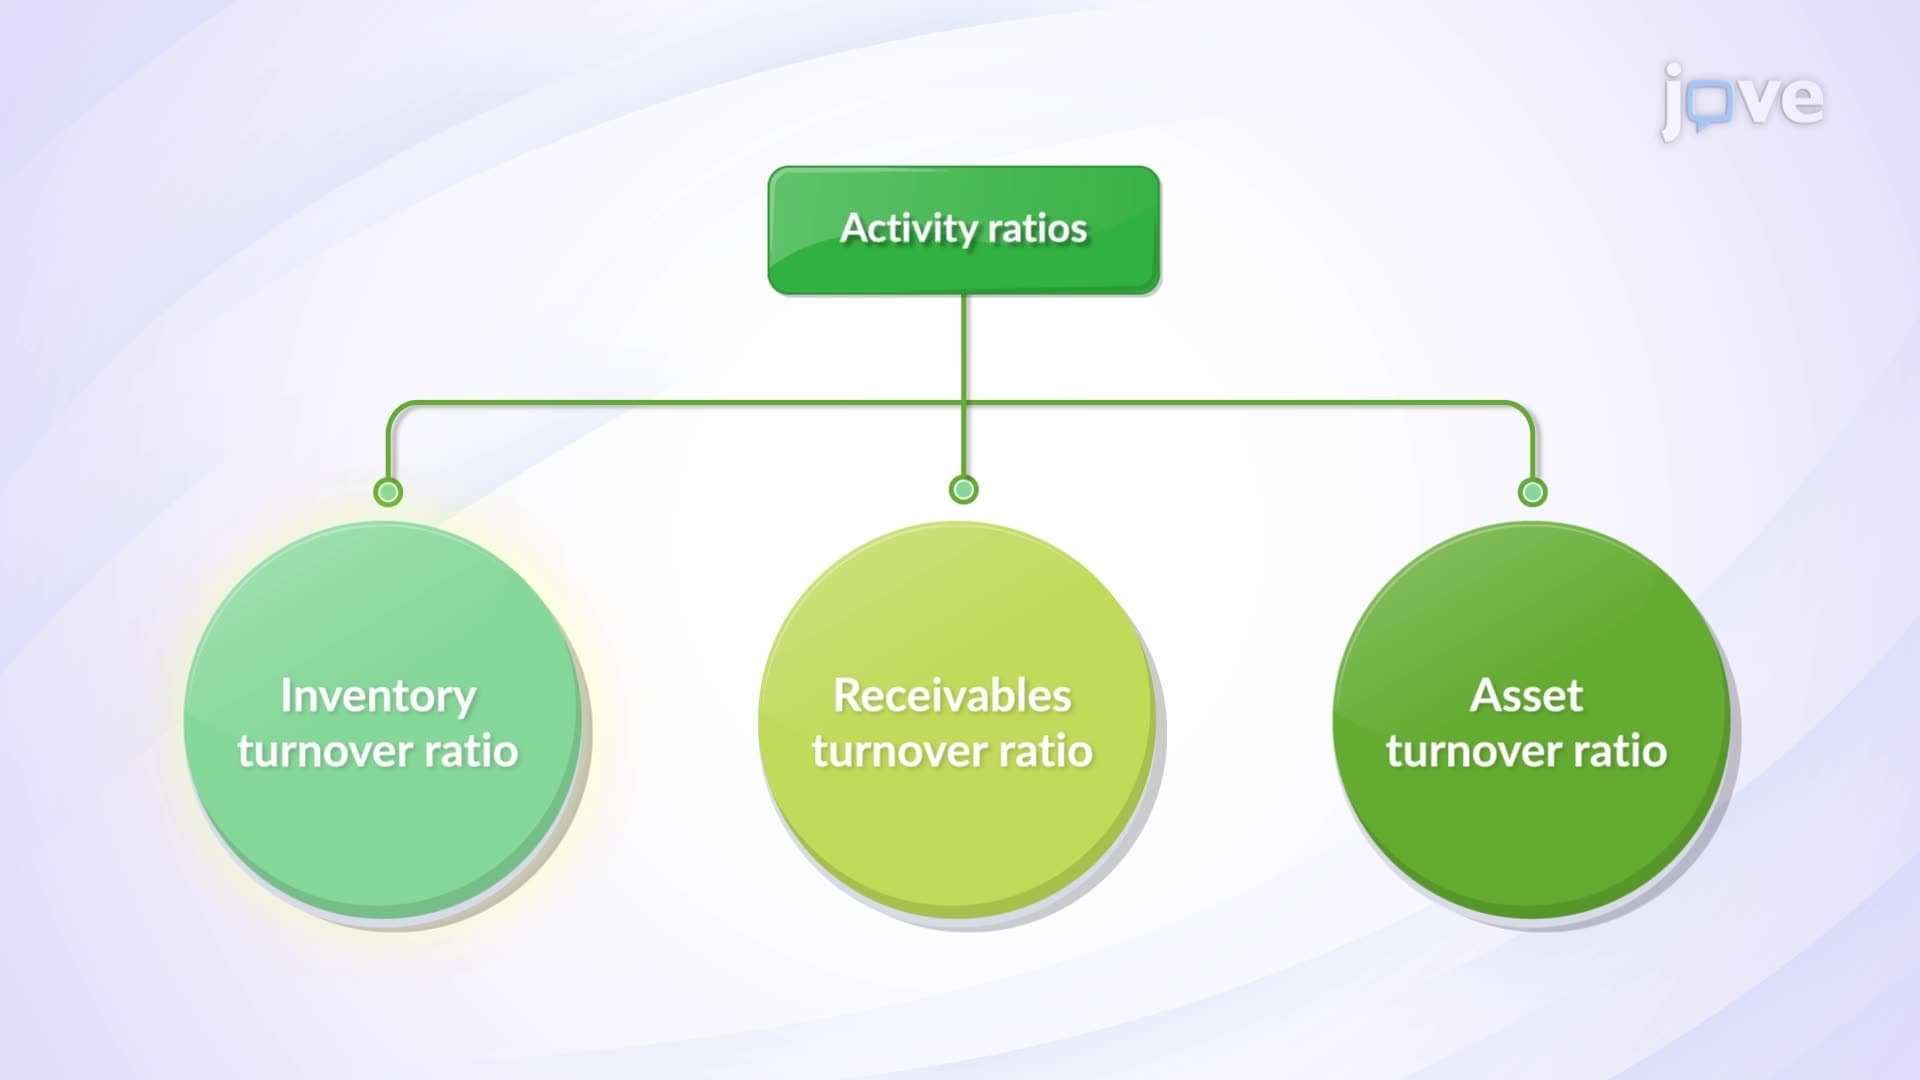
Study inventory turnover and accounts receivable turnover to complete your understanding of activity ratios, then progress to DuPont analysis for comprehensive financial performance evaluation. Understanding how asset turnover connects to overall return on equity provides deeper insights into company profitability drivers and strategic positioning.
Related Micro-courses