Loading subject page…

- Finance
- Financial Ratio Analysis
- Activity Ratios: Total Asset Turnover Ratio
Micro-course: Financial Ratio Analysis
5,239 views
Learn key concepts and earn your certificate.







Activity Ratios: Total Asset Turnover Ratio

00:00
01:24
Video Summary: Activity Ratios Total Asset Turnover Ratio Explained
Activity ratios total asset turnover analysis has become critical for CFOs and analysts evaluating operational efficiency amid rising capital costs. When Amazon achieves a 1.6x total asset turnover ratio compared to traditional retailers at 2.5x, it signals strategic trade-offs between asset-heavy infrastructure investments and revenue generation velocity. The Activity Ratios Total Asset Turnover Ratio Explained framework helps executives assess whether their asset utilization strategies align with industry benchmarks and shareholder expectations. Watch the full video on JoVE Coach to master this concept with expert-led visuals and step-by-step explanations.
- Evaluate asset efficiency performance by calculating total asset turnover ratios to identify operational bottlenecks and capital allocation opportunities
- Compare your company's asset utilization against industry leaders to benchmark competitive positioning and identify strategic gaps
- Analyze the relationship between asset turnover ratios and profit margins to optimize the balance between efficiency and profitability
- Apply total asset turnover metrics in budget planning and capital expenditure decisions to maximize return on invested capital
- Assess acquisition targets by examining their asset turnover ratios to evaluate operational synergies and integration potential
- Implement asset turnover monitoring systems to track quarterly performance trends and identify early warning signals
- Leverage industry-specific turnover benchmarks to set realistic performance targets and communicate strategic priorities to stakeholders
- Identify asset-light business model opportunities that can improve turnover ratios without sacrificing market share or customer satisfaction
Understanding Total Asset Turnover in Strategic Context
Asset efficiency has emerged as a critical differentiator in today's capital-constrained environment. While traditional financial metrics focus on profitability, savvy executives recognize that activity ratios total asset performance reveals operational DNA-how effectively management converts invested capital into revenue streams.
The Strategic Formula: Net Sales ÷ Average Total Assets
The total asset turnover calculation appears deceptively simple: divide net sales by average total assets. However, the strategic implications run deep. When Walmart generates $2.40 in sales for every dollar of assets while Target achieves $1.90, this 26% efficiency gap translates to billions in competitive advantage. The "average" component smooths seasonal fluctuations, using (Beginning Assets + Ending Assets) ÷ 2 to provide meaningful period comparisons.
Industry Context and Competitive Benchmarking
Asset-intensive industries like utilities and manufacturing typically show lower ratios (0.3-0.8x) due to heavy infrastructure requirements, while asset-light service companies often exceed 2.0x. Technology giants like Microsoft achieve ratios above 0.6x despite massive data center investments, demonstrating how digital scalability transforms traditional asset economics. Understanding these sector dynamics prevents misguided comparisons that could derail strategic planning.
Executive Decision-Making Applications
For portfolio managers, total asset turnover ratios reveal operational leverage potential. Companies showing declining ratios may signal management inefficiency or market saturation, while improving ratios often precede stock price appreciation. In M&A contexts, acquirers analyze target company ratios to identify integration opportunities-can operational improvements boost combined entity efficiency? Private equity firms particularly value this metric when evaluating operational improvement potential in portfolio companies, often targeting 10-20% turnover improvements through working capital optimization and asset rationalization initiatives.
Frequently Asked Questions
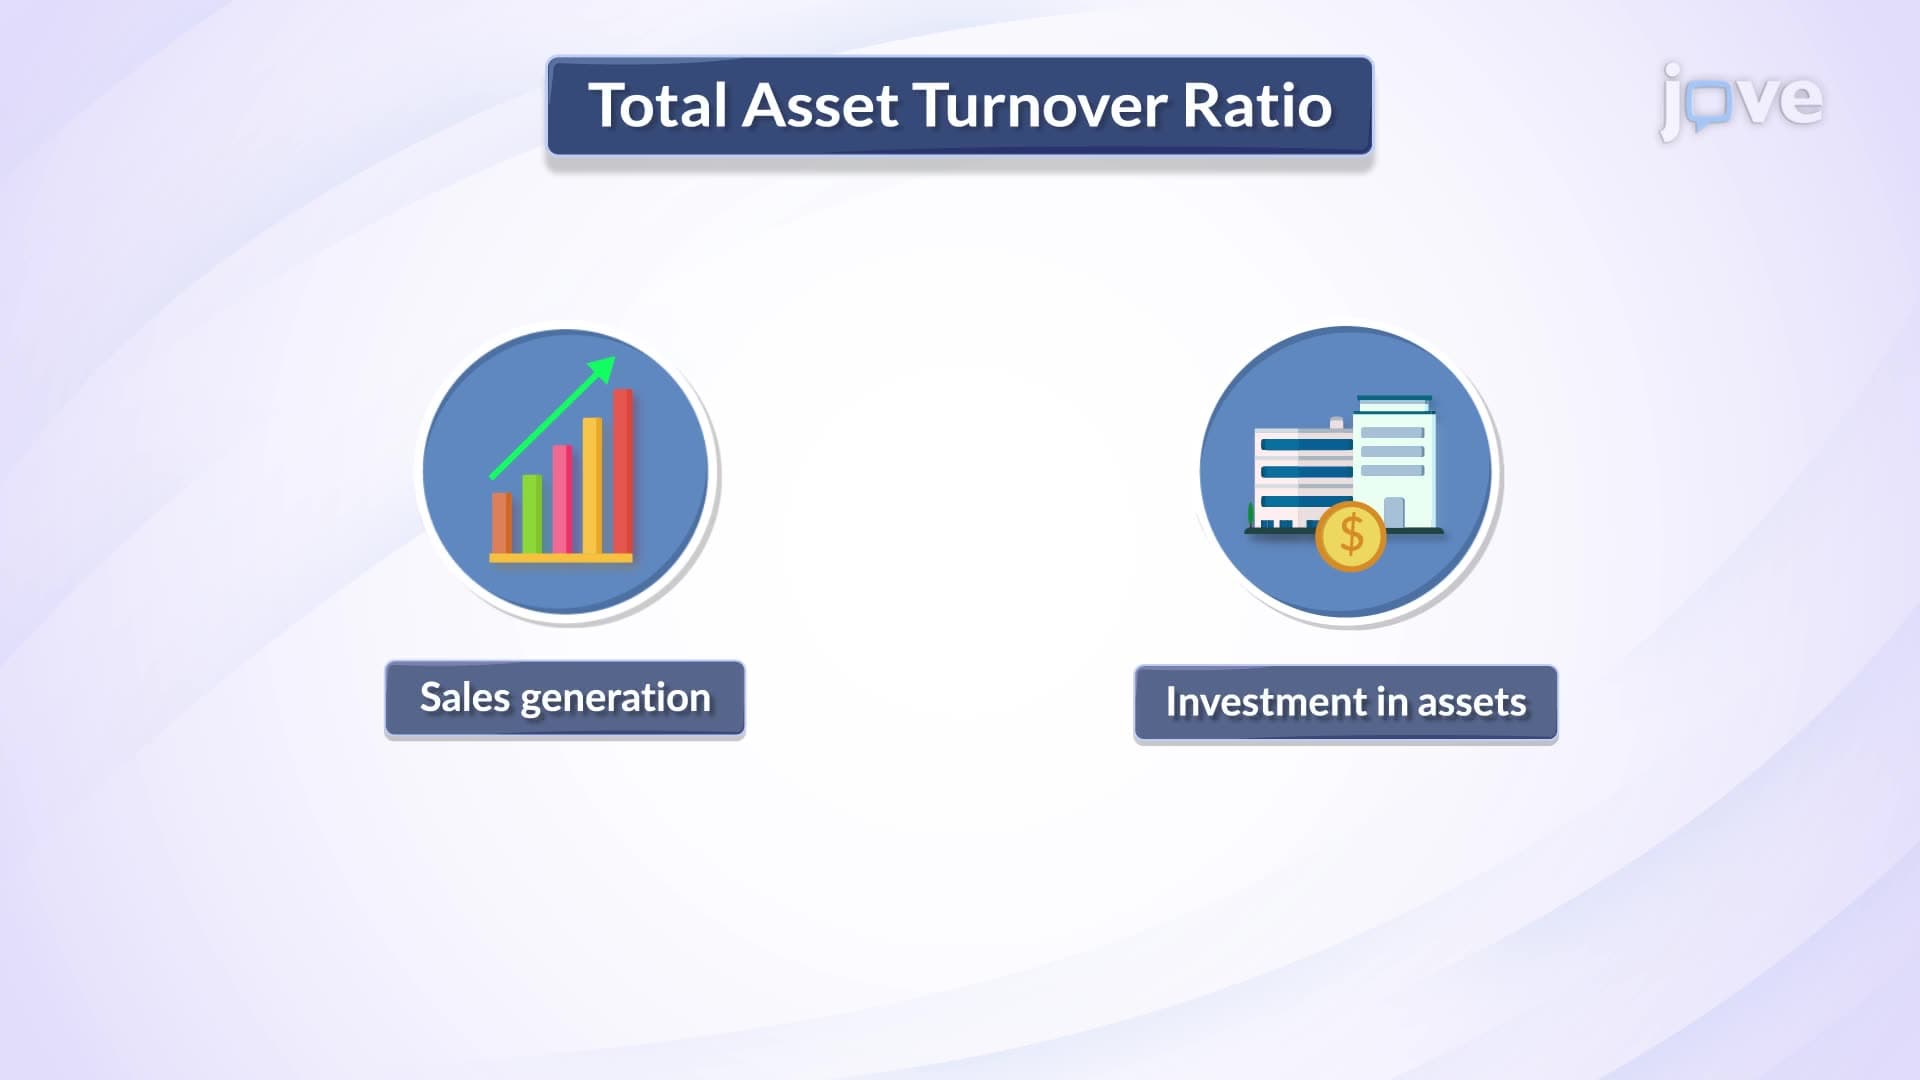
Total asset turnover ratio measures how efficiently a company converts every dollar of assets into sales revenue, calculated as net sales divided by average total assets. Executives use this metric to evaluate operational efficiency, compare competitive positioning, and identify capital allocation opportunities that maximize shareholder returns.
Track your ratio quarterly against prior periods and industry benchmarks to identify operational trends. Present ratio improvements as evidence of management effectiveness, or explain declining ratios with strategic context like capacity investments for future growth.
Frame differences in strategic context-lower ratios may reflect deliberate capacity investments for market expansion, while higher ratios could indicate asset optimization or potentially insufficient growth investment. Always benchmark against companies with similar business models and growth stages.
Costco's membership model and high inventory turnover (12-13x annually) combined with minimal store footprint per sales dollar generates asset turnover ratios around 3.5x, significantly outperforming traditional retailers at 2.0-2.5x through operational efficiency and strategic space utilization.
No extensive background required-the calculation is straightforward division, but interpretation requires understanding your industry dynamics and competitive landscape. Focus on trend analysis and peer comparisons rather than complex financial modeling.
Demonstrating ability to analyze operational efficiency metrics positions you for senior finance, strategy, or general management roles. This skill proves valuable in investor relations, due diligence processes, and strategic planning initiatives that drive business growth.
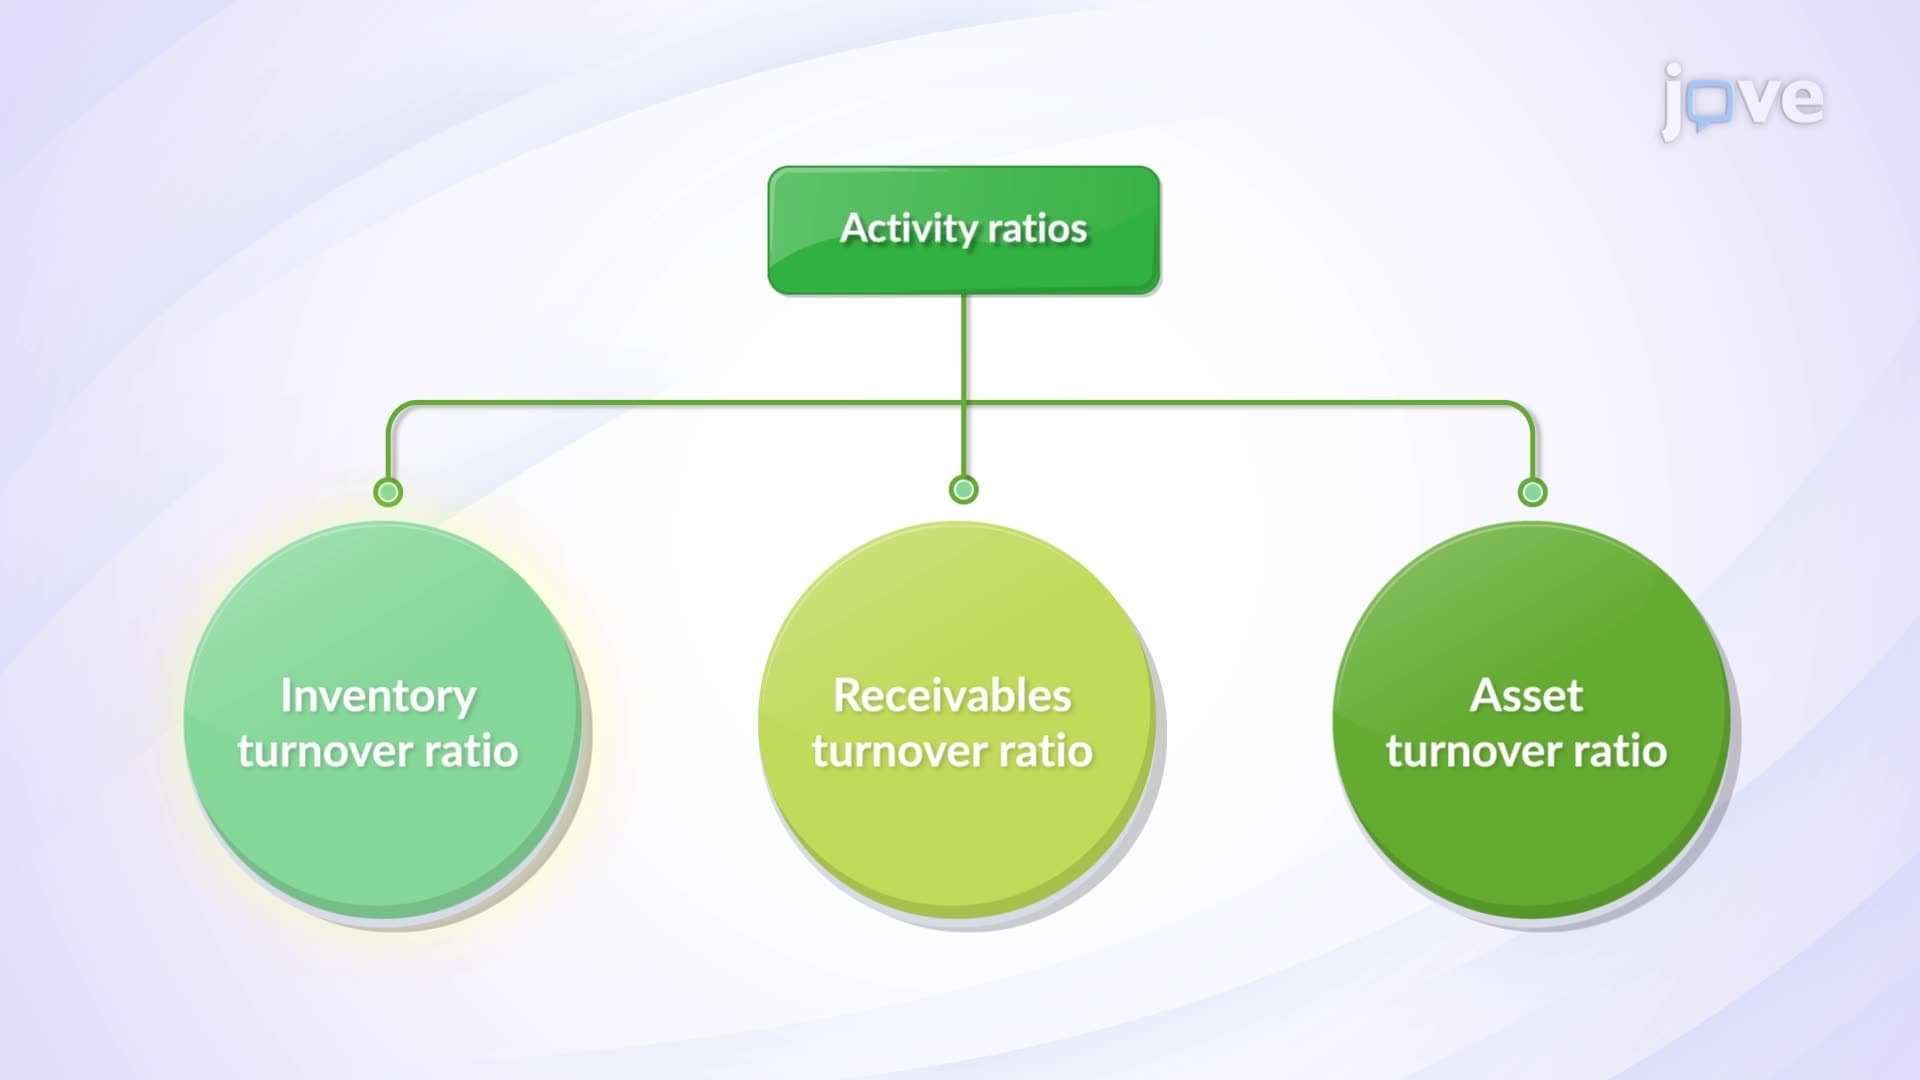
Examine inventory turnover and receivables turnover ratios to understand specific asset efficiency components, then progress to return on assets (ROA) analysis to connect efficiency metrics with overall profitability performance.
Calculate quarterly for internal management reporting and annually for strategic planning cycles. Monitor monthly during periods of significant operational changes, acquisitions, or market expansion to ensure strategic initiatives deliver expected efficiency improvements.
Related Micro-courses