Loading subject page…
- Math Fundamentals
- Functions and Their Graphs
- Graphs of Functions
Micro-course: Functions and Their Graphs
721 views
Learn key concepts and earn your certificate.






Graphs of Functions

00:00
01:30
Video Summary: What are Graphs of Functions
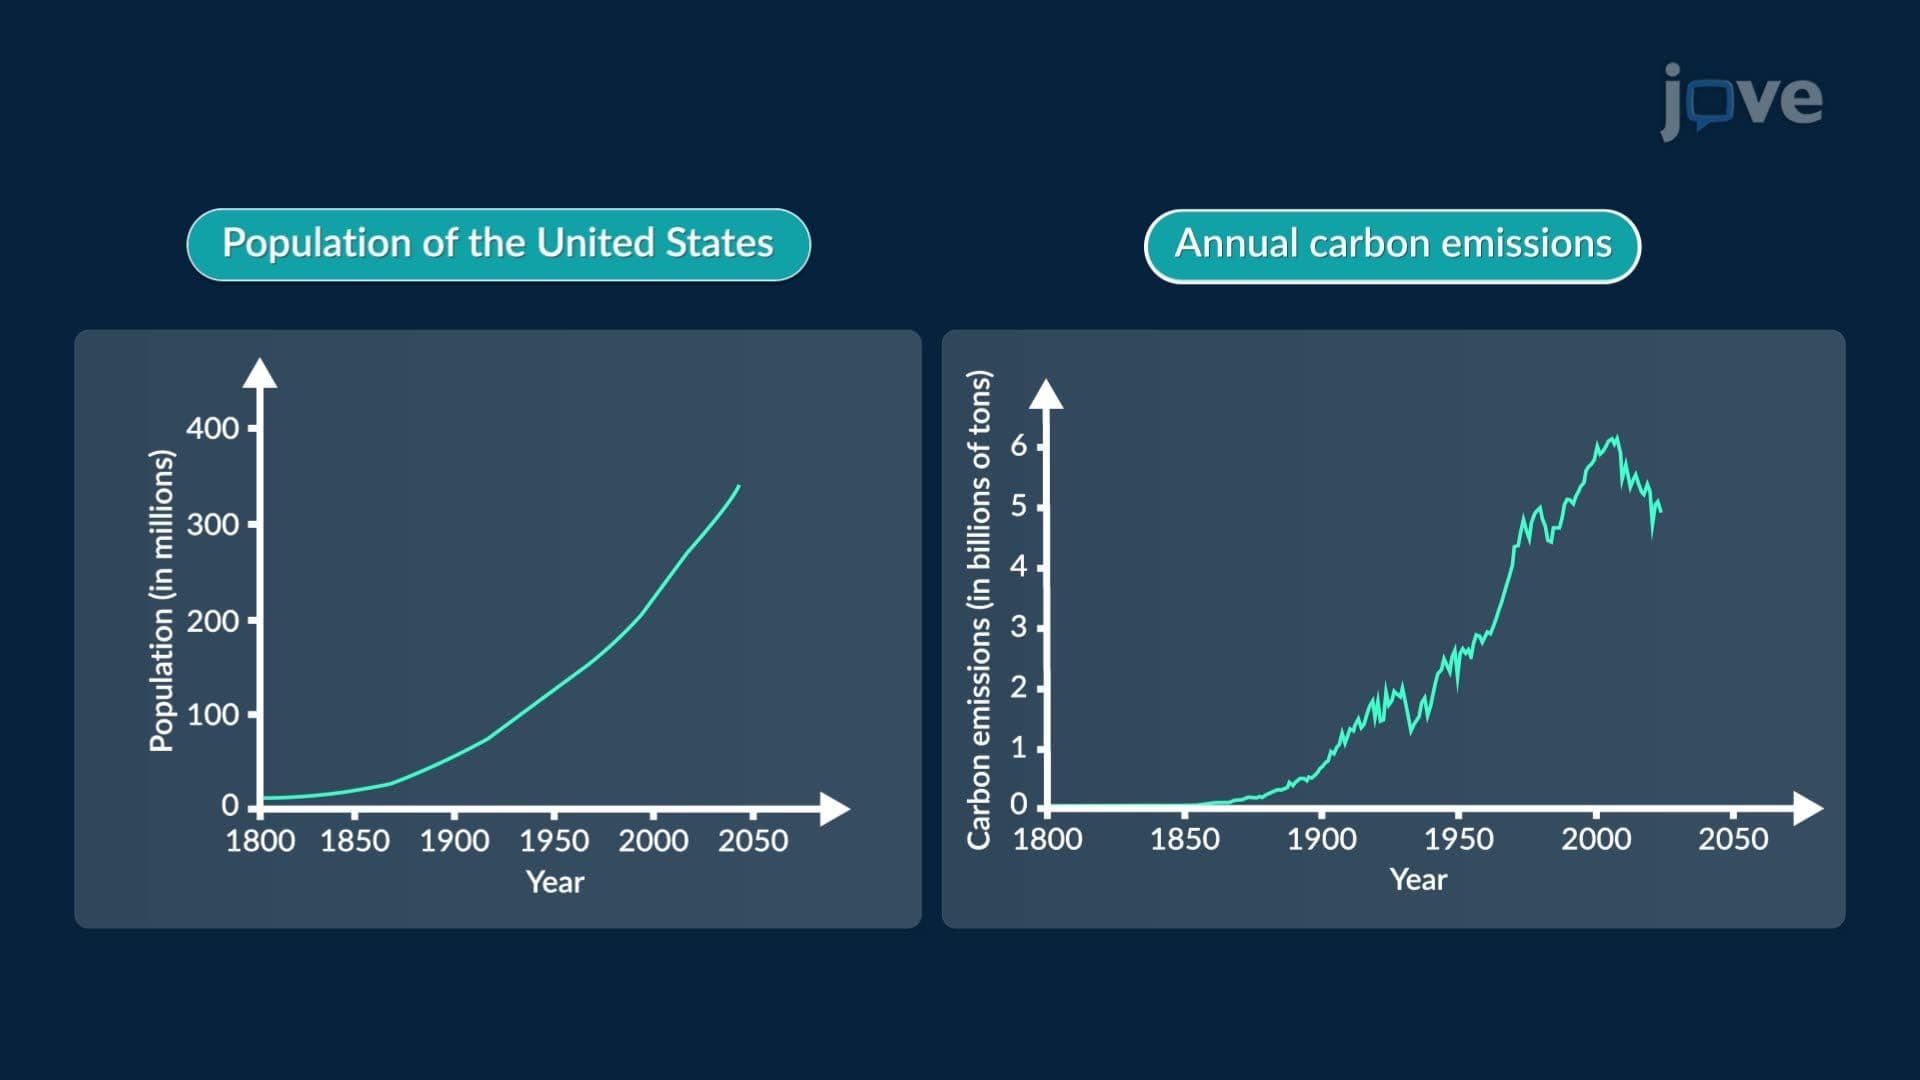
Ever wonder why your smartphone's battery percentage drops faster when you're gaming versus texting? Graphs of functions reveal these mathematical relationships visually, showing how one variable depends on another. From tracking stock prices on Wall Street to modeling population growth in California cities, what are graphs of functions becomes essential for interpreting data patterns. Linear functions create straight lines, while nonlinear functions form curves, U-shapes, or S-curves that tell unique mathematical stories. Watch the full video on JoVE Coach to master this concept with expert-led visuals and step-by-step explanations.
- Understand what are graphs of functions and how they visually represent mathematical relationships between variables
- Identify the key components of function graphs including domain, range, independent variables (x-coordinates), and dependent variables (y-coordinates)
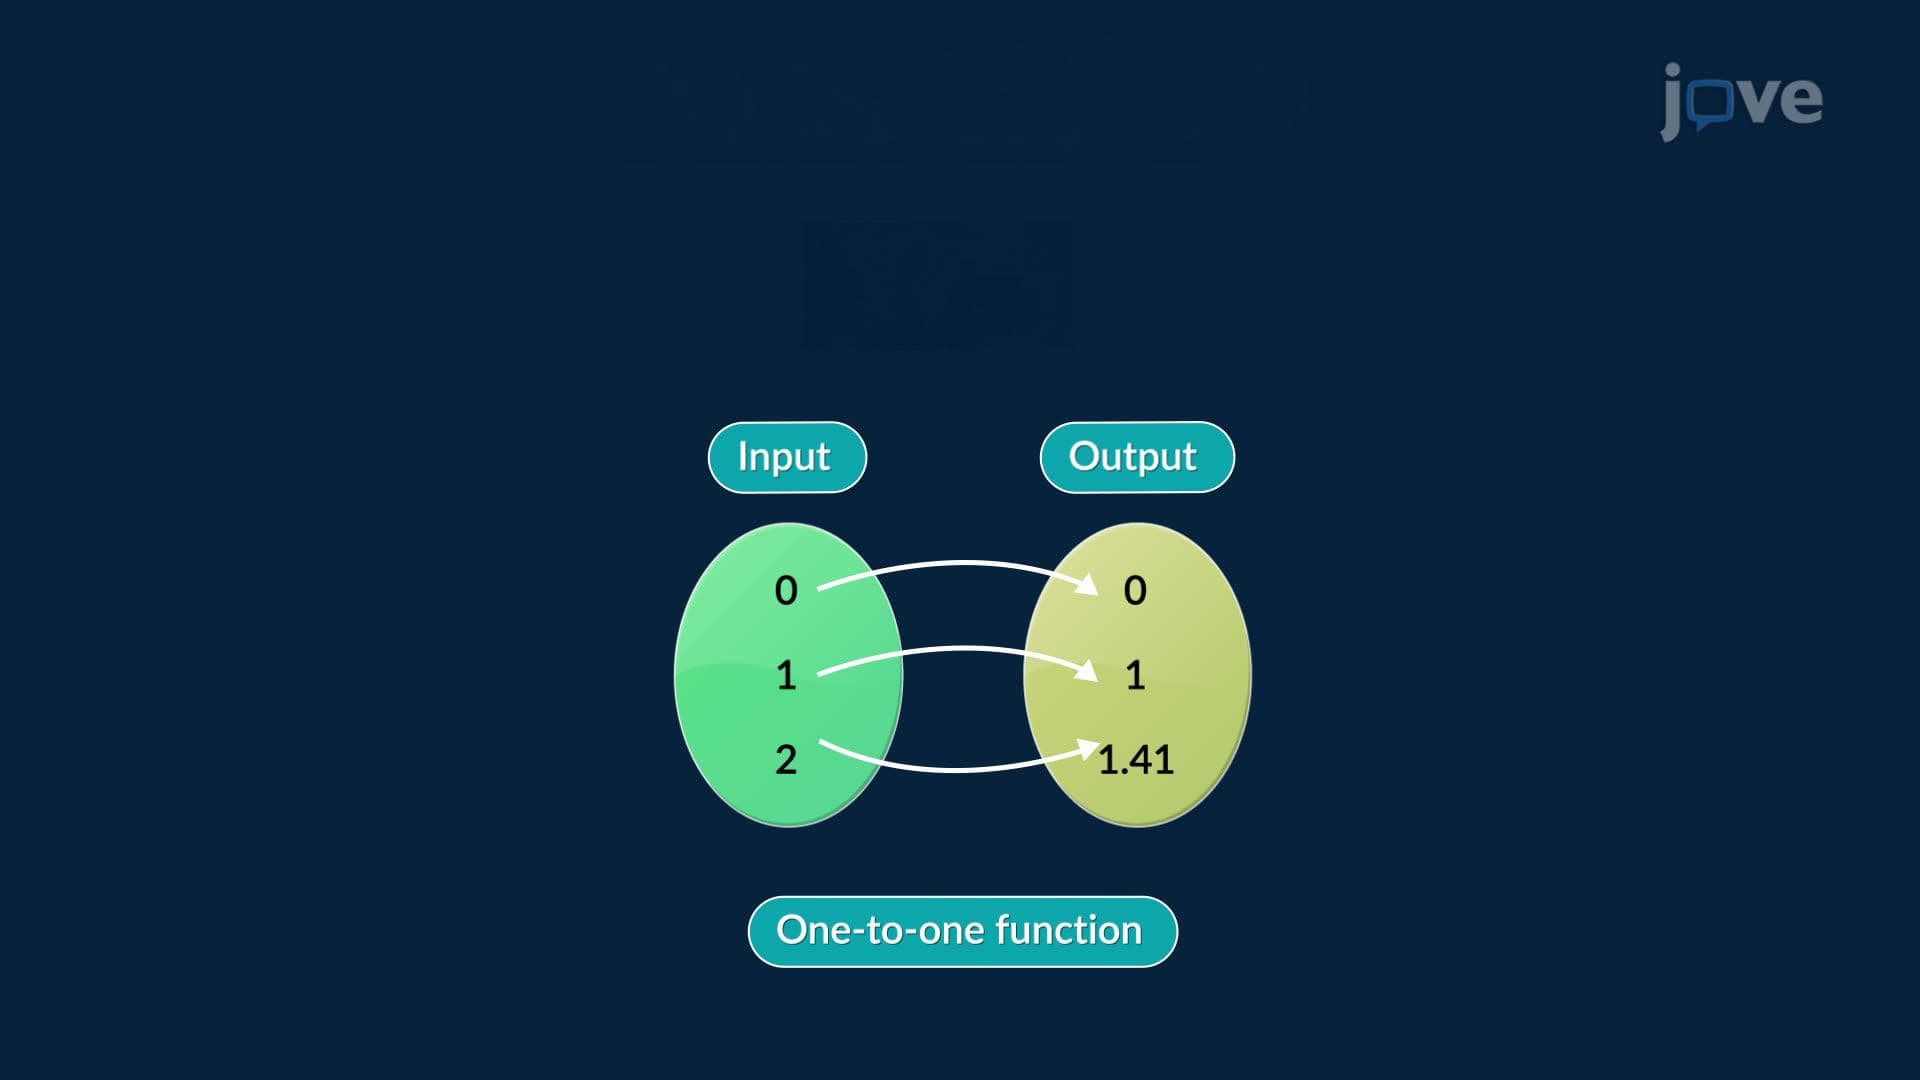
- Analyze different types of graphs of functions including linear, quadratic, cubic, and reciprocal functions
- Compare the visual characteristics of even power functions (U-shaped curves) versus odd power functions (S-shaped curves)
- Recognize asymptotes as lines that graphs approach but never intersect, particularly in reciprocal functions
- Apply coordinate plotting techniques to create accurate function graphs using multiple x-values
- Evaluate how function behavior changes as input values increase or decrease from zero
- Explore the relationship between function form and graph shape to predict visual patterns
Understanding What are Graphs of Functions
Graphs of functions serve as the visual language of mathematics, transforming abstract equations into concrete pictures that reveal patterns and relationships. When we plot a function, we're creating a map that shows exactly how changing one variable affects another. This fundamental concept appears everywhere from analyzing Netflix viewing trends to tracking medication effectiveness in clinical trials.
Linear Functions: The Foundation of Function Graphing
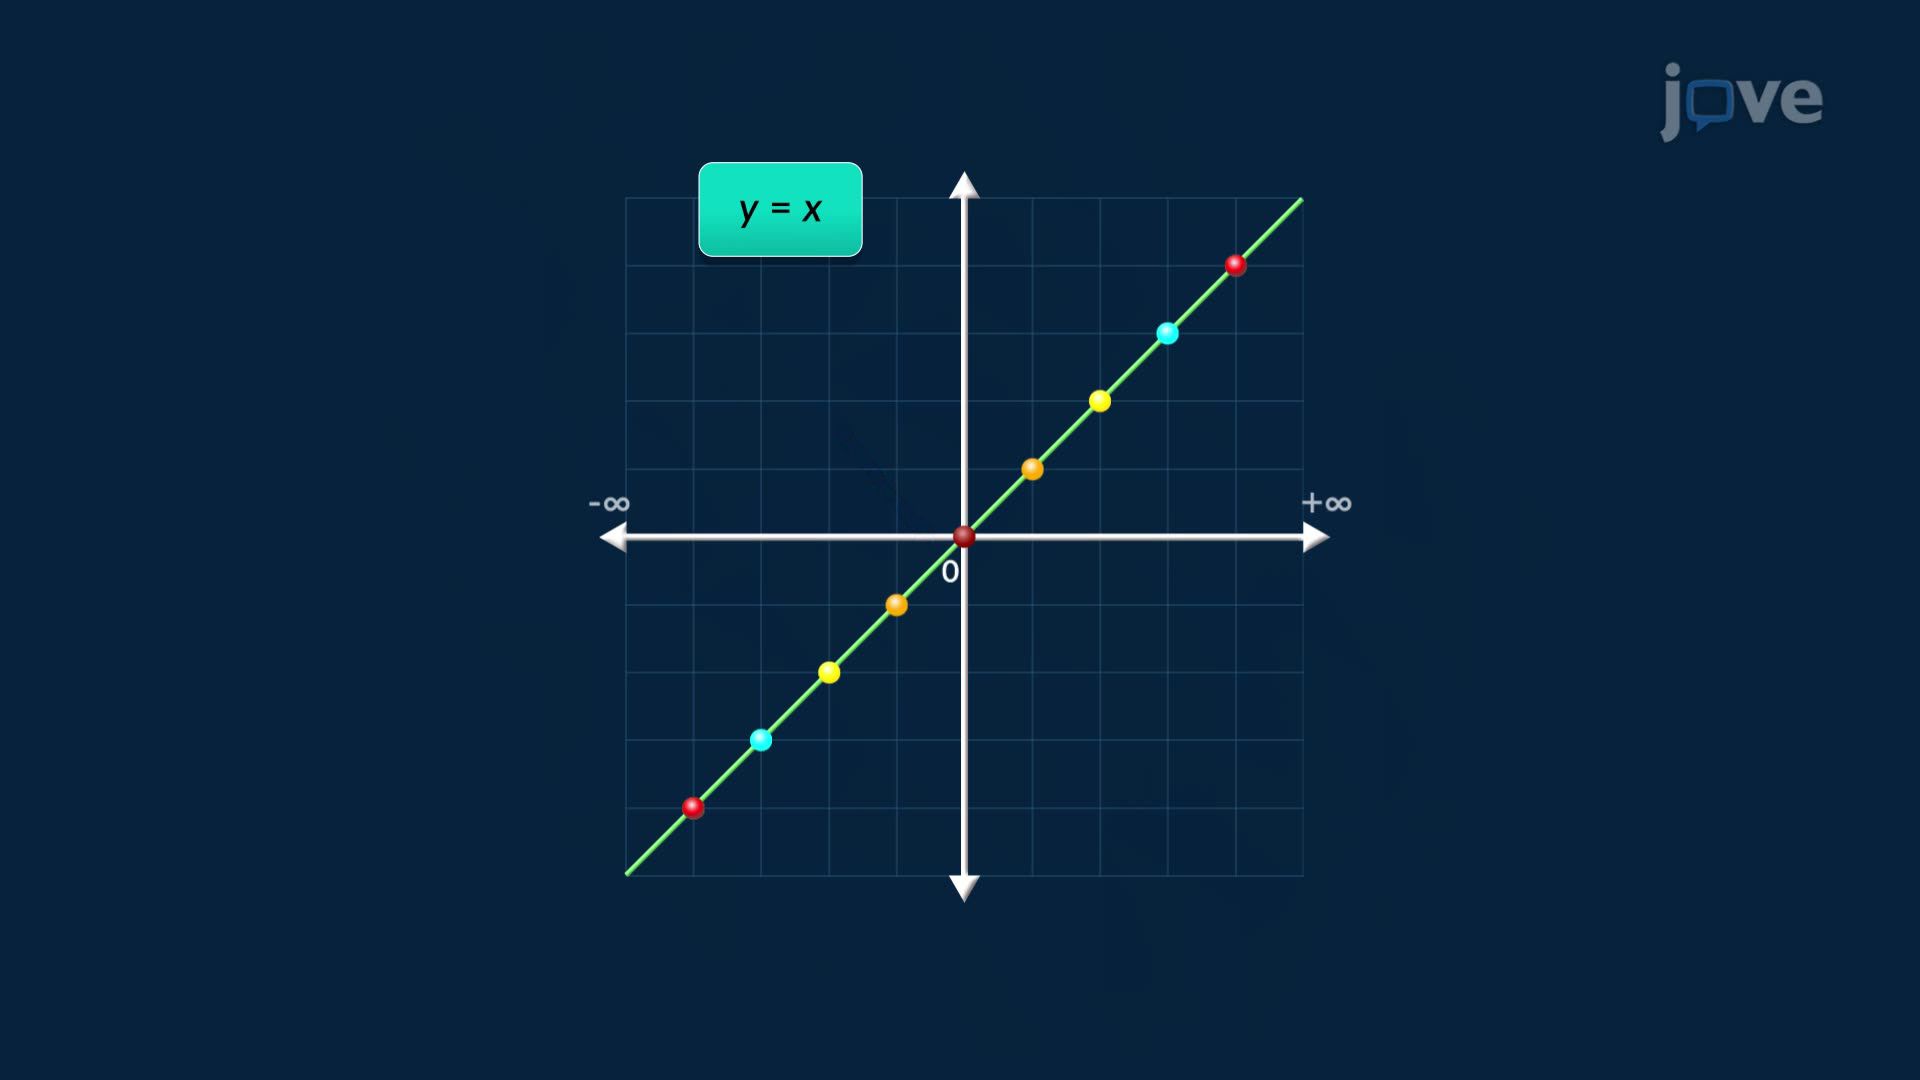
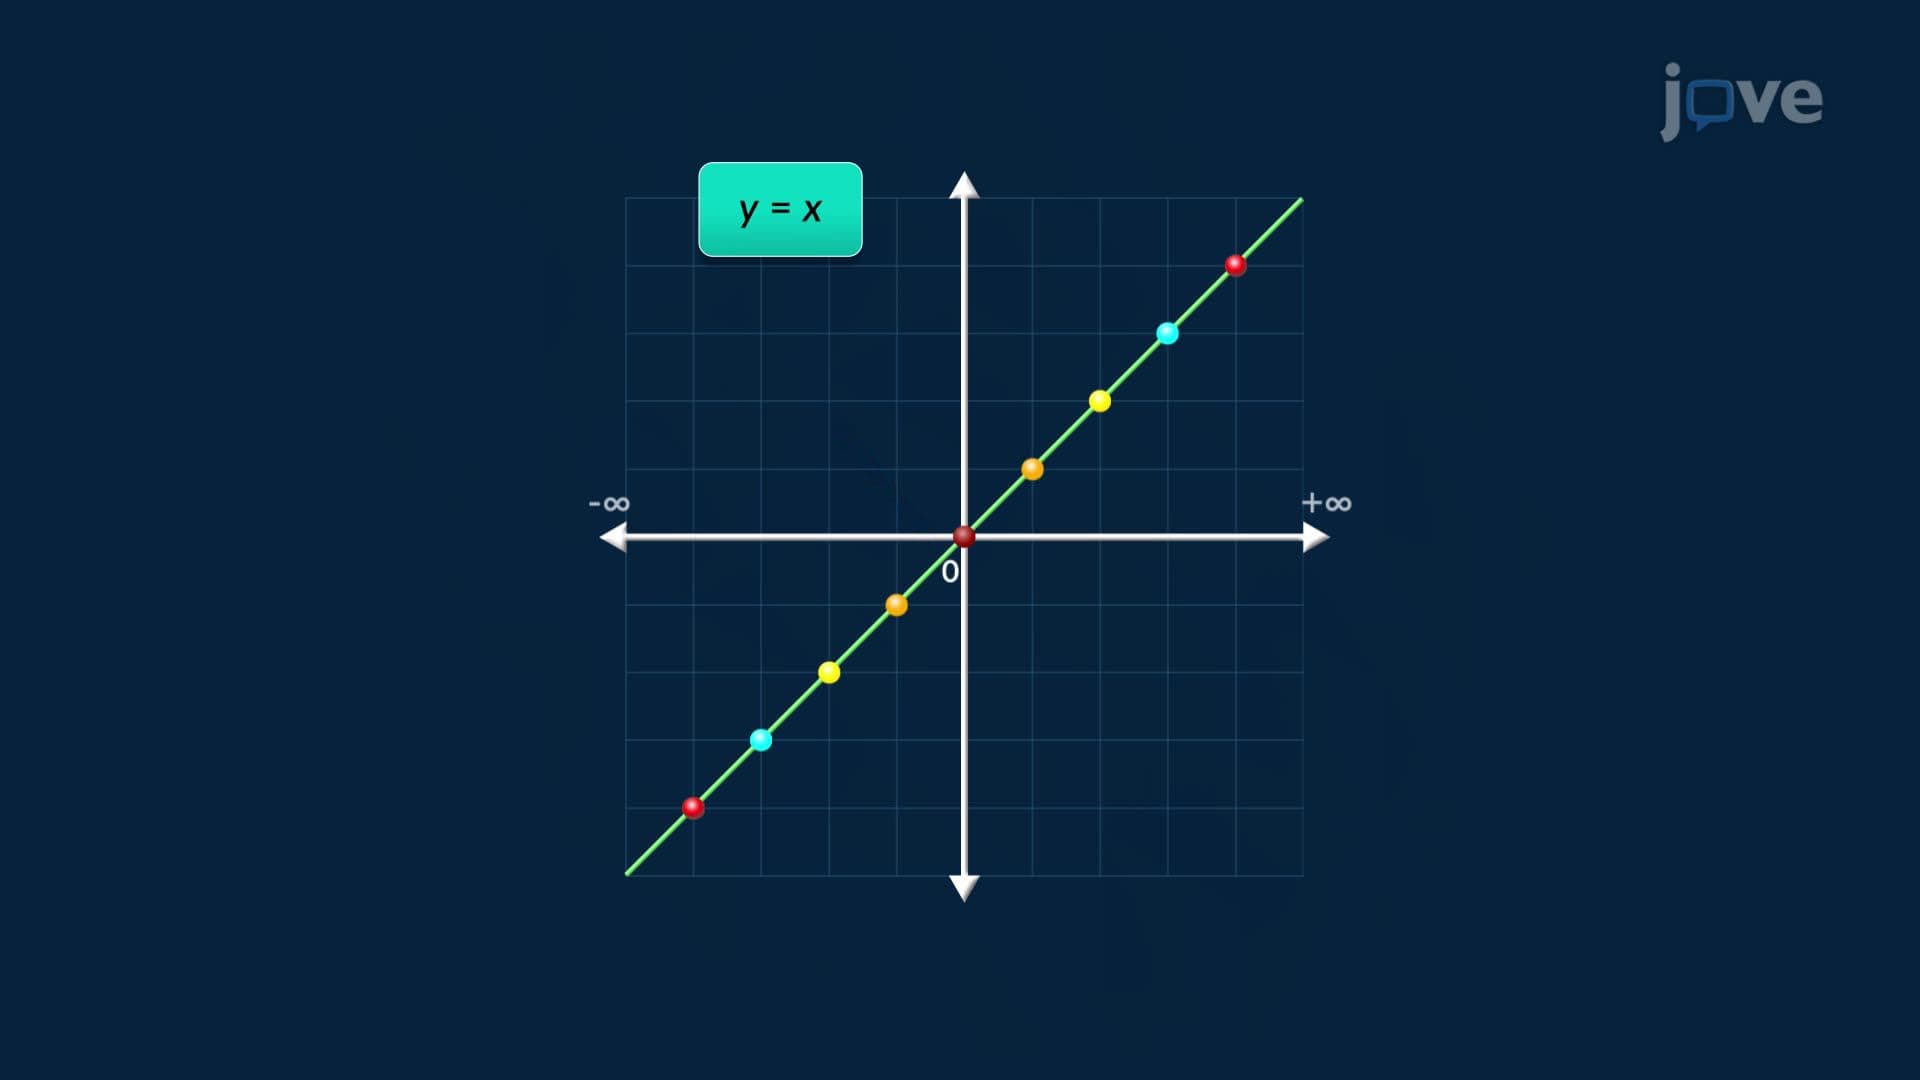
Linear functions create the simplest types of graphs of functions, straight lines that maintain constant rates of change. Consider tracking your savings account balance over time: if you deposit $50 weekly, your balance increases linearly. The x-coordinate represents time (independent variable), while the y-coordinate shows your balance (dependent variable). This relationship appears frequently on SAT Math sections and AP Calculus exams, where students must interpret slope and y-intercept meanings.
Nonlinear Functions: Curves Tell Complex Stories
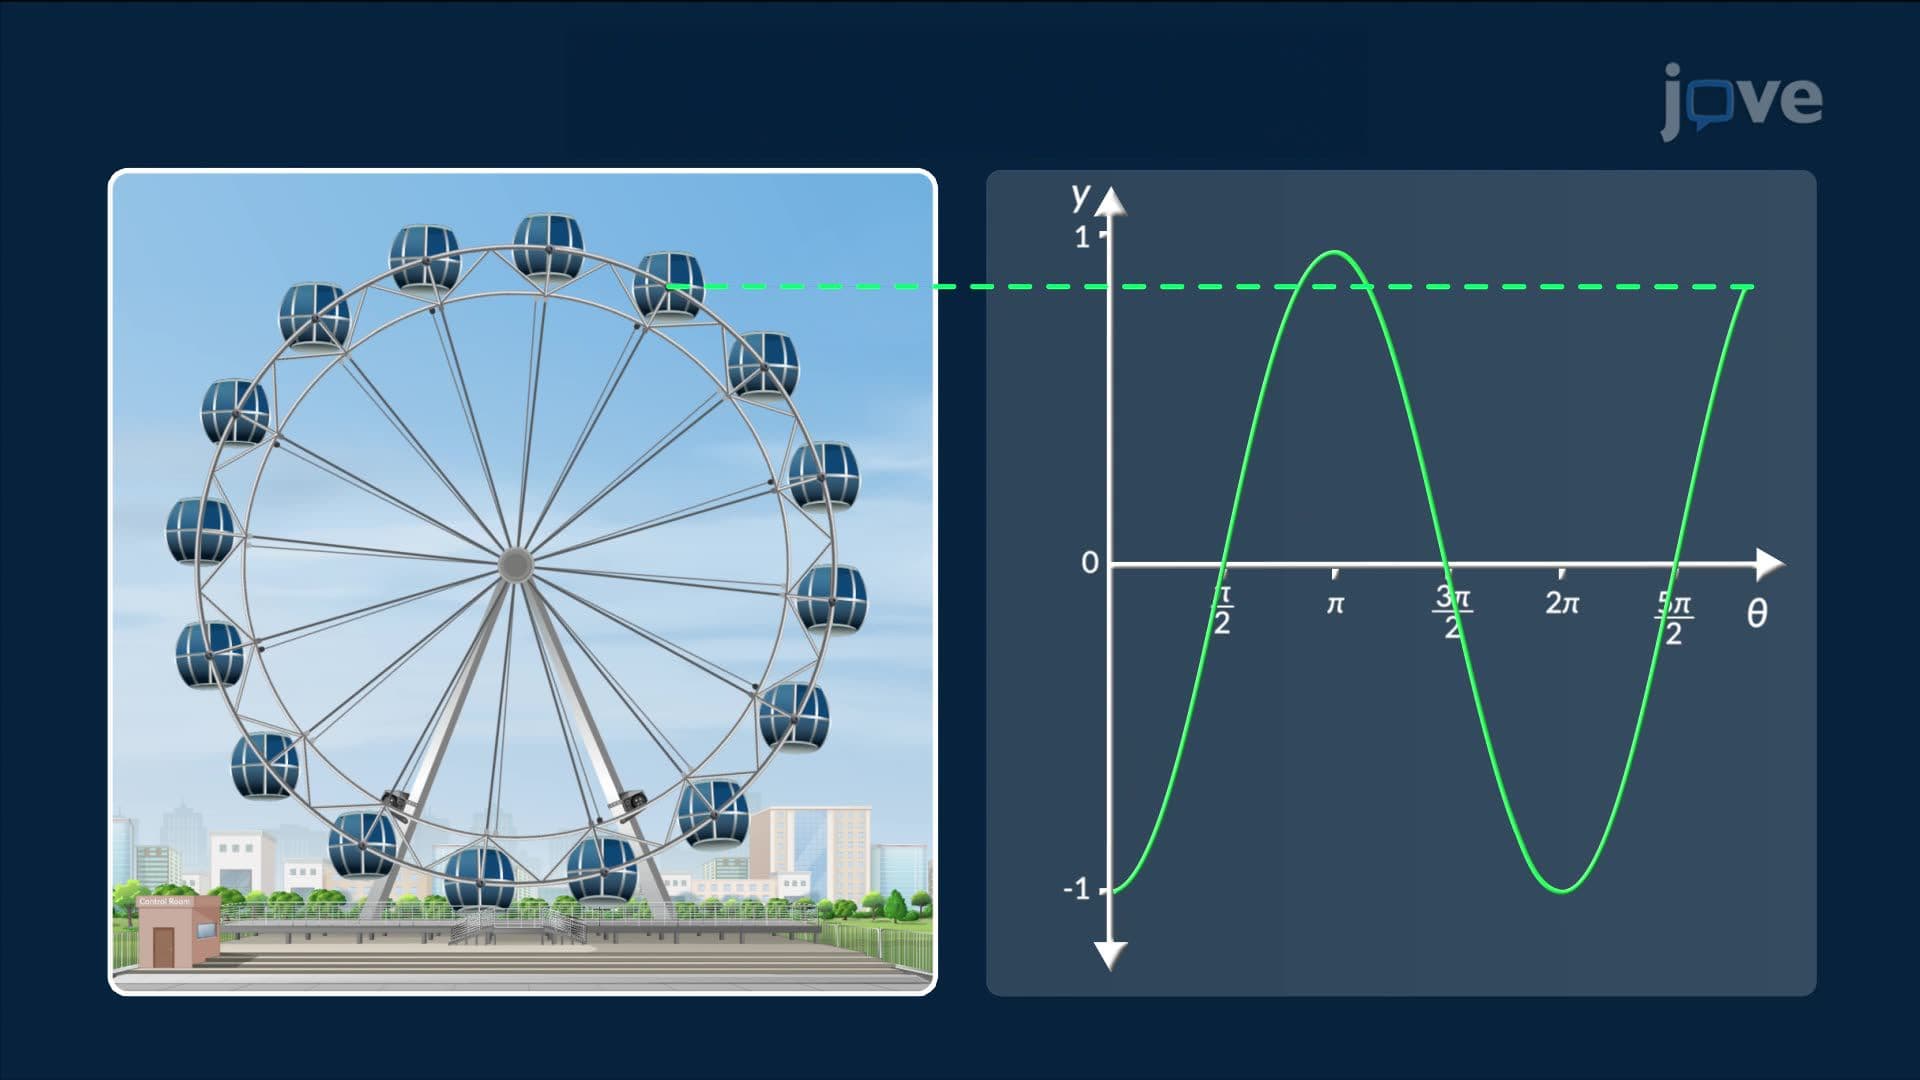
Even power functions, like f(x) = x², create U-shaped parabolas that open upward or downward. These appear in physics when modeling projectile motion, think of a basketball's path during a free throw at Madison Square Garden. The vertex represents the maximum height, while the symmetric arms show the ball's ascent and descent. College algebra courses emphasize how these functions maintain symmetry about their vertical axis, producing identical y-values for positive and negative x-inputs of equal magnitude.
Advanced Function Types and Their Characteristics
Odd power functions, such as f(x) = x³, generate S-shaped curves extending infinitely in opposite directions. These functions model population growth scenarios where resources become limited, creating initial exponential growth followed by leveling off. Reciprocal functions like f(x) = 1/x form hyperbolas, two separate curves that approach but never touch the coordinate axes. These asymptotic behaviors frequently appear in AP Calculus free-response questions, testing students' understanding of limits and infinite behavior.
Understanding domain and range becomes crucial for exam success. Domain represents all possible x-values a function can accept, while range encompasses all resulting y-values. Medical dosage calculations rely heavily on these concepts, ensuring safe medication administration within specified parameters.
Frequently Asked Questions
Graphs of functions are visual representations showing how one variable depends on another, plotted on coordinate planes using x and y axes. They transform mathematical equations into pictures that reveal patterns, trends, and relationships between variables. Think of them as mathematical maps that help us understand how changing inputs affect outputs.
The essential types include linear functions (straight lines), quadratic functions (U-shaped parabolas), cubic functions (S-shaped curves), and reciprocal functions (hyperbolas with asymptotes). These appear frequently on AP Calculus, SAT Math, and college algebra exams. Each type has distinct characteristics that help identify the underlying function form.
SAT Math sections typically test linear and quadratic function interpretation, while AP Calculus exams include more complex functions with asymptotes and discontinuities. Expect questions about domain, range, intercepts, and function behavior. Practice identifying function types from their graphs and interpreting real-world scenarios through graphical analysis.
Financial analysts use function graphs to track stock performance on Wall Street, epidemiologists model disease spread patterns, and engineers design roller coasters using parabolic curves. Weather forecasters rely on function graphs to predict temperature changes, while pharmaceutical companies use them to determine optimal drug dosages and effectiveness over time.
Basic function graphing only requires fundamental algebra skills including coordinate plotting and understanding x/y relationships. Start with linear functions before progressing to curves. Most high school students can master these concepts with consistent practice, making them accessible for grades 9-12 mathematics courses.
Create visual memory aids associating function types with their shapes: linear = straight line, quadratic = U-shape, cubic = S-curve, reciprocal = two separate curves. Practice sketching each type repeatedly and connect them to real-world examples like projectile paths or population growth models for better retention.
Asymptotes are invisible boundary lines that function graphs approach infinitely close but never actually touch or cross. Vertical asymptotes occur where functions become undefined (like division by zero), while horizontal asymptotes show function behavior as x approaches infinity. Understanding asymptotes is crucial for advanced placement exams and calculus courses.
Progress to function transformations (shifting, stretching, reflecting graphs), then explore inverse functions and composite functions. Advanced topics include limits, derivatives, and integral calculus, all building upon your foundation in function graphing. These concepts prepare you for AP Calculus and college-level mathematics courses.
Related Micro-courses
10 Concepts
8 Concepts

5 Concepts