Loading subject page…

- Statistics
- Correlation and Regression
- Outliers and Influential Points
Micro-course: Correlation and Regression
65,900 views
Learn key concepts and earn your certificate.








Outliers and Influential Points


00:00
01:08
Video Summary: What Is Outliers and Influential Points
Ever wondered why some data points seem to "break the rules" in statistical analysis? Outliers and influential points are data anomalies that can dramatically skew your regression results. Consider a scenario where a high school dropout becomes a tech billionaire like Bill Gates, this would appear as an outlier in a study comparing education levels to income across American workers. Understanding What is Outliers And Influential Points is crucial for accurate statistical interpretation and avoiding misleading conclusions. Watch the full video on JoVE Coach to master this concept with expert-led visuals and step-by-step explanations.
- Understand What is Outliers And Influential Points and distinguish between these two types of statistical anomalies in regression analysis
- Identify outliers using residual analysis and the two standard deviation rule of thumb for flagging potential data anomalies
- Analyze the vertical distance of data points from regression lines to detect outliers that don't follow expected trends
- Recognize influential points by their horizontal distance from the main cluster of data points in scatter plots
- Evaluate how the addition or removal of influential points significantly alters regression line slope and intercept
- Apply residual standard deviation calculations to quantitatively assess whether data points qualify as statistical outliers
- Compare the different impacts that outliers versus influential points have on regression model accuracy and predictions
- Explore real-world scenarios where identifying these anomalies becomes critical for valid statistical conclusions
Understanding What is Outliers And Influential Points: Core Definitions
Outliers and influential points represent two distinct types of data anomalies that can significantly impact statistical analysis, particularly in regression modeling. While both deviate from expected patterns, they affect data interpretation in fundamentally different ways.
An outlier is a data point that falls unusually far from the established trend line in the vertical direction. These points have y-values that differ dramatically from what the regression equation predicts. For example, in analyzing SAT scores versus study hours among American high school students, a student who studied only 10 hours but scored 1500 would be an outlier, their performance exceeds expectations based on the general trend.
Influential points, conversely, are positioned far from other data points in the horizontal direction (x-axis). These points possess extreme x-values that give them disproportionate power to "pull" the regression line toward themselves. In our SAT example, a student who studied 200 hours (when most studied 20-80 hours) would be an influential point, regardless of their score.
Quantitative Detection Methods
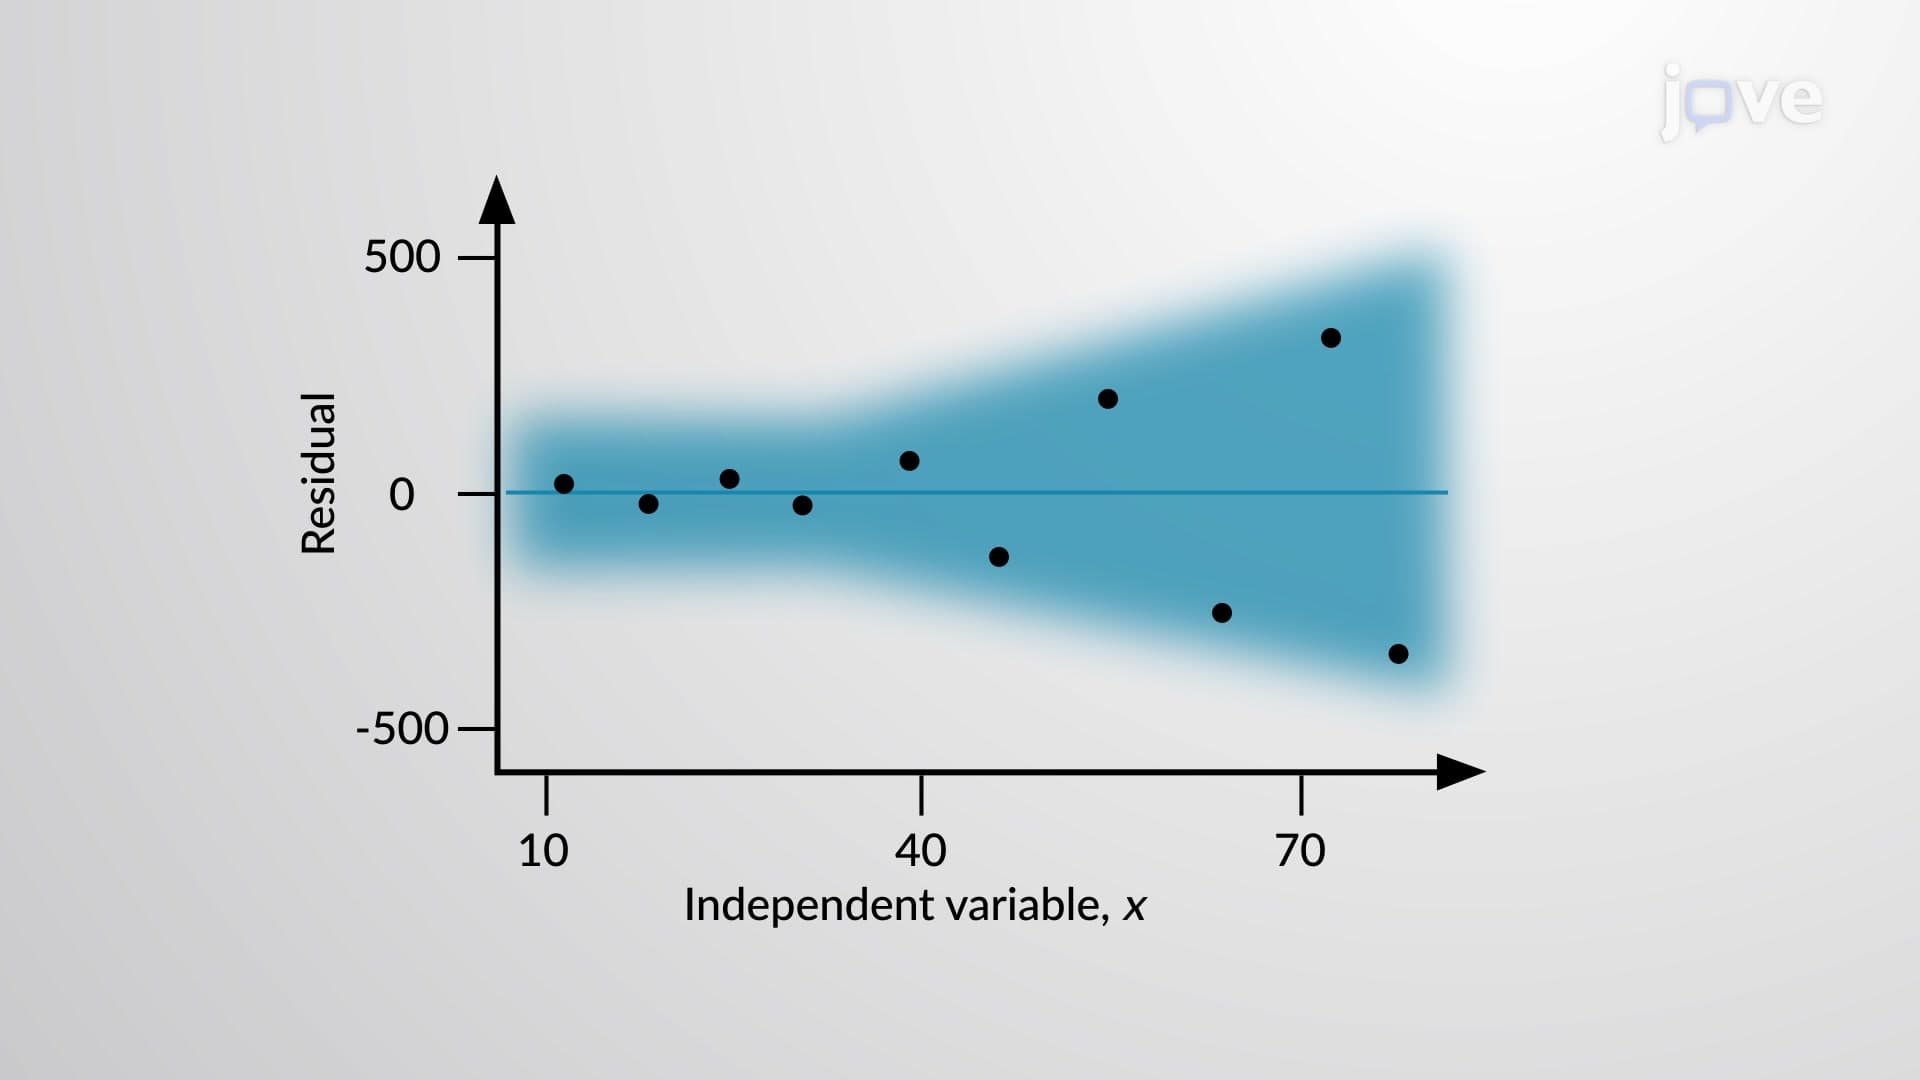
The most reliable method for identifying outliers involves residual analysis. Residuals represent the difference between observed y-values and predicted y-values from the regression equation. Calculate the standard deviation of all residuals, then apply the "two standard deviation rule": any point falling more than two residual standard deviations above or below the regression line warrants investigation as a potential outlier.
This quantitative approach proves especially valuable in AP Statistics courses and college-level data analysis, where subjective visual assessment alone isn't sufficient. Students preparing for standardized tests like the AP Statistics exam frequently encounter problems requiring residual calculations to identify outliers systematically.
Real-World Applications and Academic Relevance
In practical applications, outliers and influential points appear frequently in American datasets. Medical researchers studying the relationship between exercise frequency and blood pressure might encounter outliers, patients with excellent blood pressure despite minimal exercise due to genetic factors. Economics students analyzing income versus education data often find influential points in datasets including individuals with extremely high education levels (multiple PhDs) or unusually low education but high income (successful entrepreneurs).
Understanding these concepts proves crucial for students taking quantitative courses across disciplines. Pre-med students encounter outlier detection in biostatistics courses, while business majors apply these principles in market research and quality control contexts. The ability to identify and appropriately handle statistical anomalies directly impacts the validity of research conclusions and decision-making processes.
Statistical Impact and Interpretation Guidelines
The presence of outliers and influential points dramatically affects regression analysis outcomes. Outliers primarily impact measures of model fit and prediction accuracy, while influential points can completely alter the regression line's slope and intercept. This distinction becomes critical when students face exam questions asking them to predict how removing specific data points would change regression results.
Frequently Asked Questions
Outliers are data points that fall unusually far above or below the expected trend line, while influential points are positioned far from other points horizontally and can dramatically change the regression line's direction. Both represent statistical anomalies that require careful analysis to avoid misleading conclusions in data interpretation.
In AP Statistics, outliers are defined as points with residuals exceeding two standard deviations from the regression line, while influential points have extreme x-values that significantly alter regression line slope when removed. These definitions align with College Board standards and frequently appear on AP exam free-response questions requiring residual analysis.
MCAT questions typically present scenarios where test-takers must identify which data points would most significantly impact study conclusions. Understanding these concepts helps in Biological and Biochemical Foundations sections when analyzing experimental data and determining validity of research findings in medical contexts.
Consider analyzing the relationship between years of education and annual salary using U.S. Census data. A person with 8 years of education earning $200,000 (like a successful contractor) would be an outlier, while someone with a PhD in multiple fields would be an influential point due to their extreme education level, potentially skewing the entire trend line.
No advanced math is required, just basic algebra and understanding of standard deviation. High school Algebra II provides sufficient background, and most calculations involve simple arithmetic operations. The conceptual understanding proves more important than complex mathematical manipulations.
Practice with real datasets and focus on visual identification using scatter plots before moving to quantitative methods. Create your own examples using familiar scenarios like GPA versus study time, then apply the two standard deviation rule systematically. Drawing connections between visual patterns and numerical calculations strengthens understanding.
Never automatically remove these points, they often contain valuable information about real-world variability or measurement errors. Instead, investigate their causes and consider running analyses both with and without them to understand their impact. Document your decision-making process for academic integrity and scientific rigor.
Progress to leverage and Cook's distance for more sophisticated influence detection, then explore robust regression methods that minimize outlier impact. Understanding transformations and non-linear relationships provides advanced tools for handling problematic data points in complex analyses.
Related Micro-courses