Loading video…


 14 Concepts
 5.9K views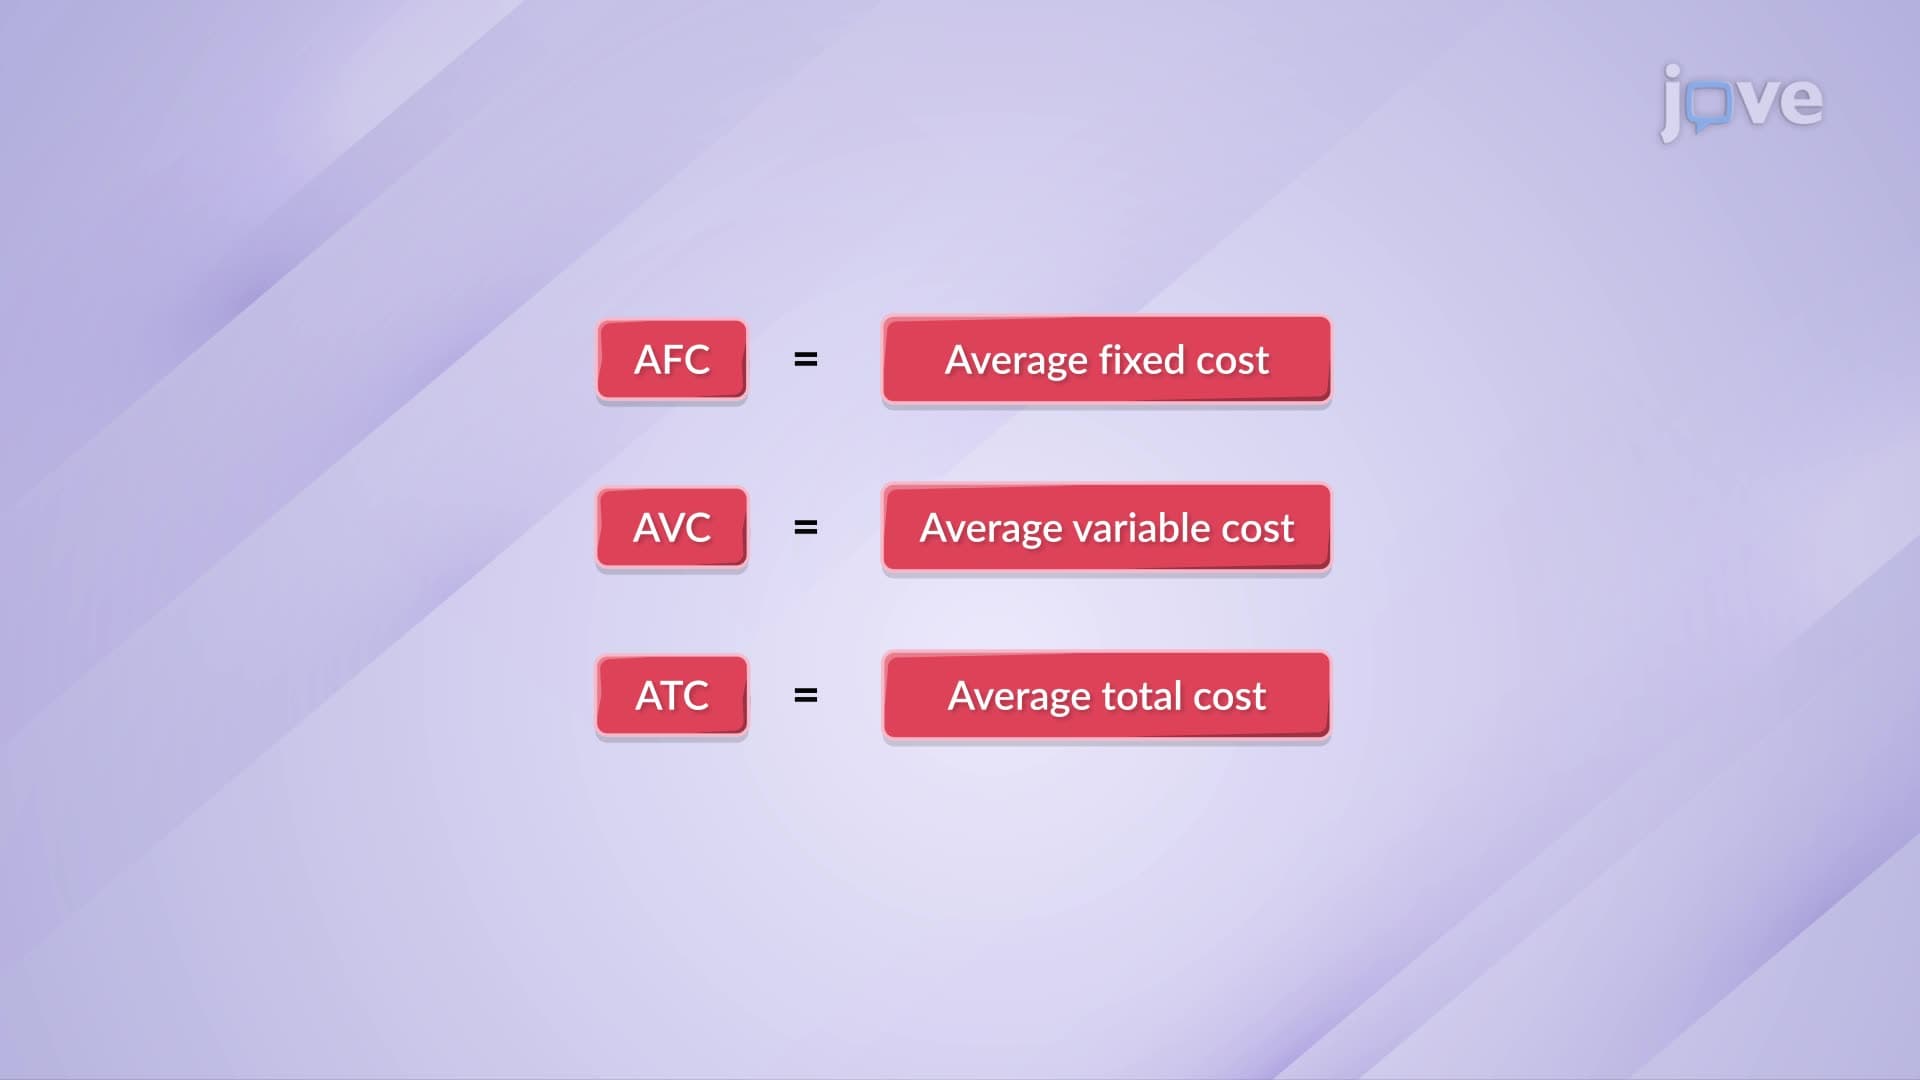

Video Summary: Average Fixed Variable and Total Costs Graphical Analysis Ii
Why does a McDonald's restaurant's cost per burger decrease when they serve more customers during lunch rush? Average fixed, variable, total costs explain this phenomenon through distinct curve patterns that every business encounters. Understanding Average Fixed, Variable, and Total Costs: Graphical Analysis II reveals how Walmart's massive scale advantages work-their fixed costs like store rent get spread across millions of products, dramatically reducing per-unit expenses. Watch the full video on JoVE Coach to master this concept with expert-led visuals and step-by-step explanations.
The graphical relationships between average costs reveal fundamental economic principles that drive business strategy across American industries. While individual cost components behave predictably, their interactions create complex patterns that successful managers must master.
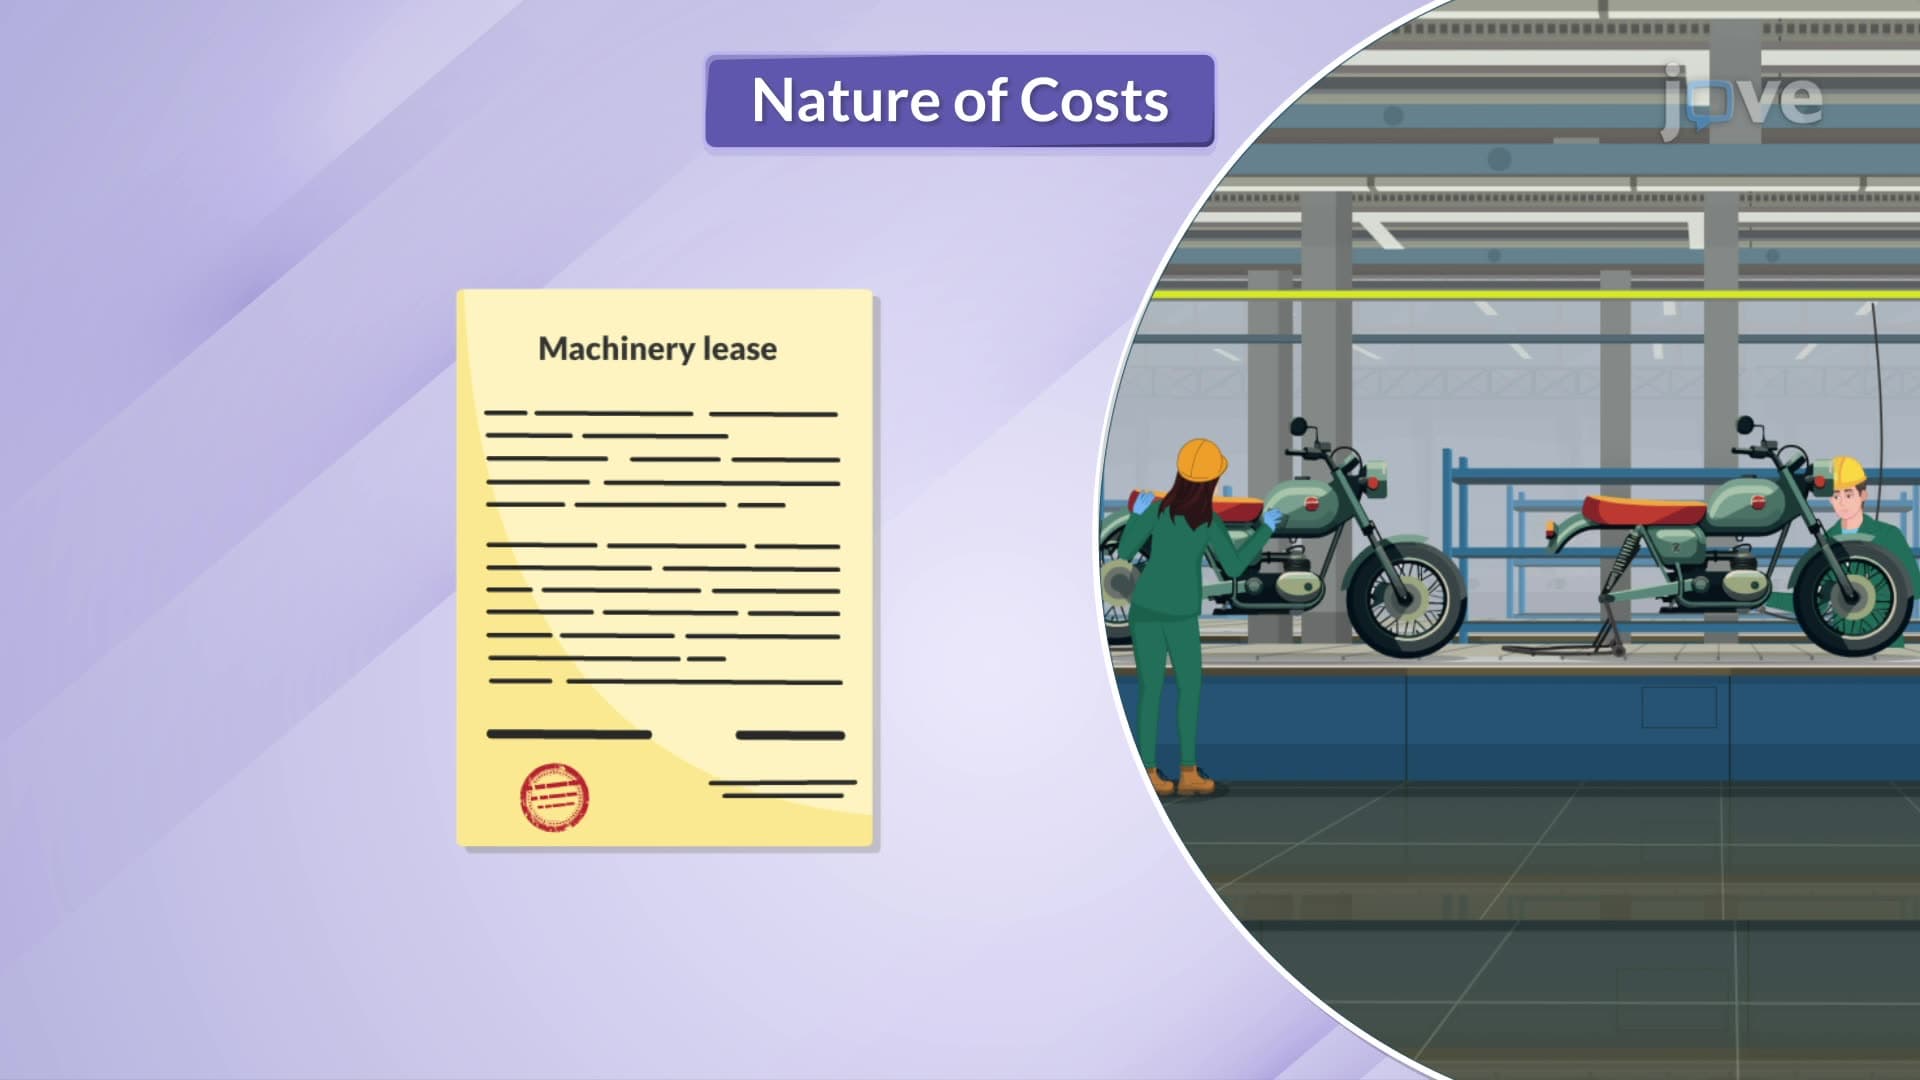
Average fixed cost (AFC) demonstrates one of economics' most powerful concepts: spreading fixed expenses across larger production volumes. Consider Netflix's content production costs-whether they create a series for 1 million or 100 million subscribers, the production budget remains constant. As subscriber numbers increase, the average cost per subscriber plummets continuously.
This relationship appears graphically as a hyperbolic curve, starting high and declining asymptotically toward zero. The mathematical relationship AFC = Total Fixed Cost / Quantity explains why large-scale operations like Amazon or Costco maintain competitive advantages through superior cost structures.
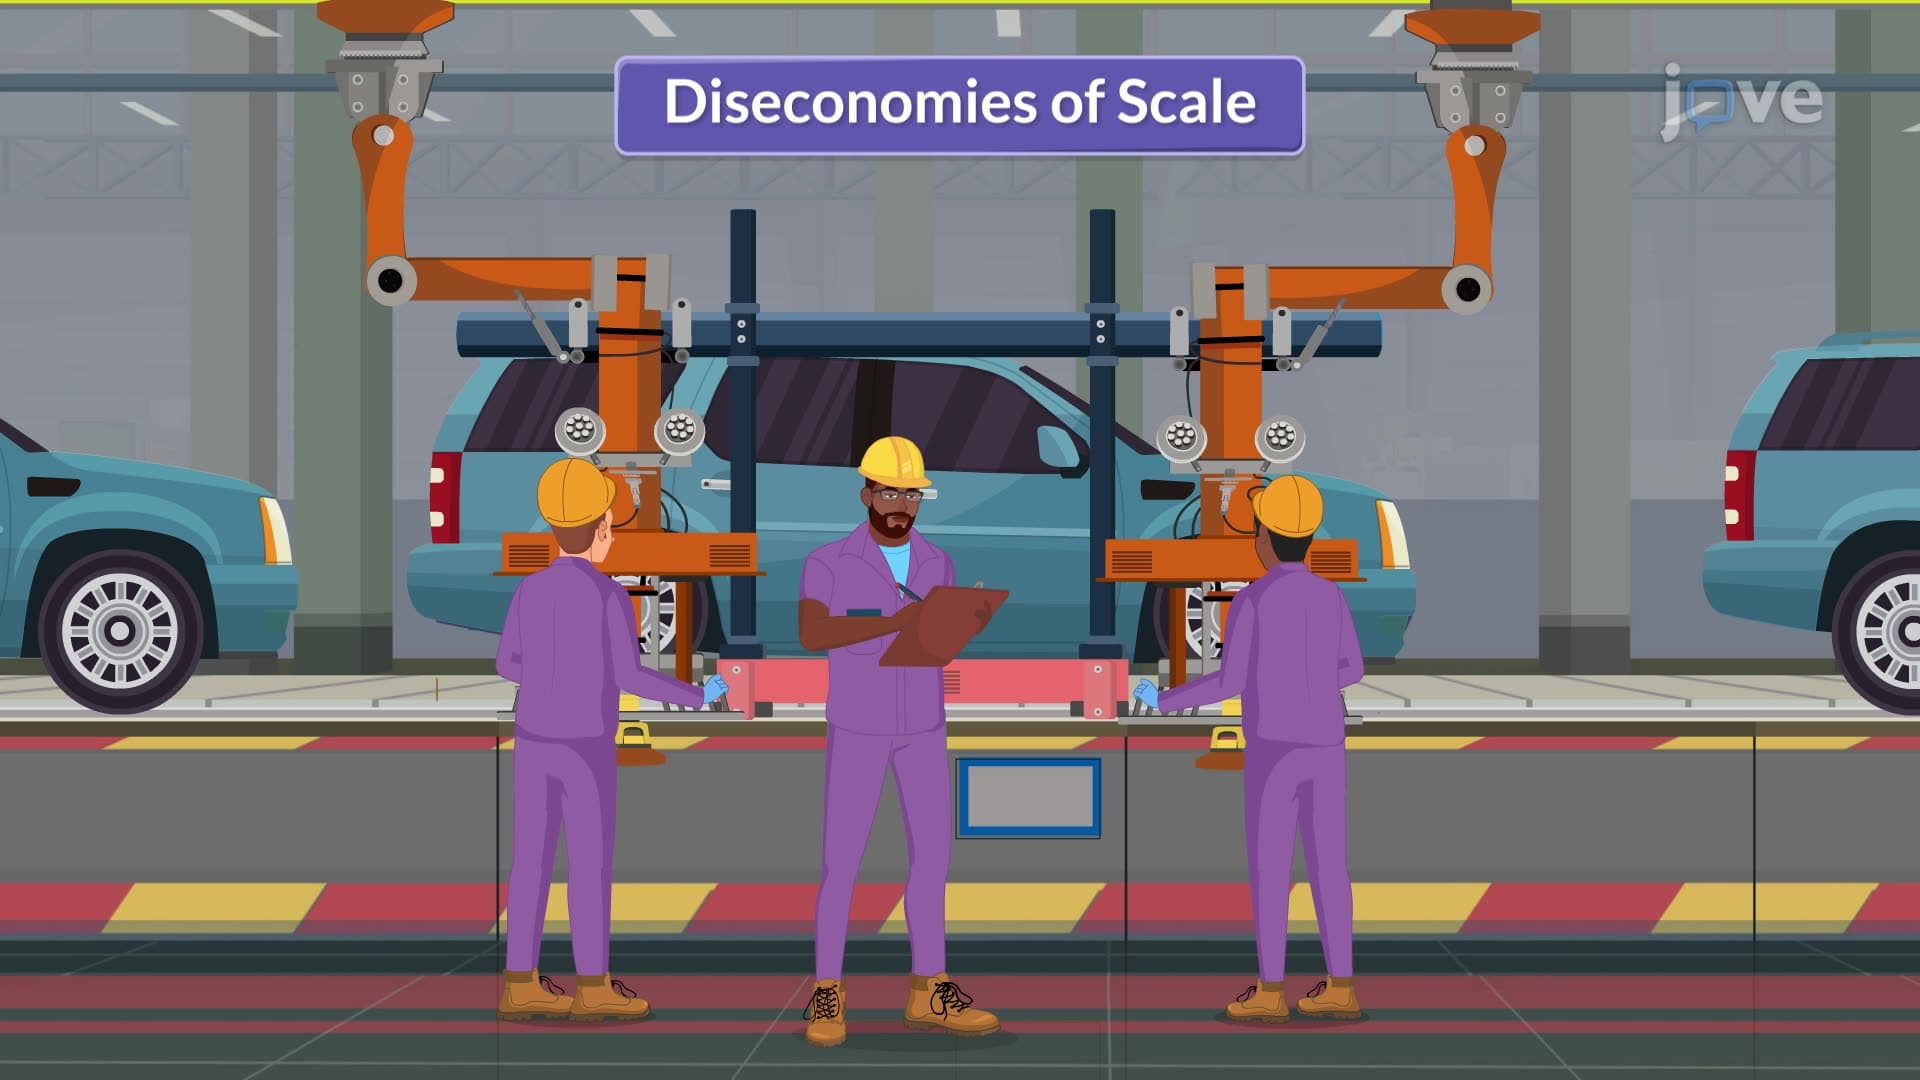
Average variable cost (AVC) follows a U-shaped pattern reflecting real production constraints. Initially, businesses experience increasing returns to scale-adding workers to an understaffed Tesla assembly line increases efficiency dramatically. However, diminishing returns eventually emerge as additional workers crowd existing equipment and workspace.
This transition from increasing to diminishing returns creates the characteristic U-shape seen across industries from agriculture to technology. The minimum point of the AVC curve represents optimal efficiency in variable resource utilization.
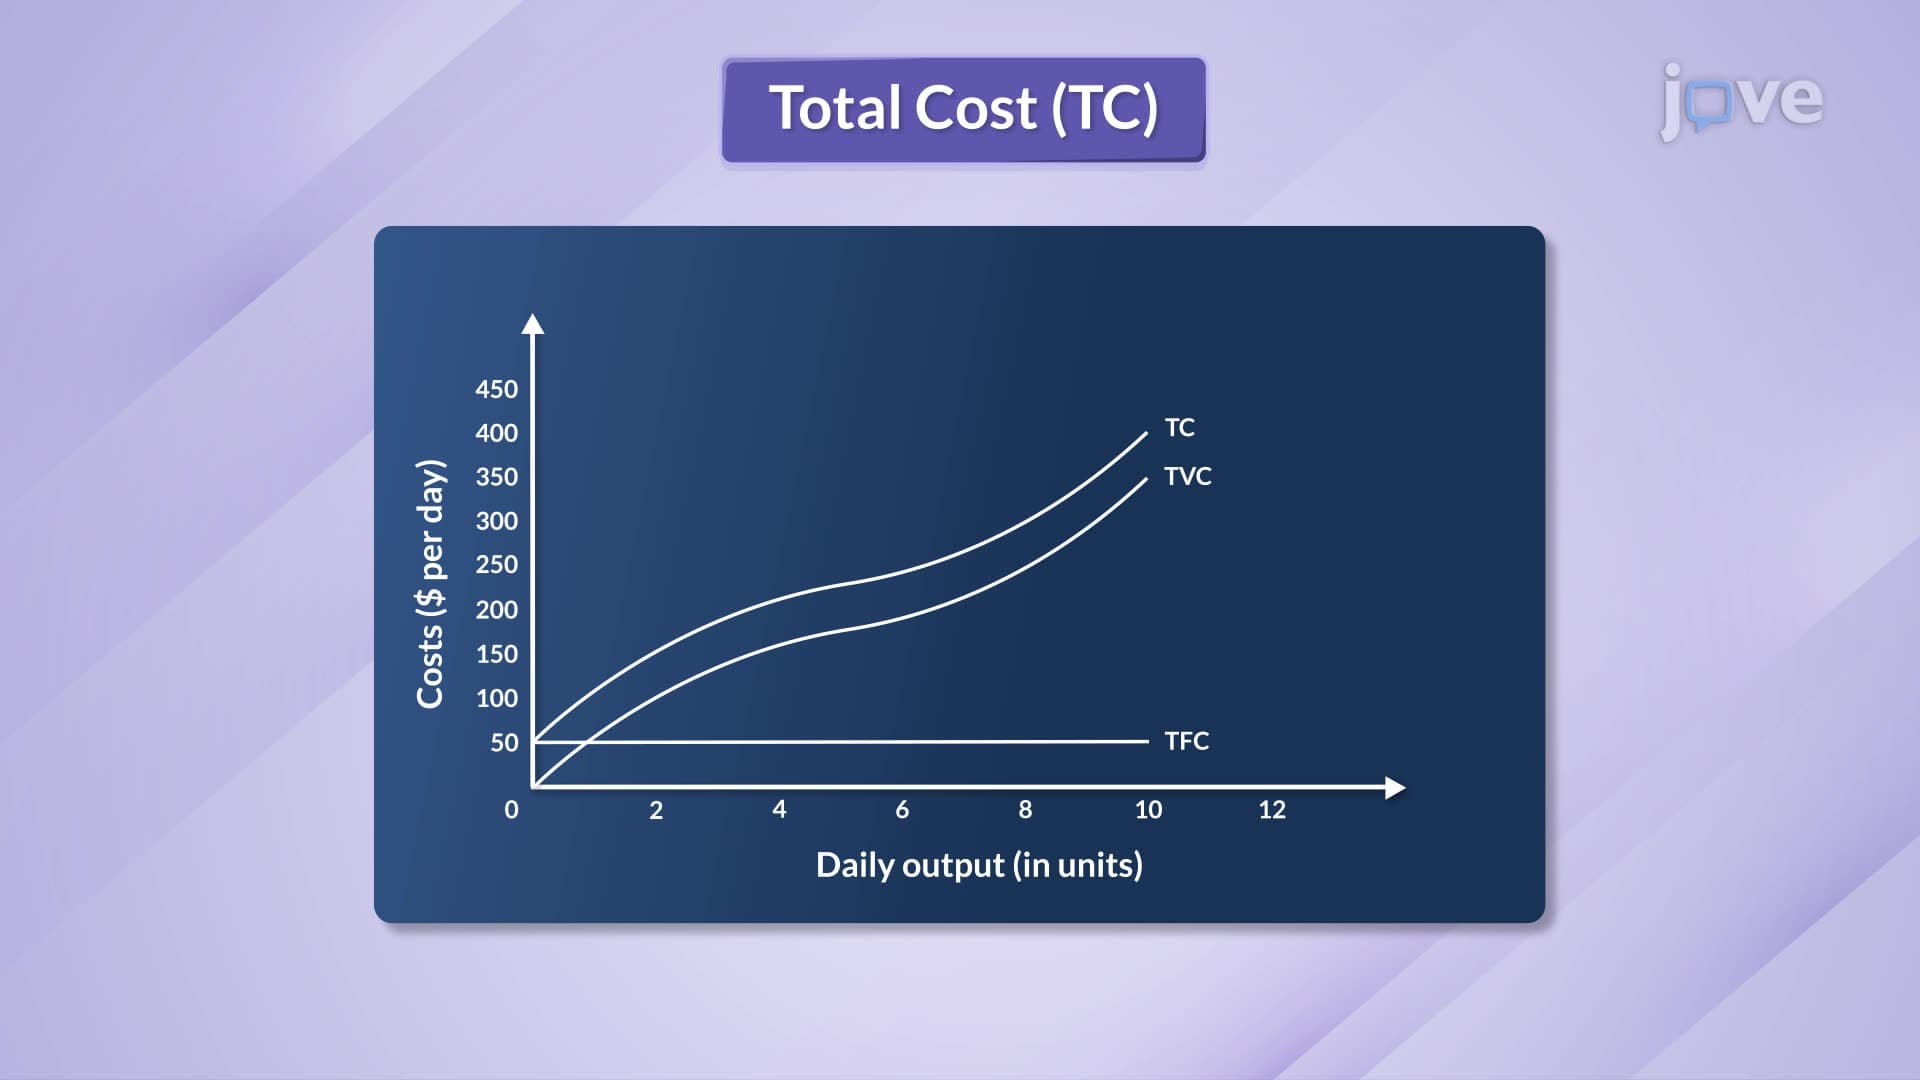
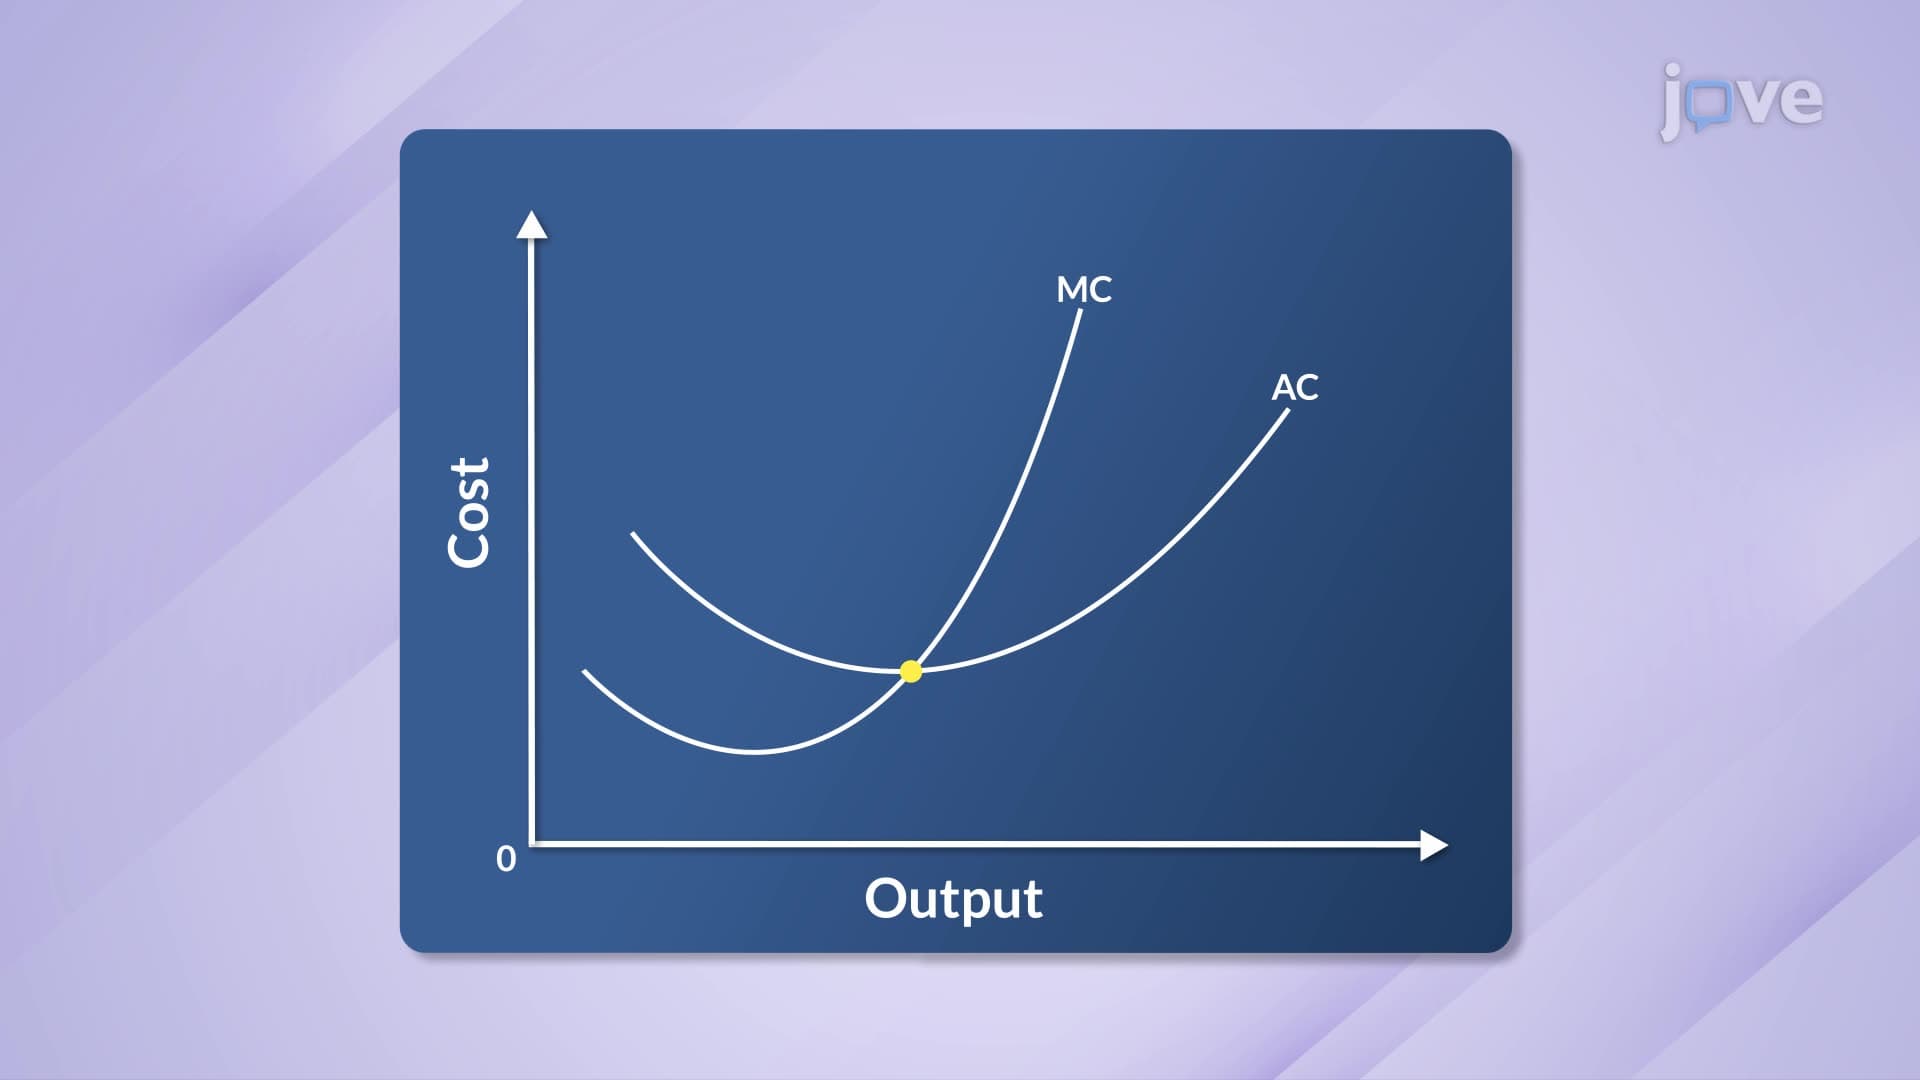
Average total cost (ATC) combines both fixed and variable components: ATC = AFC + AVC. The resulting curve exhibits fascinating behavior-it continues declining even after AVC begins rising because AFC's rapid decrease initially outweighs AVC's increase.
Eventually, rising variable costs dominate declining fixed costs, causing ATC to increase and form its own U-shape. This inflection point determines optimal production scales for companies like General Motors, where automotive plants operate most efficiently at specific output levels.
These cost relationships appear prominently in AP Economics exams and college microeconomics courses. Students encounter problems involving firms like Apple determining iPhone production quantities or analyzing why Starbucks locations require minimum customer volumes to remain profitable.
Understanding these curves helps explain why Walmart dominates retail through scale advantages, why startup companies often operate at losses initially, and how manufacturing firms determine facility sizes and production targets.
Related Micro-courses