Loading video…


 14 Concepts
 5.9K views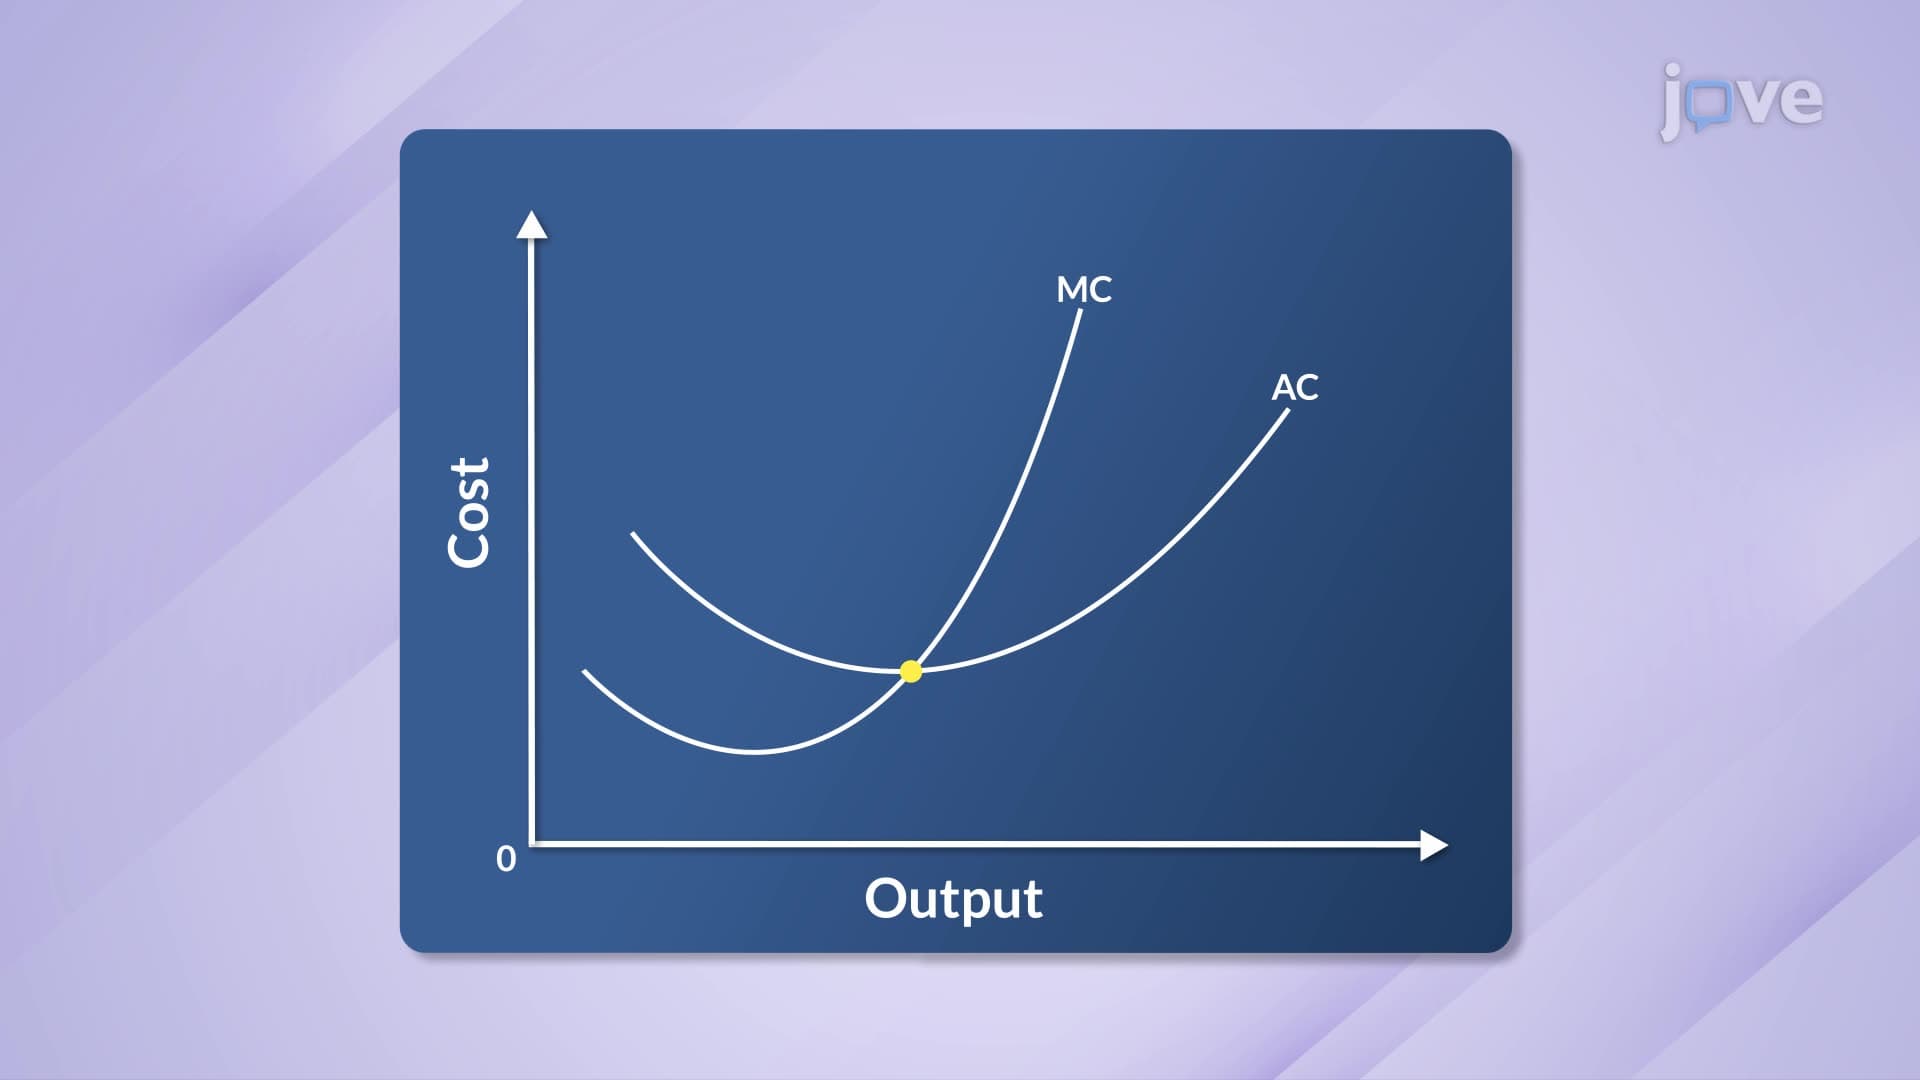

Video Summary: Relationship Between Average and Marginal Costs Explained
Why does McDonald's sometimes lose money on every Big Mac sold during lunch rush, yet still maximize profits? The relationship between average marginal costs reveals this counterintuitive business reality. When Ford Motor Company decides whether to produce one more F-150 truck, understanding the Relationship Between Average And Marginal Costs Explained becomes crucial for profitability decisions. This fundamental economic principle shows how production costs behave as output changes, directly impacting pricing strategies and operational efficiency. Watch the full video on JoVE Coach to master this concept with expert-led visuals and step-by-step explanations.
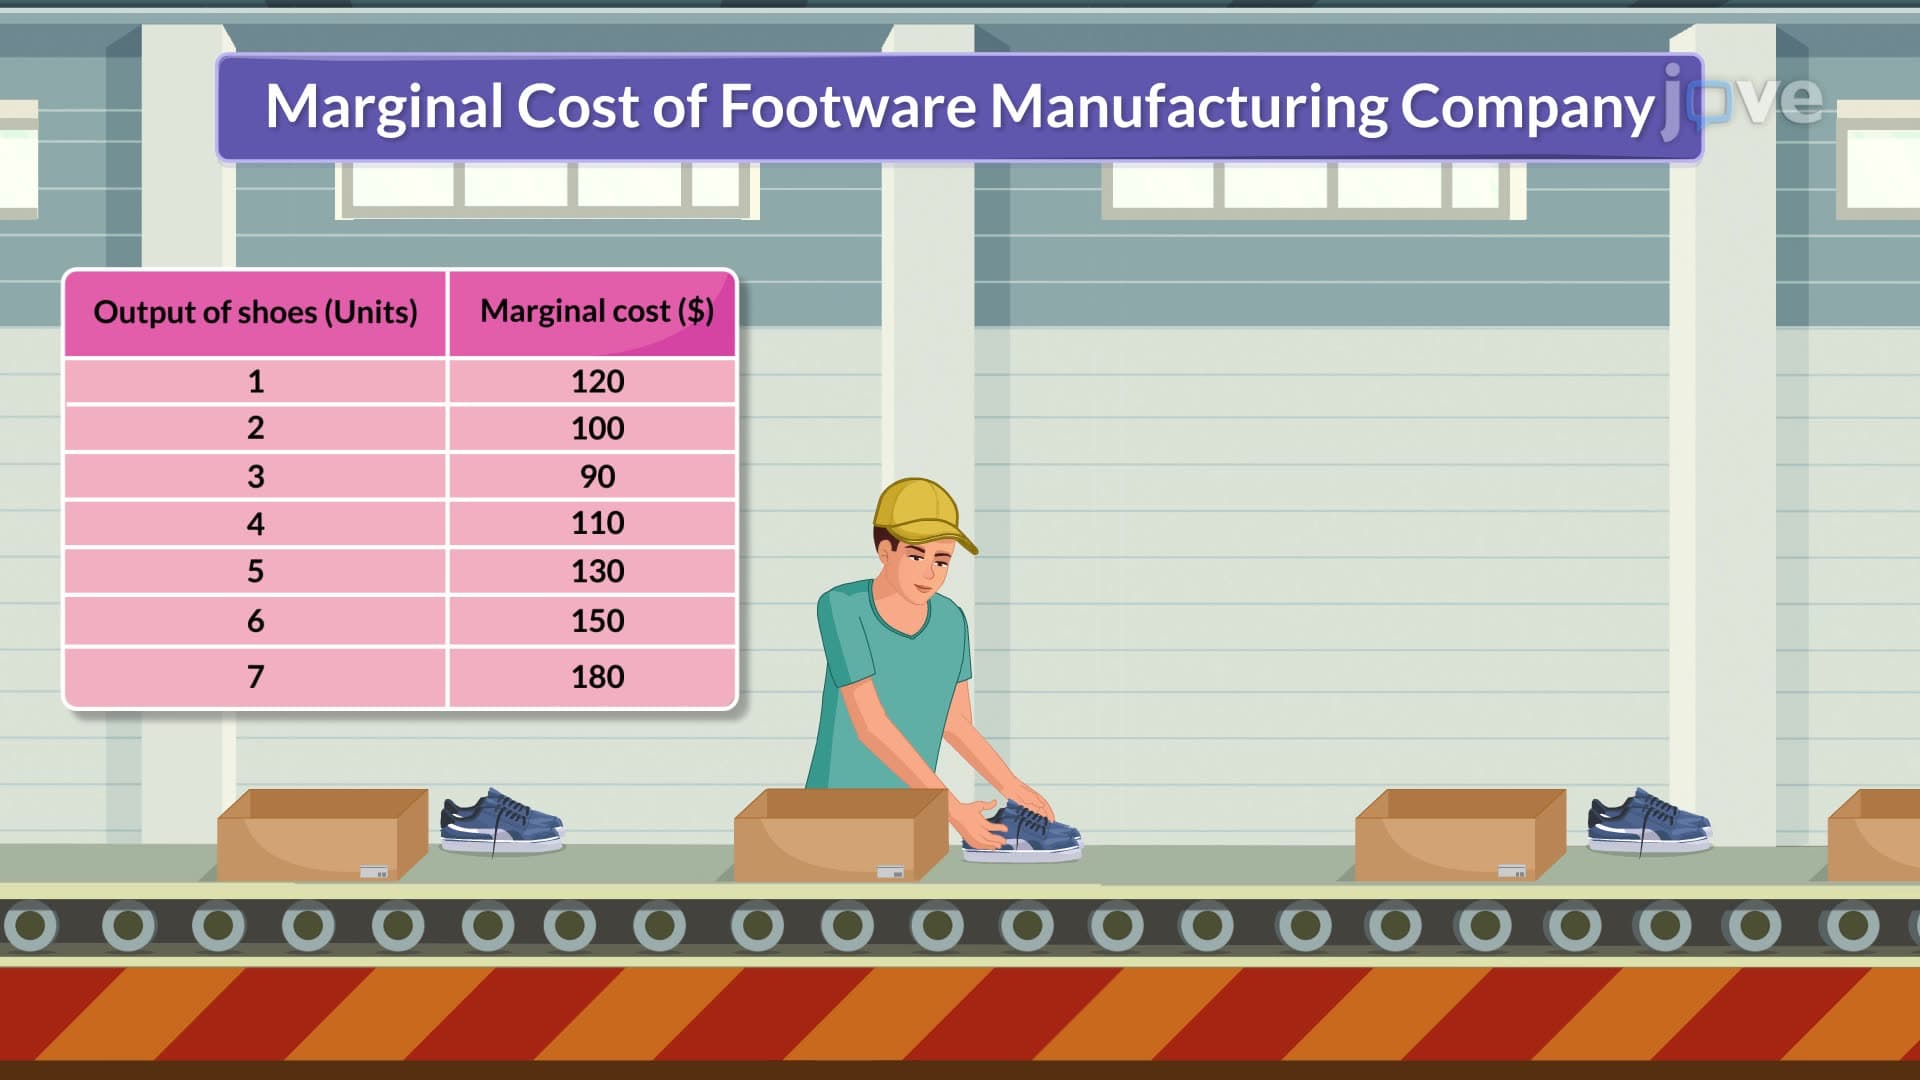
The economic relationship between average and marginal costs forms a cornerstone of microeconomic theory and business decision-making. Average cost represents the total cost per unit produced, calculated by dividing total costs by quantity produced. Marginal cost, conversely, measures the additional expense incurred when producing one more unit. This relationship between average and marginal costs creates predictable patterns that guide production efficiency.
Phase 1: Marginal Cost Below Average Cost During initial production stages, marginal cost typically falls below average cost due to economies of scale. Fixed costs like factory rent and equipment are spread across more units, reducing per-unit expenses. For example, Boeing's aircraft manufacturing shows decreasing average costs as they produce more 737s, since research and development costs are distributed over larger quantities. This phase continues until production reaches optimal efficiency.
Phase 2: The Critical Intersection Point The intersection where marginal cost equals average cost represents the minimum point of the average cost curve-the most efficient production scale. At General Motors' assembly plants, this intersection indicates the optimal daily vehicle production that minimizes per-unit costs. Understanding what is relationship between average and marginal costs at this critical juncture helps managers identify peak operational efficiency.
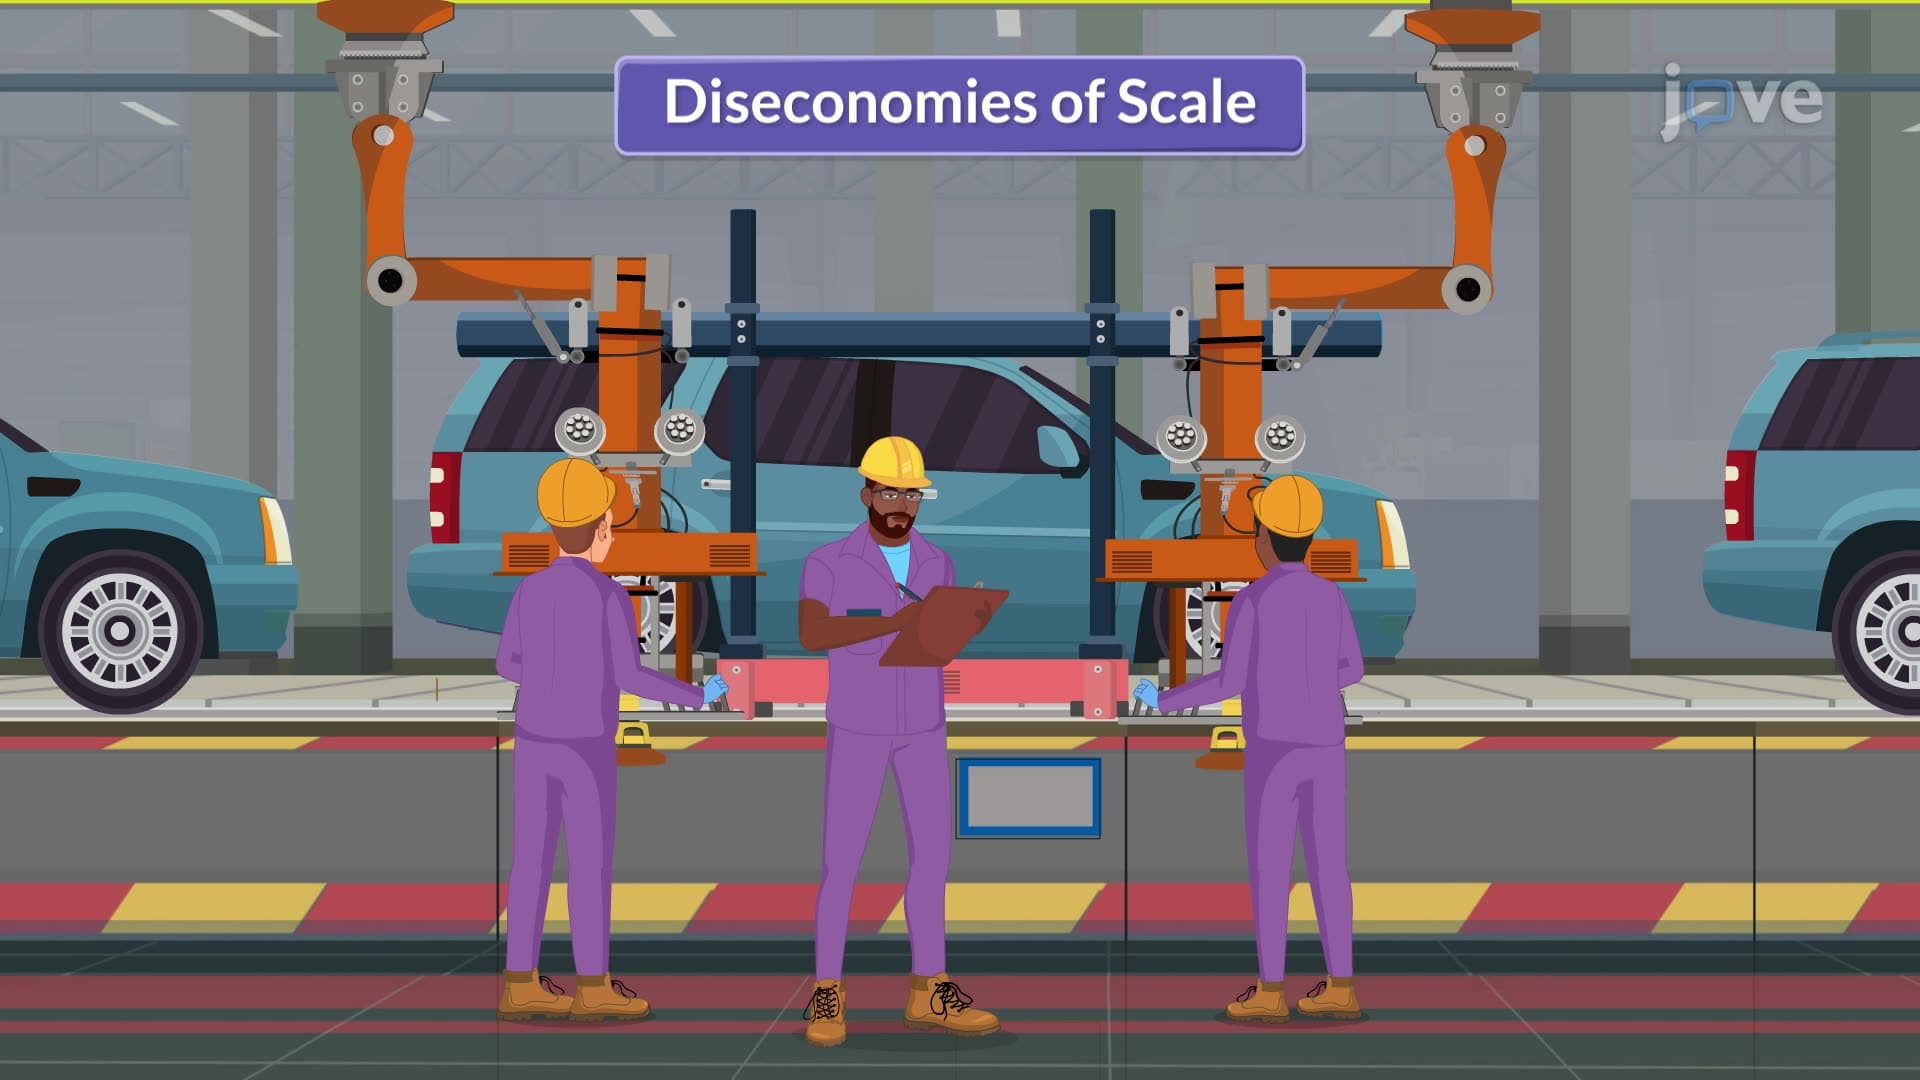
Phase 3: Marginal Cost Above Average Cost Beyond the intersection point, marginal cost exceeds average cost, causing average costs to rise. This occurs due to capacity constraints, overtime wages, and diminishing returns. Amazon's fulfillment centers experience this during peak holiday seasons when additional orders become increasingly expensive to process, demonstrating how the relationship between average and marginal costs concept explained applies to service industries.
This concept frequently appears on AP Microeconomics exams and college economics assessments. Students should memorize that marginal cost always intersects average cost at the latter's minimum point. The relationship between average and marginal costs study guide typically emphasizes graphical analysis, requiring students to identify cost curve intersections and explain their economic significance.
Business applications include pricing strategies, production planning, and capacity utilization decisions. Companies use these relationships to determine optimal output levels, evaluate expansion opportunities, and set competitive prices while maintaining profitability.
Related Micro-courses