Loading video…


 12 Concepts
 5.3K views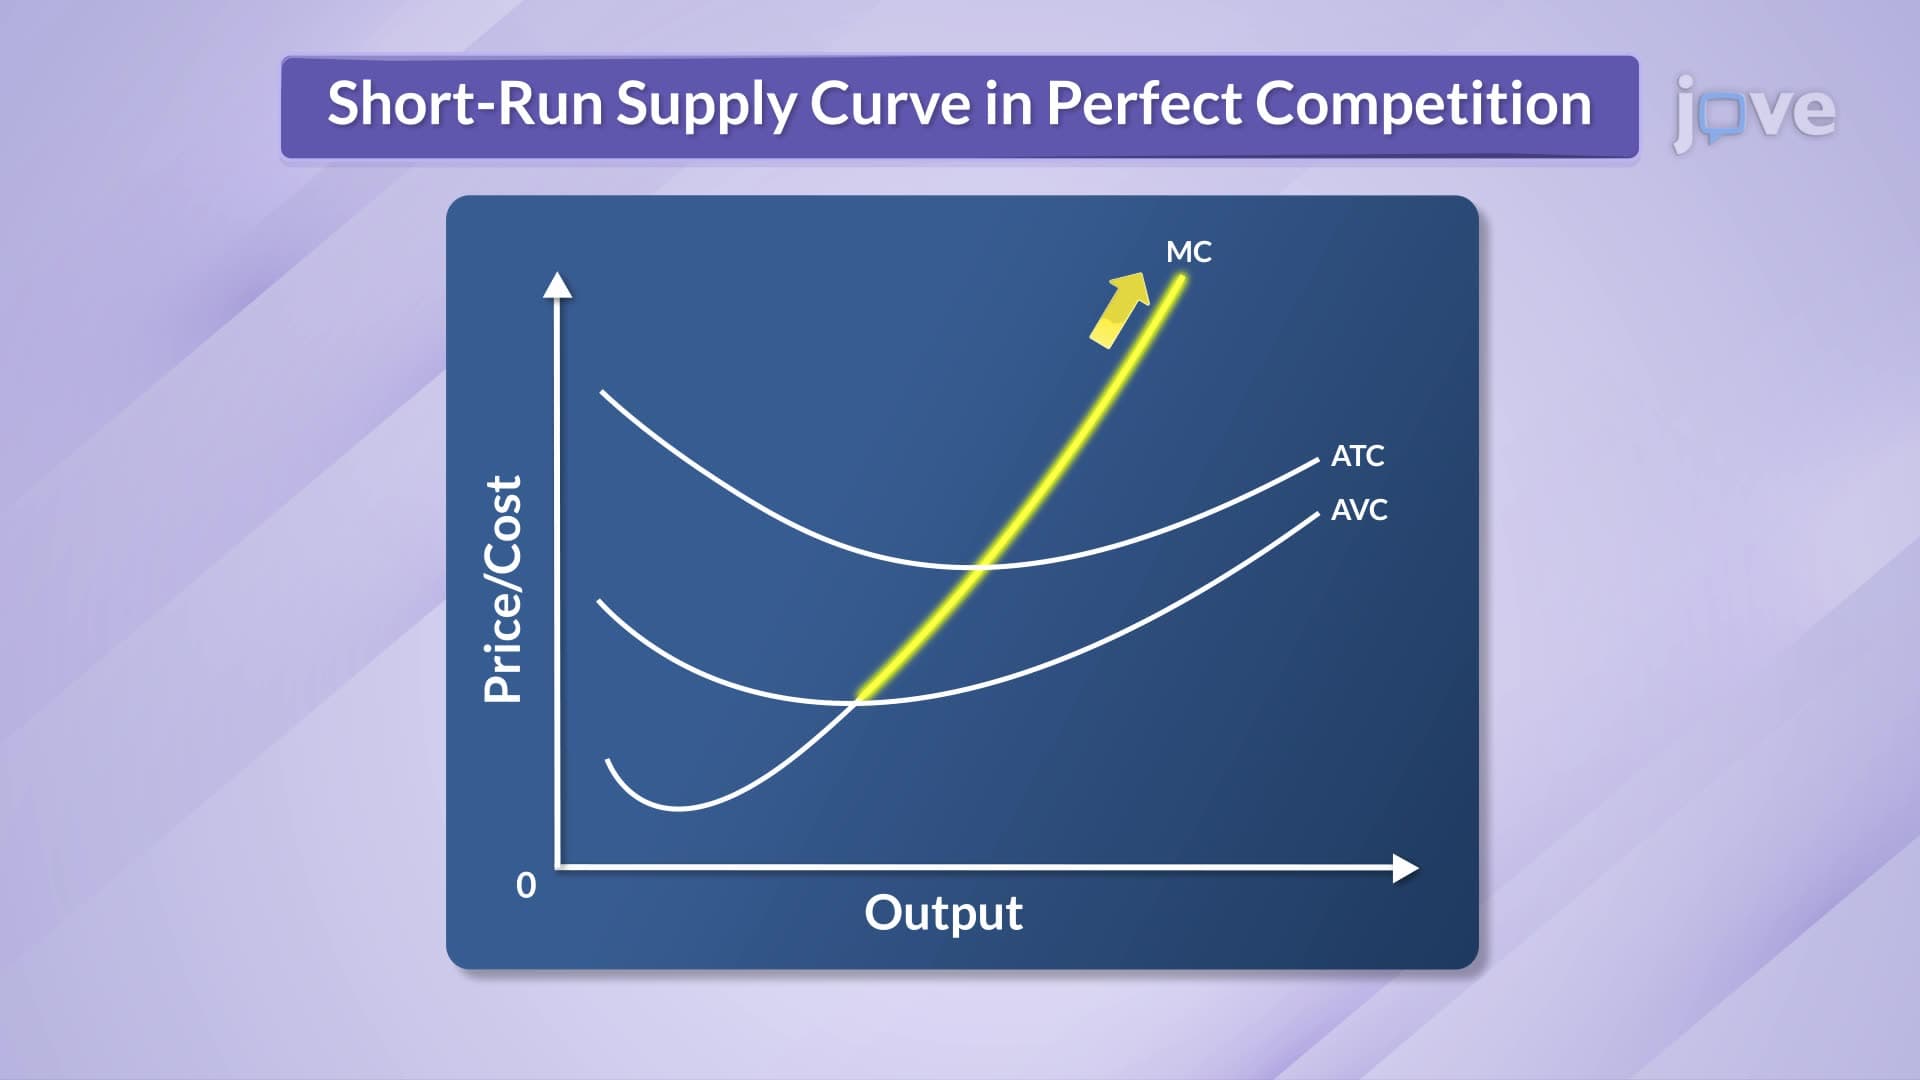

Video Summary: What Is Short Run Supply Curve
Why do gas stations sometimes shut down temporarily when oil prices spike dramatically? The short run supply curve explains this puzzling business behavior in perfectly competitive markets. This economic concept shows how firms like local bakeries or coffee shops decide their production levels based on market prices and variable costs. For instance, a small-town diner might temporarily close during peak ingredient cost periods rather than operate at a loss. The short run supply curve definition explained reveals that firms only produce when they can cover their variable expenses, creating a critical shutdown point below minimum average variable cost. Watch the full video on JoVE Coach to master this concept with expert-led visuals and step-by-step explanations.
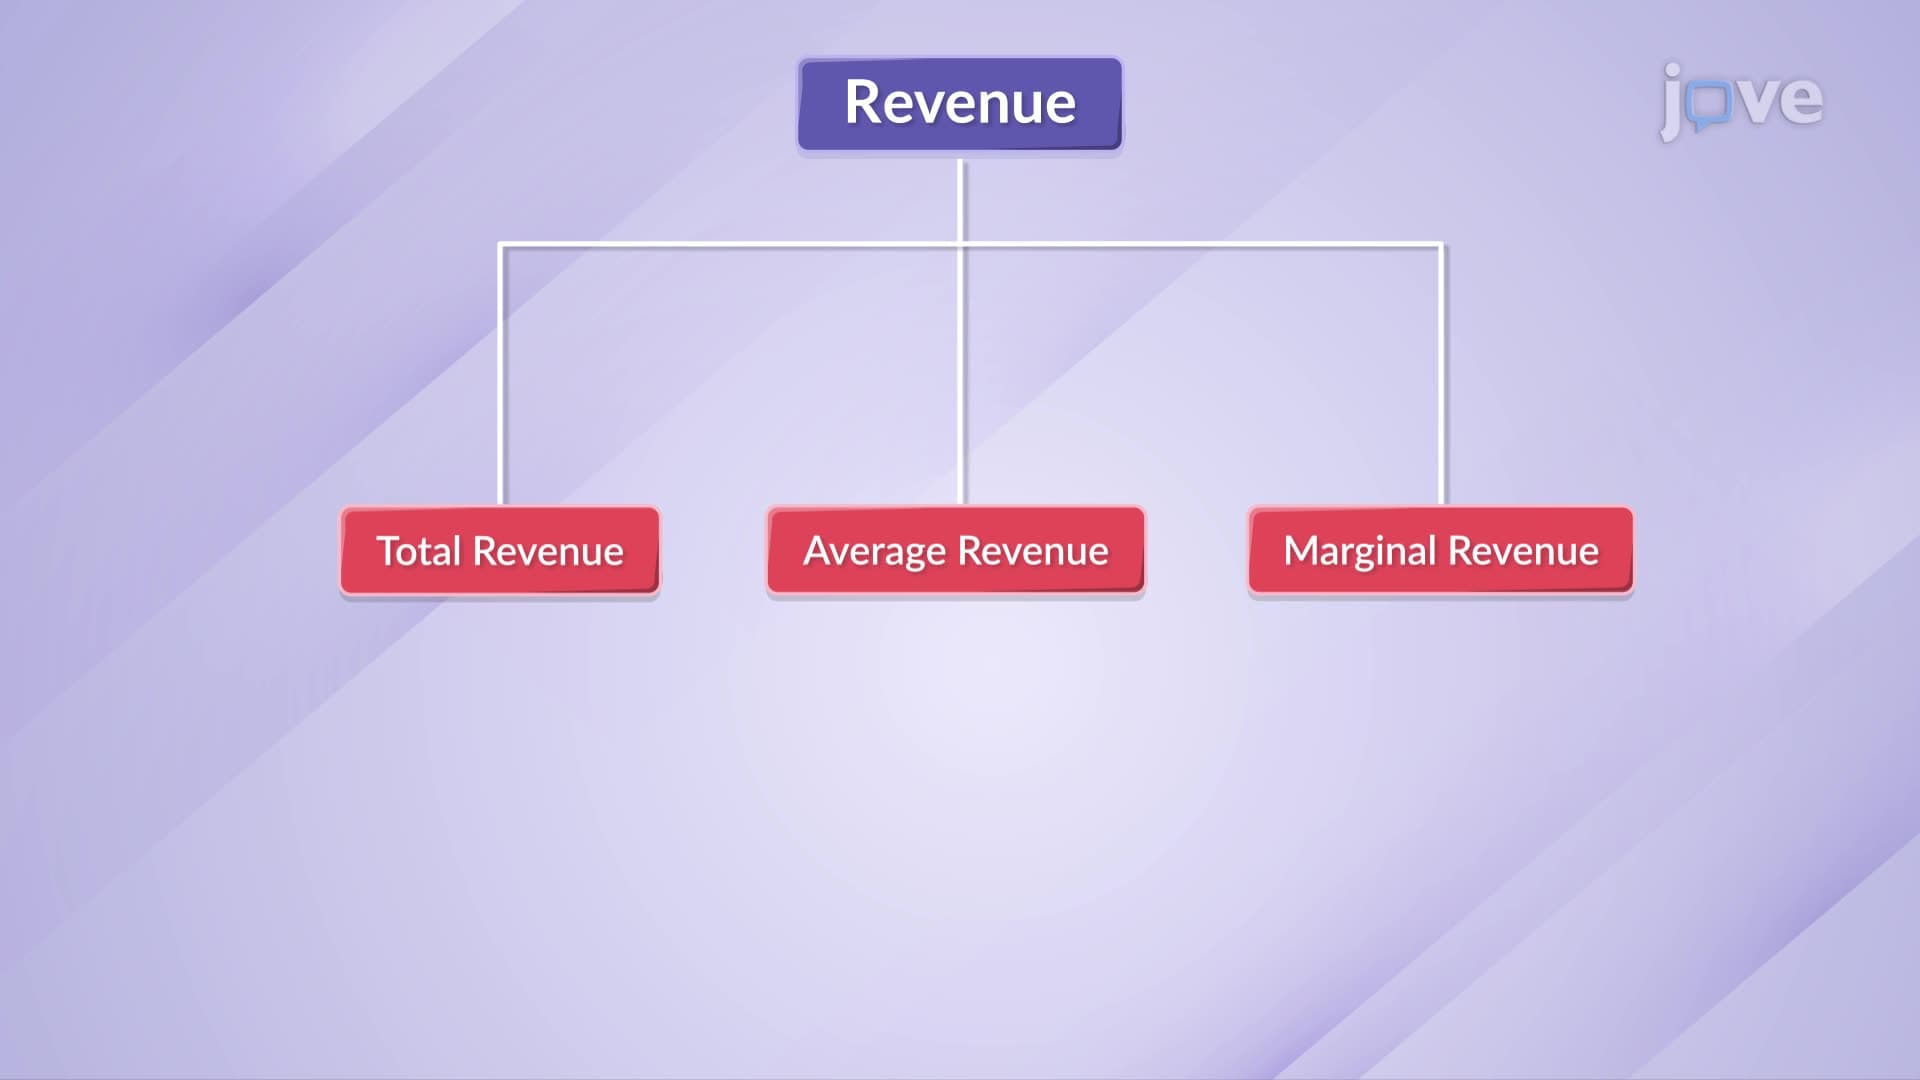
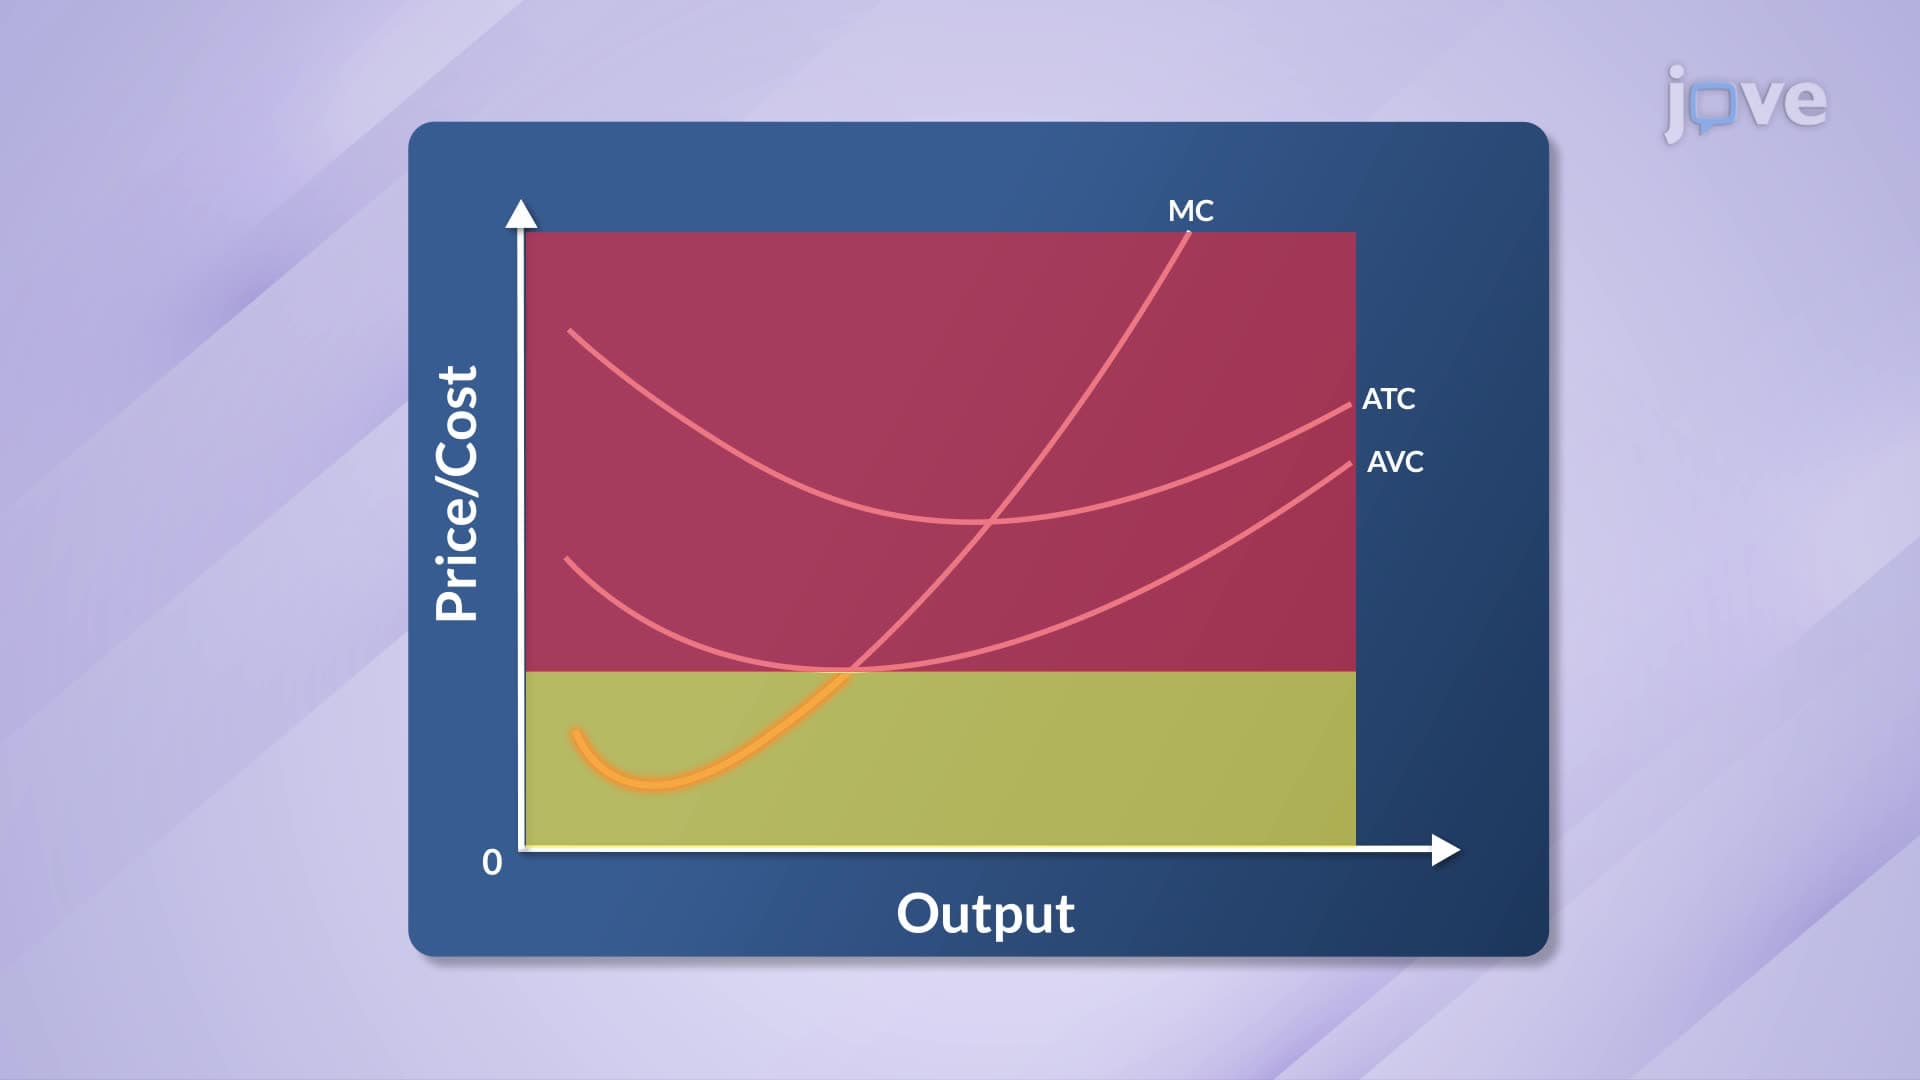
The short run supply curve represents one of microeconomics' most practical concepts, showing exactly how individual firms respond to changing market conditions. In perfect competition, this curve isn't arbitrary-it directly corresponds to the portion of a firm's marginal cost (MC) curve that lies above the minimum point of average variable cost (AVC). This relationship makes intuitive sense: rational businesses only produce when they can at least cover their variable expenses like labor, materials, and utilities.
Consider McDonald's franchise operations during the 2008 financial crisis. Many locations faced the decision of whether to maintain full operating hours as customer demand plummeted. The short run supply curve concept explains why some franchises reduced hours or temporarily closed-when expected revenue per unit falls below variable costs per unit, continuing production only deepens losses.
The shutdown point occurs where price equals minimum average variable cost. Below this threshold, firms cease production entirely, making their quantity supplied zero. This creates the distinctive shape where the supply curve includes a vertical segment along the price axis below the shutdown point, then follows the marginal cost curve above it.
For AP Economics students, this concept frequently appears in free-response questions asking about firm behavior during market downturns. College microeconomics courses often test this through numerical problems where students must calculate the exact shutdown price and determine optimal production levels.
Input price fluctuations cause the entire short run supply curve to shift. When Starbucks faces rising coffee bean costs, their marginal cost curve shifts upward, reducing profit-maximizing quantities at every price level. Conversely, when technology improvements reduce production costs-like automated ordering systems reducing labor needs-the supply curve shifts rightward.
Understanding these shifts proves crucial for SAT Subject Test Economics and college midterm examinations, where students must distinguish between movements along supply curves versus shifts of entire curves.
American agricultural markets provide excellent examples of short run supply curve dynamics. Corn farmers during the 2012 drought faced dramatically increased irrigation costs (higher input prices), shifting their supply curves upward. Some smaller operations temporarily ceased planting rather than guarantee losses, demonstrating the shutdown point in action.
Similarly, rideshare drivers exemplify modern short run supply decisions. When gas prices spike rapidly, some Uber and Lyft drivers temporarily stop driving rather than earn negative returns after covering vehicle expenses-a perfect illustration of rational shutdown behavior.
Related Micro-courses