Loading video…


 7 Concepts
 4.3K views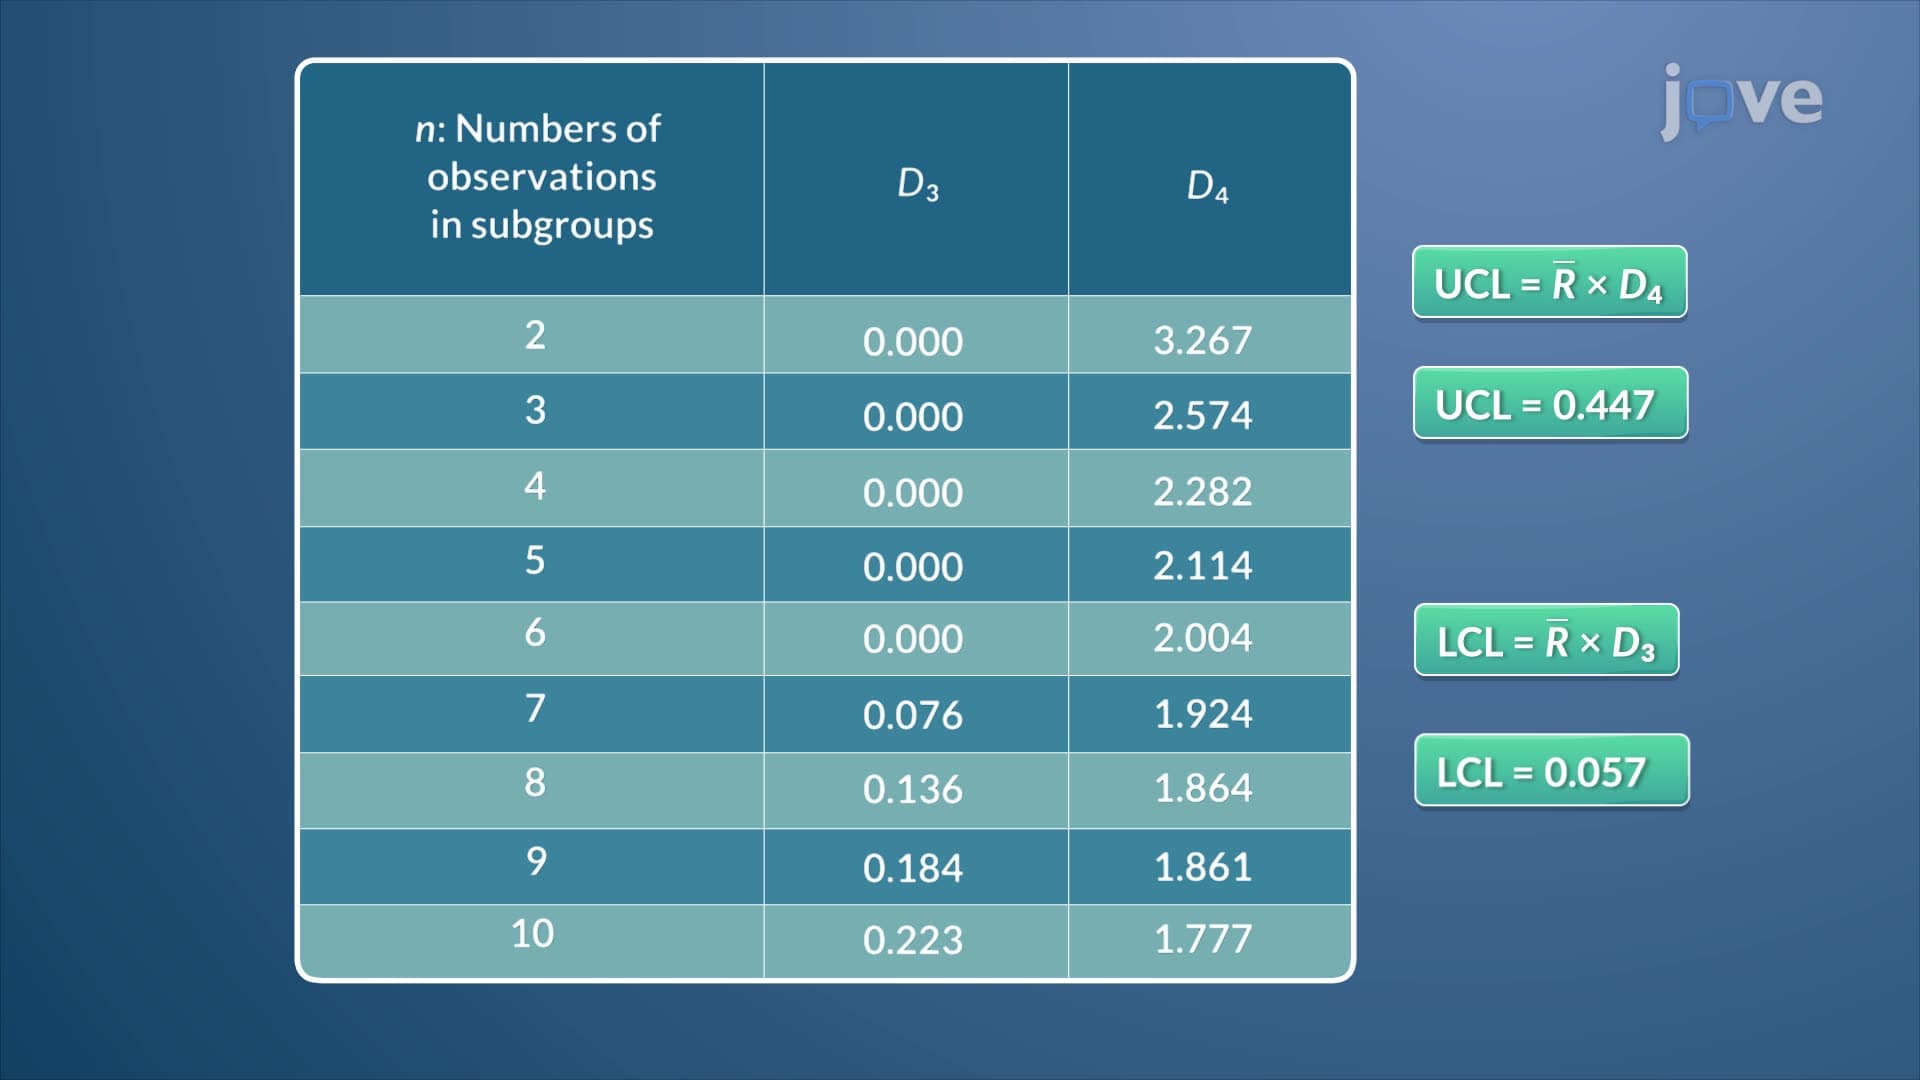

Video Summary: What Is Interpreting R Charts
Ever wondered how McDonald's ensures every batch of fries has consistent thickness? Interpreting R charts is the statistical quality control method that tracks process variability in manufacturing and production. This powerful tool helps companies like Boeing monitor aircraft part dimensions by calculating mean sample ranges and control limits. Understanding what is interpreting R charts enables you to assess whether process variation stays within acceptable bounds. Watch the full video on JoVE Coach to master this concept with expert-led visuals and step-by-step explanations.
Interpreting R charts represents a fundamental statistical process control technique used across American manufacturing industries. R charts specifically monitor the range (variability) within subgroups of data, making them essential for quality control in everything from pharmaceutical tablet weights at Pfizer to semiconductor thickness at Intel facilities.
The interpreting r charts definition centers on tracking how much variation exists within small samples taken from a production process. Unlike X-bar charts that monitor process averages, R charts focus exclusively on consistency-answering whether your process produces uniform results regardless of the average value.
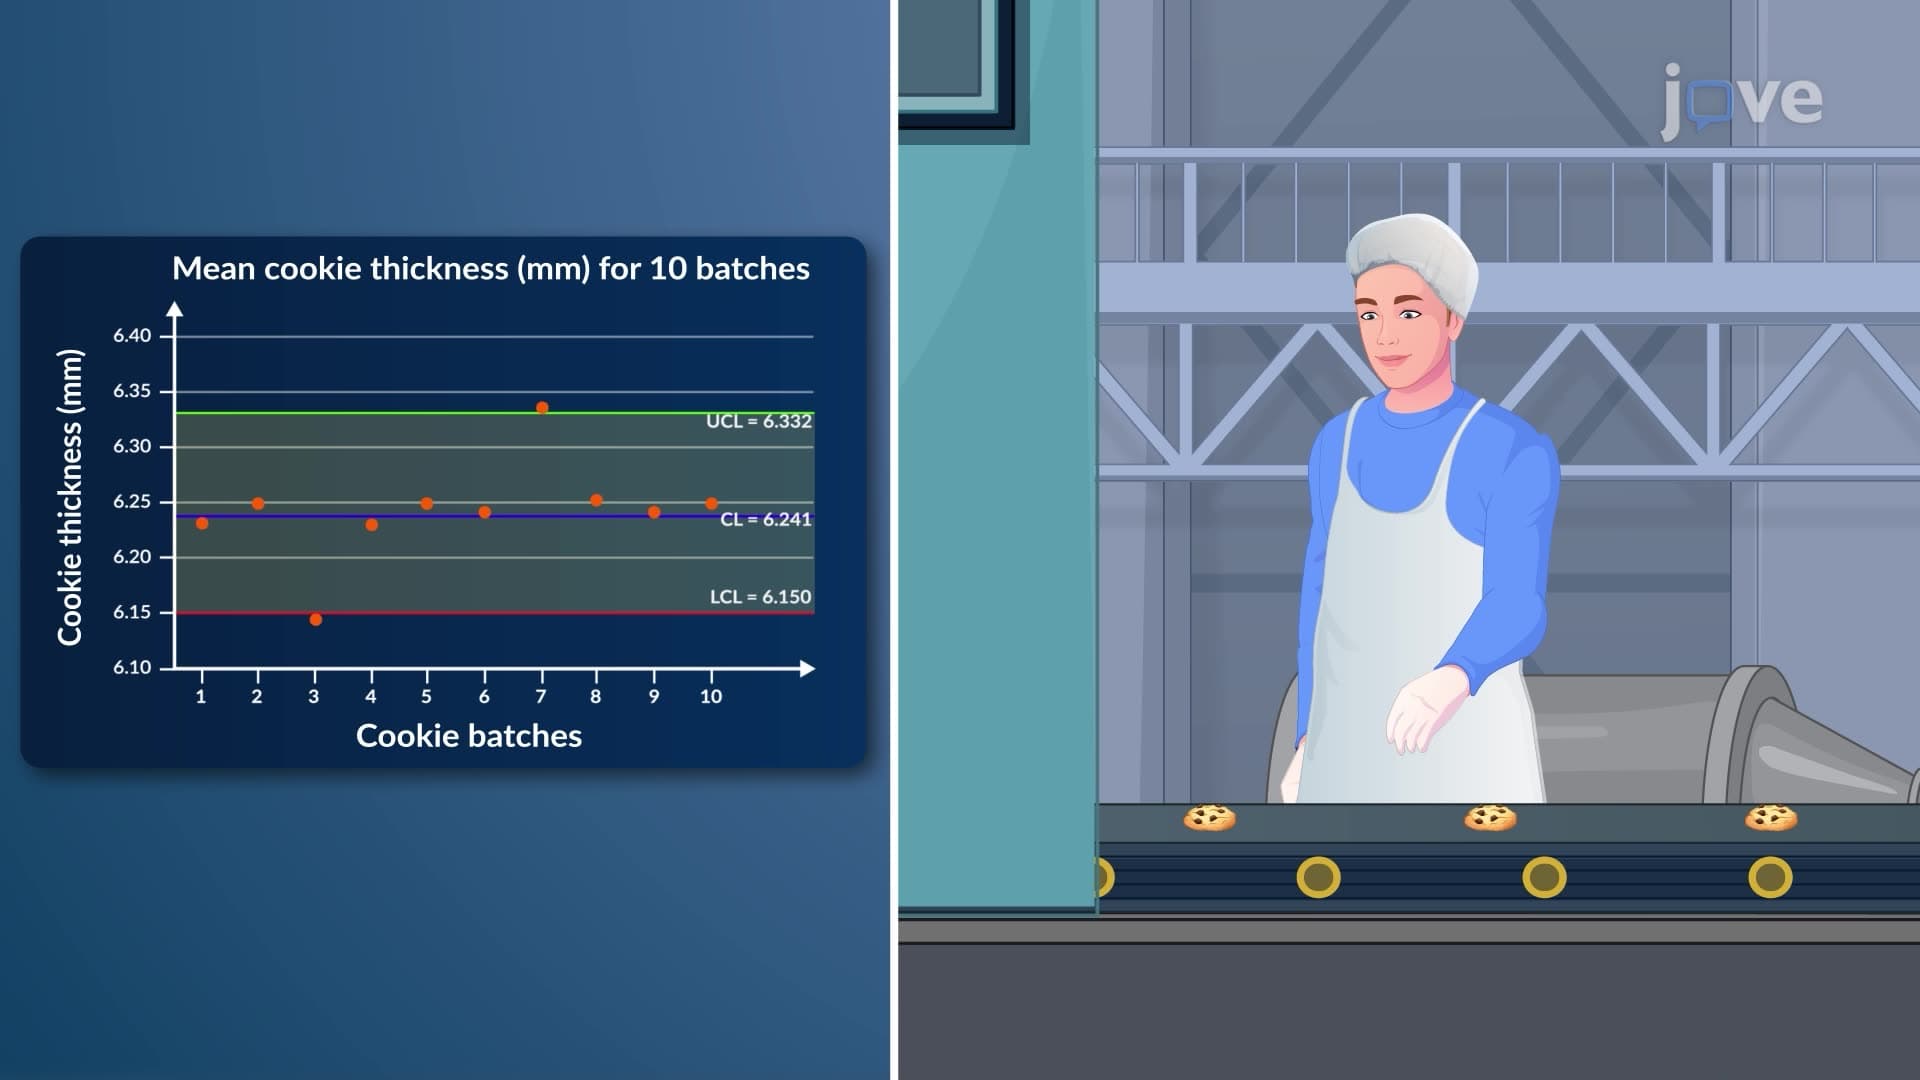
The interpreting r charts concept begins with collecting sample ranges from multiple subgroups. In the cookie thickness example, ten different batches provide range measurements that, when averaged, create the centerline value (R-bar = 0.252). This centerline represents the expected variability when the process operates normally.
For AP Statistics students, this connects directly to measures of spread you've studied. The range, while simpler than standard deviation, provides immediate insight into process consistency that quality engineers can act upon quickly.
What is interpreting r charts in detail involves understanding how control chart constants D3 and D4 establish boundaries for acceptable variation. These constants, found in standardized tables, depend entirely on subgroup size (n). For small samples (n < 6), D3 equals zero, meaning no lower control limit exists-a critical concept for SAT Subject Test Math Level 2.
The upper control limit (UCL) calculation multiplies R-bar by D4, while the lower control limit (LCL) uses D3. These boundaries, typically set at three standard deviations from the centerline, capture 99.73% of expected variation under normal conditions.
Major American manufacturers rely on interpreting r charts basics for critical quality decisions. General Motors uses R charts to monitor engine component tolerances, while Johnson & Johnson applies them to ensure consistent medication dosages. College-level industrial engineering courses emphasize how improper R chart interpretation can lead to costly recalls or safety issues.
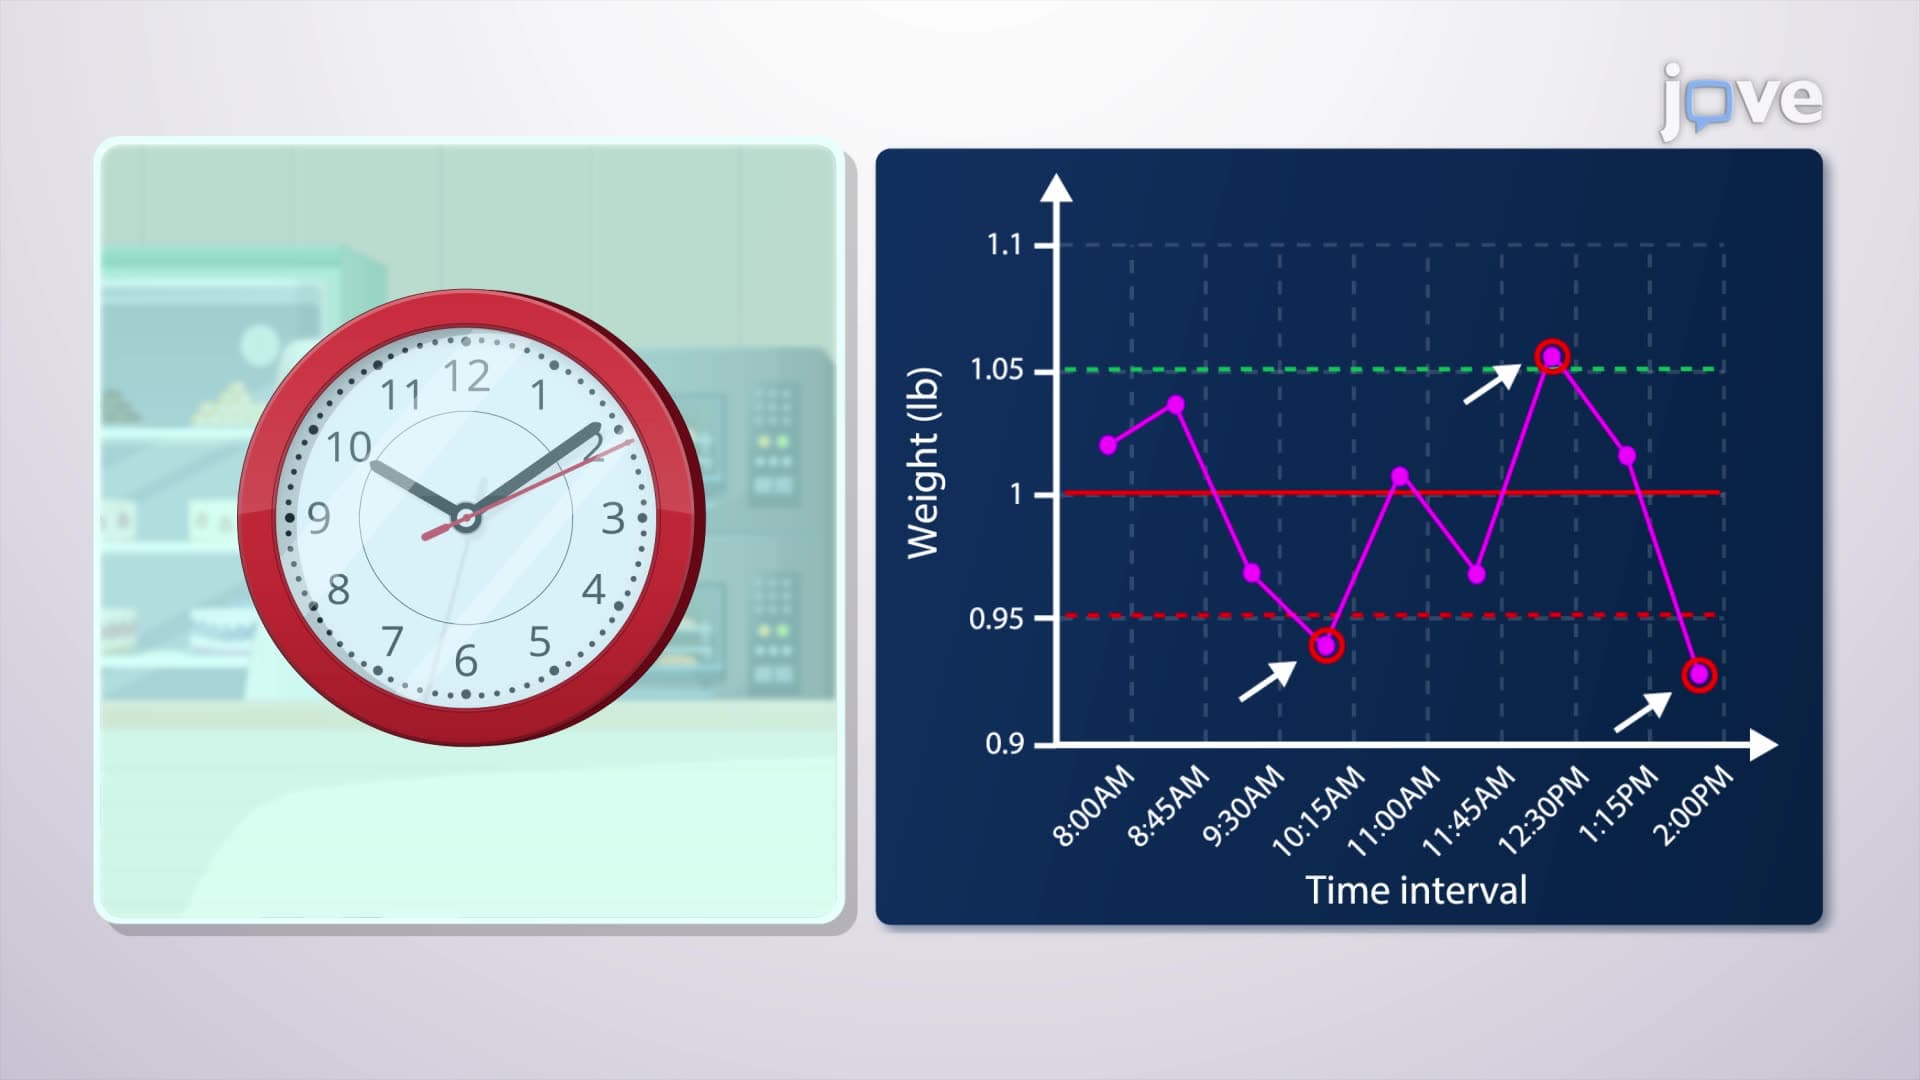
The interpreting r charts study guide approach emphasizes pattern recognition: seven consecutive points trending upward might indicate tool wear, while points beyond control limits suggest special causes requiring immediate investigation.
Related Micro-courses