Loading video…


 7 Concepts
 4.3K views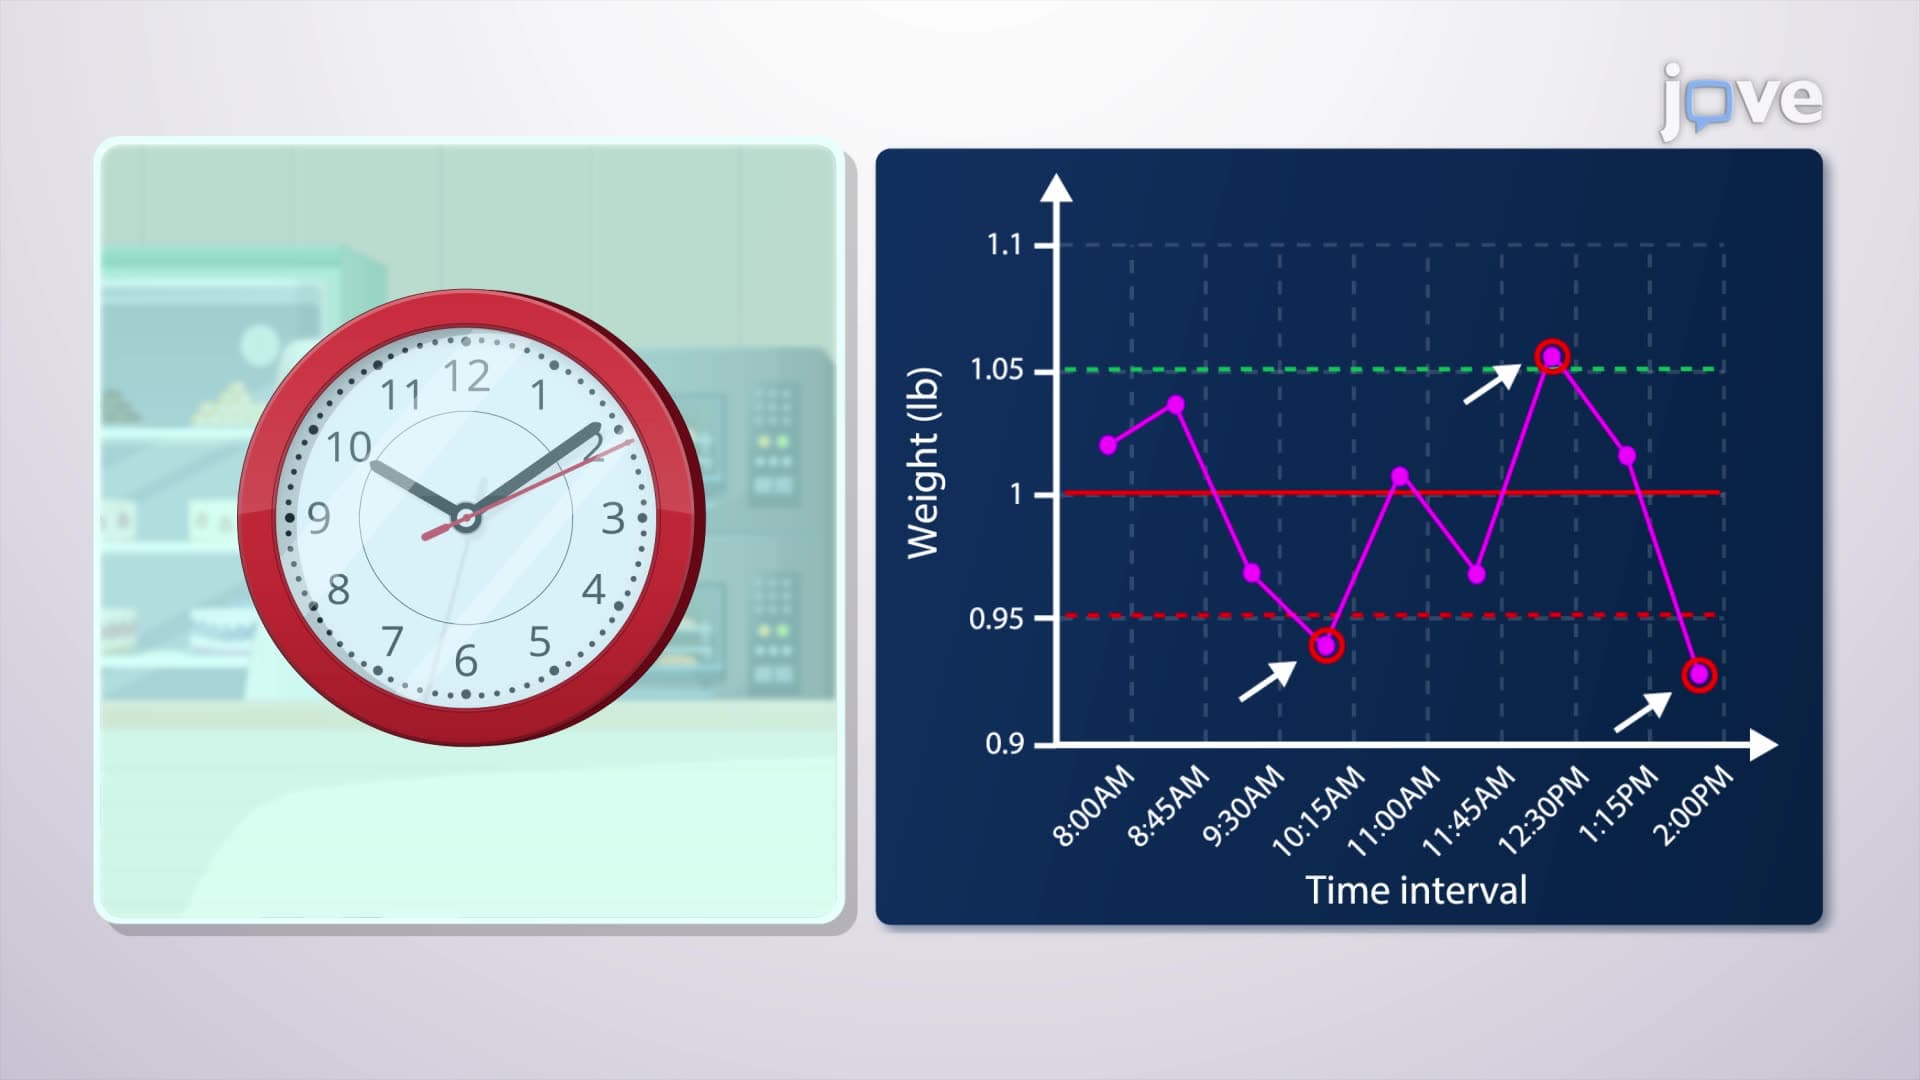

Video Summary: What Is the R Chart
Ever wonder how McDonald's keeps their french fries consistently golden and crispy across 13,500+ US locations? The R chart is a powerful statistical quality control tool that monitors variability within process subgroups, detecting when production deviates from acceptable ranges. Unlike simple trend charts, the R chart specifically tracks the spread or range of measurements-like how much individual fry cooking times vary from batch to batch-helping manufacturers identify process inconsistencies before they affect product quality. Watch the full video on JoVE Coach to master this concept with expert-led visuals and step-by-step explanations.
The R chart represents a cornerstone of statistical process control (SPC), specifically designed to monitor process variability rather than central tendency. While X-bar charts track average values, the R chart focuses exclusively on the range-the difference between the highest and lowest values within each subgroup. This dual approach provides manufacturers with comprehensive insight into both process centering and consistency.
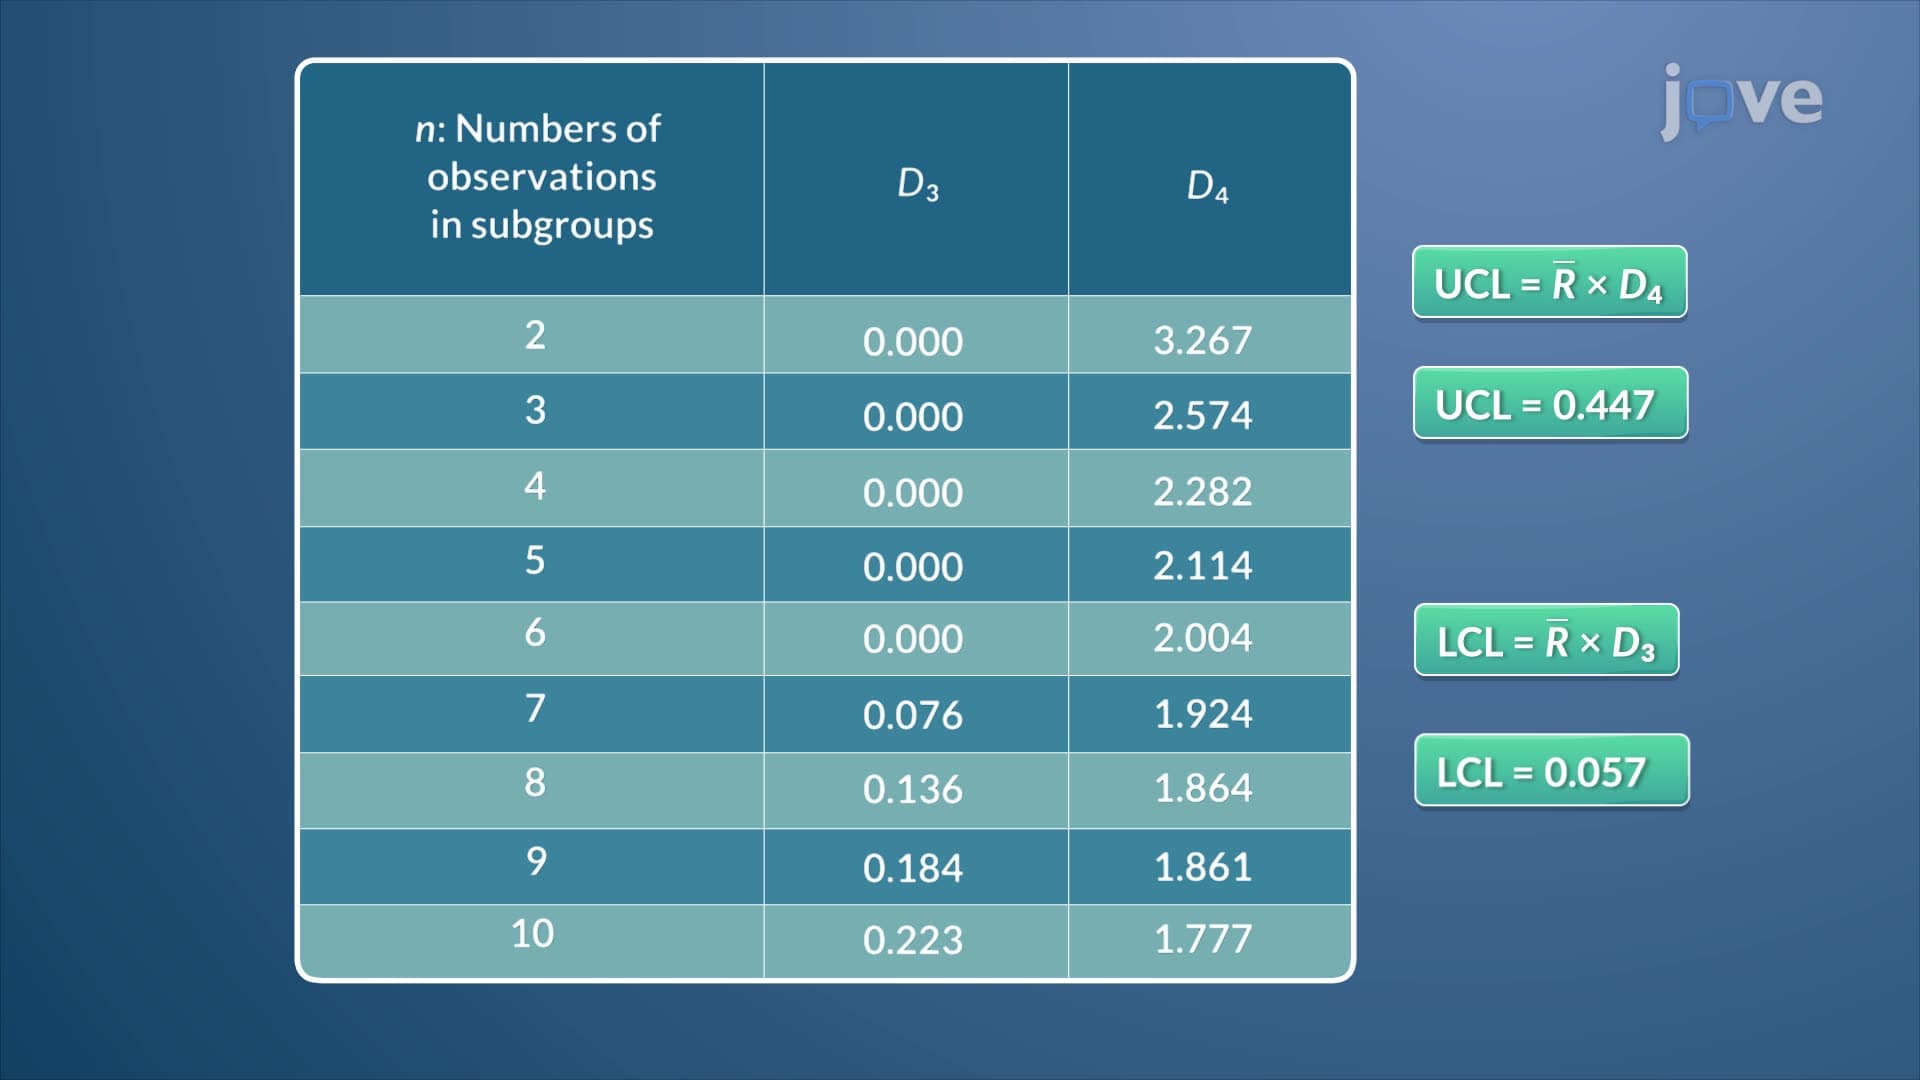
The mathematical foundation involves calculating ranges for consecutive subgroups of data points (typically 2-10 observations). The centerline represents R-bar, the average of all subgroup ranges, while control limits are set at approximately three standard deviations from this centerline using specific factors based on subgroup size.
Major US corporations rely heavily on R charts for quality assurance. Ford Motor Company uses R charts to monitor engine component tolerances, ensuring each cylinder bore diameter falls within acceptable variation limits. In pharmaceutical manufacturing, companies like Pfizer employ R charts to track tablet weight consistency, where excessive variation could indicate equipment malfunction or raw material inconsistencies.
Healthcare applications are equally critical. Hospital laboratories use R charts to monitor blood test precision, where high variability in duplicate analyses might signal instrument calibration issues. The FDA requires pharmaceutical manufacturers to demonstrate process control through tools like R charts as part of Good Manufacturing Practices (GMP) compliance.
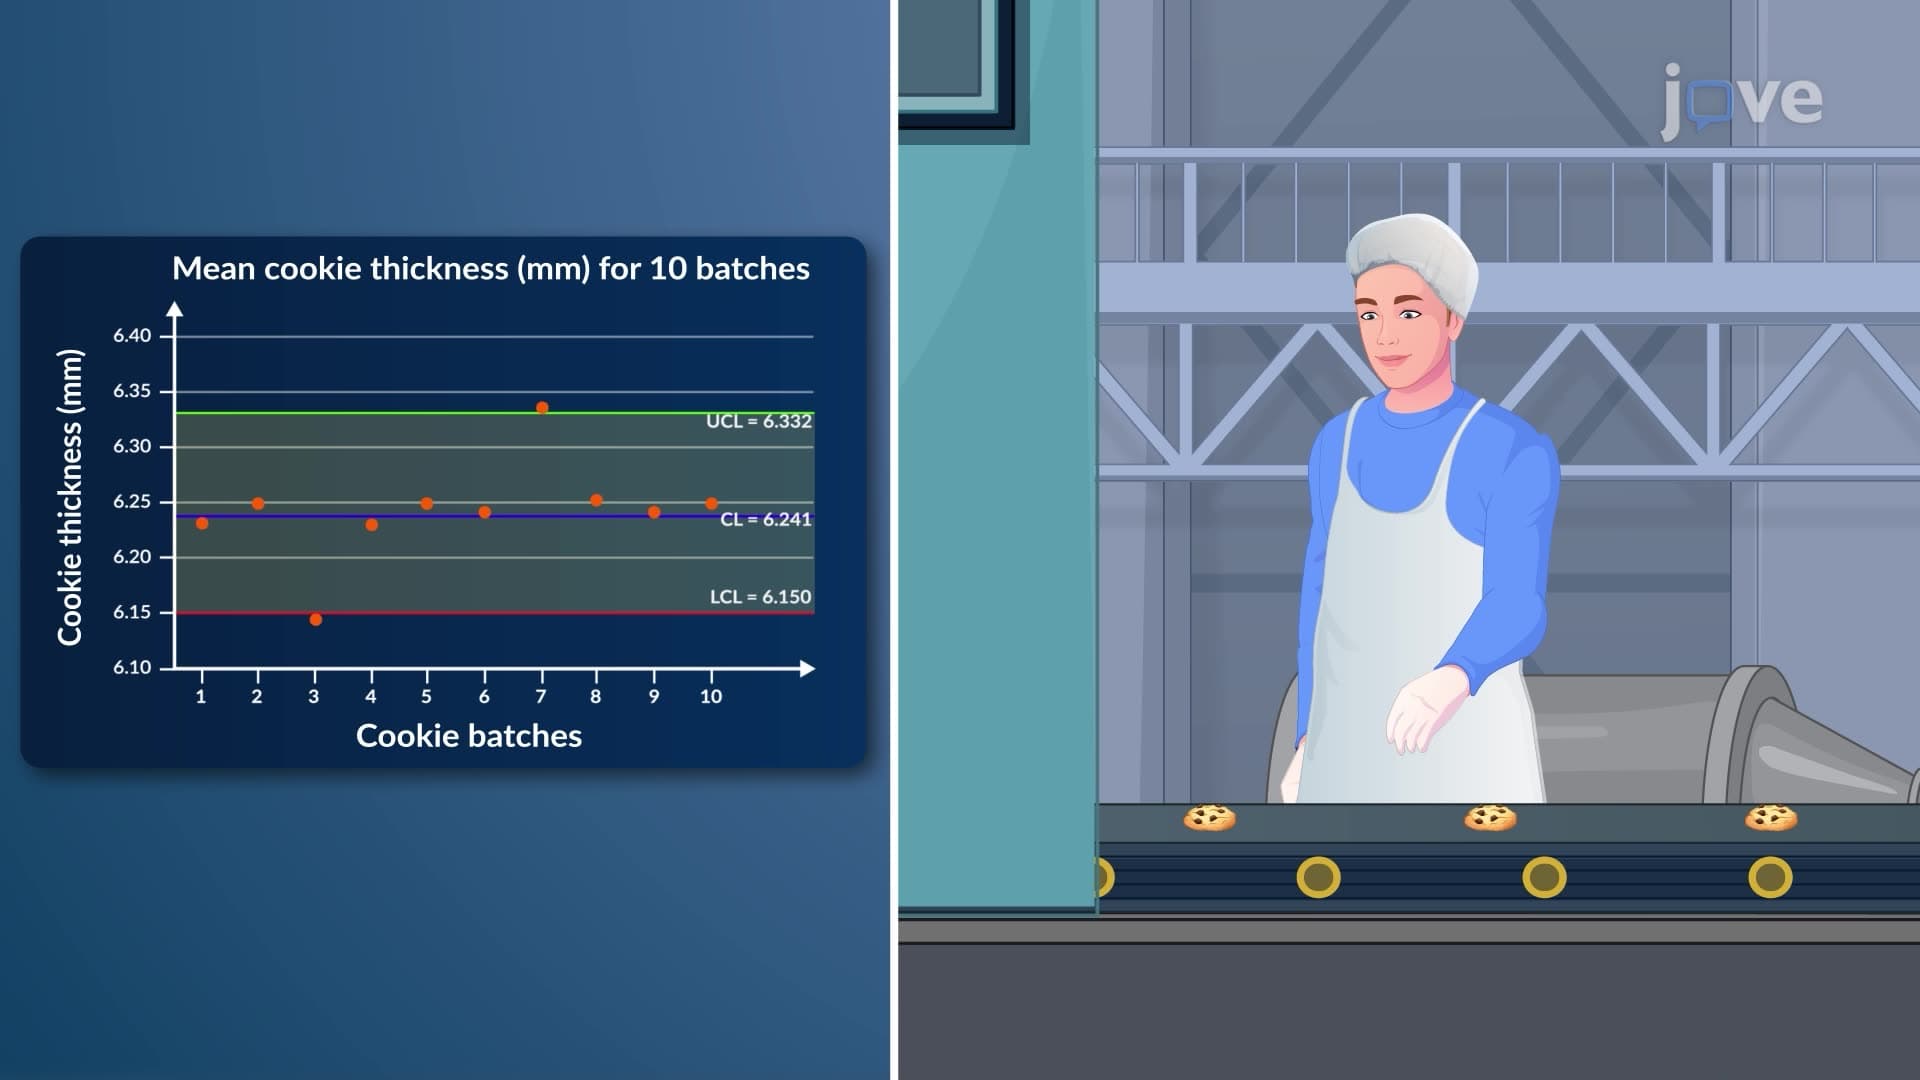
Successful R chart analysis requires understanding various out-of-control signals. Single points exceeding control limits indicate immediate attention needs, while patterns like seven consecutive points on one side of the centerline suggest systematic process shifts. Increasing trends might indicate tool wear in manufacturing, while decreasing variability could paradoxically signal measurement system problems.
For students preparing for AP Statistics or introductory college statistics courses, R chart interpretation frequently appears in quality control problem sets. Understanding when to investigate process variations versus accepting natural fluctuations represents a critical skill in both academic and professional contexts.
Contemporary quality management systems integrate R charts with other SPC tools for comprehensive process monitoring. Six Sigma methodologies, widely adopted by US companies like General Electric and Motorola, rely on R charts during the Measure and Control phases of DMAIC projects. This integration appears frequently in business statistics coursework and industrial engineering curricula at universities nationwide.
Related Micro-courses