Loading video…


 10 Concepts
 6.5K views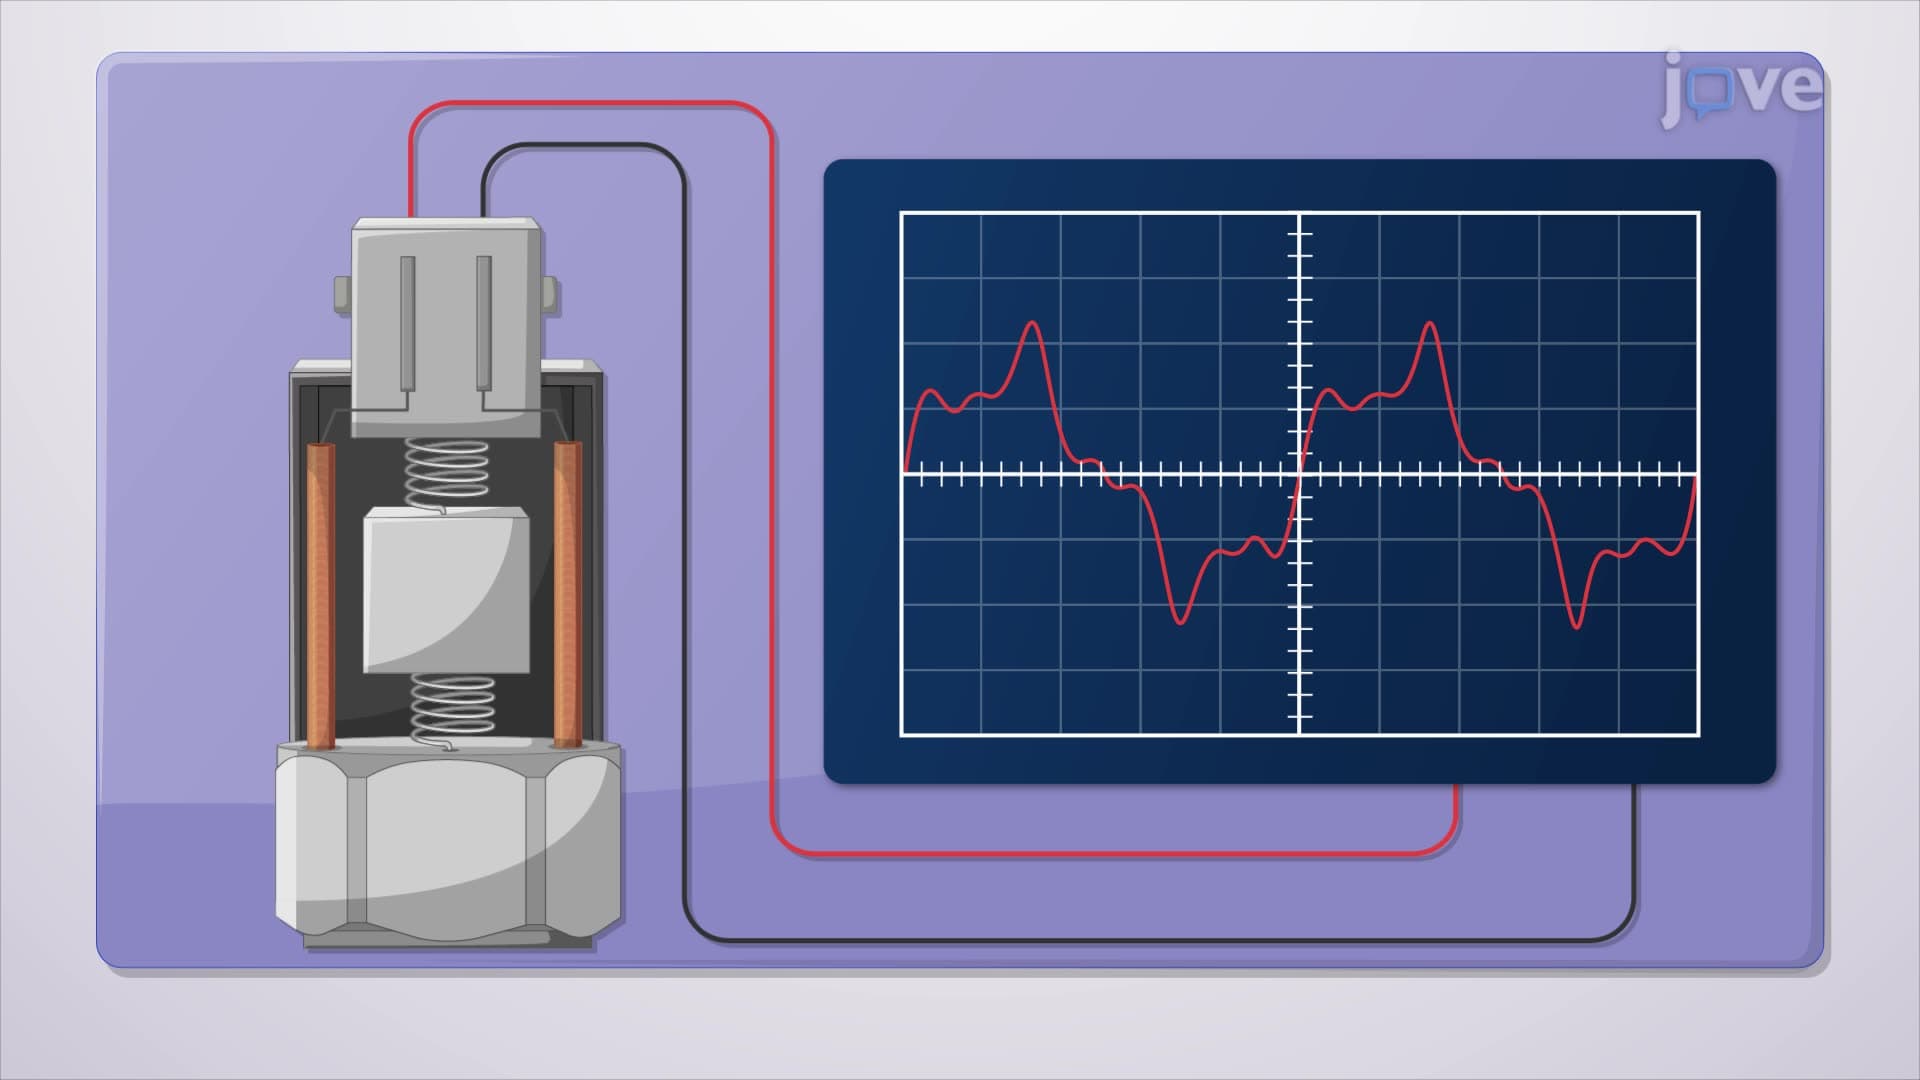

Video Summary: What Is Discrete Fourier Transform
When engineers analyze bridge vibrations after earthquakes or NASA scientists process radio telescope data, they rely on the fast Fourier transform to decode complex signals. The Discrete Fourier Transform breaks down any digital signal-like data from a vibration sensor monitoring California's Golden Gate Bridge-into simple sine and cosine waves, revealing hidden frequency patterns that could indicate structural problems. Watch the full video on JoVE Coach to master this concept with expert-led visuals and step-by-step explanations.
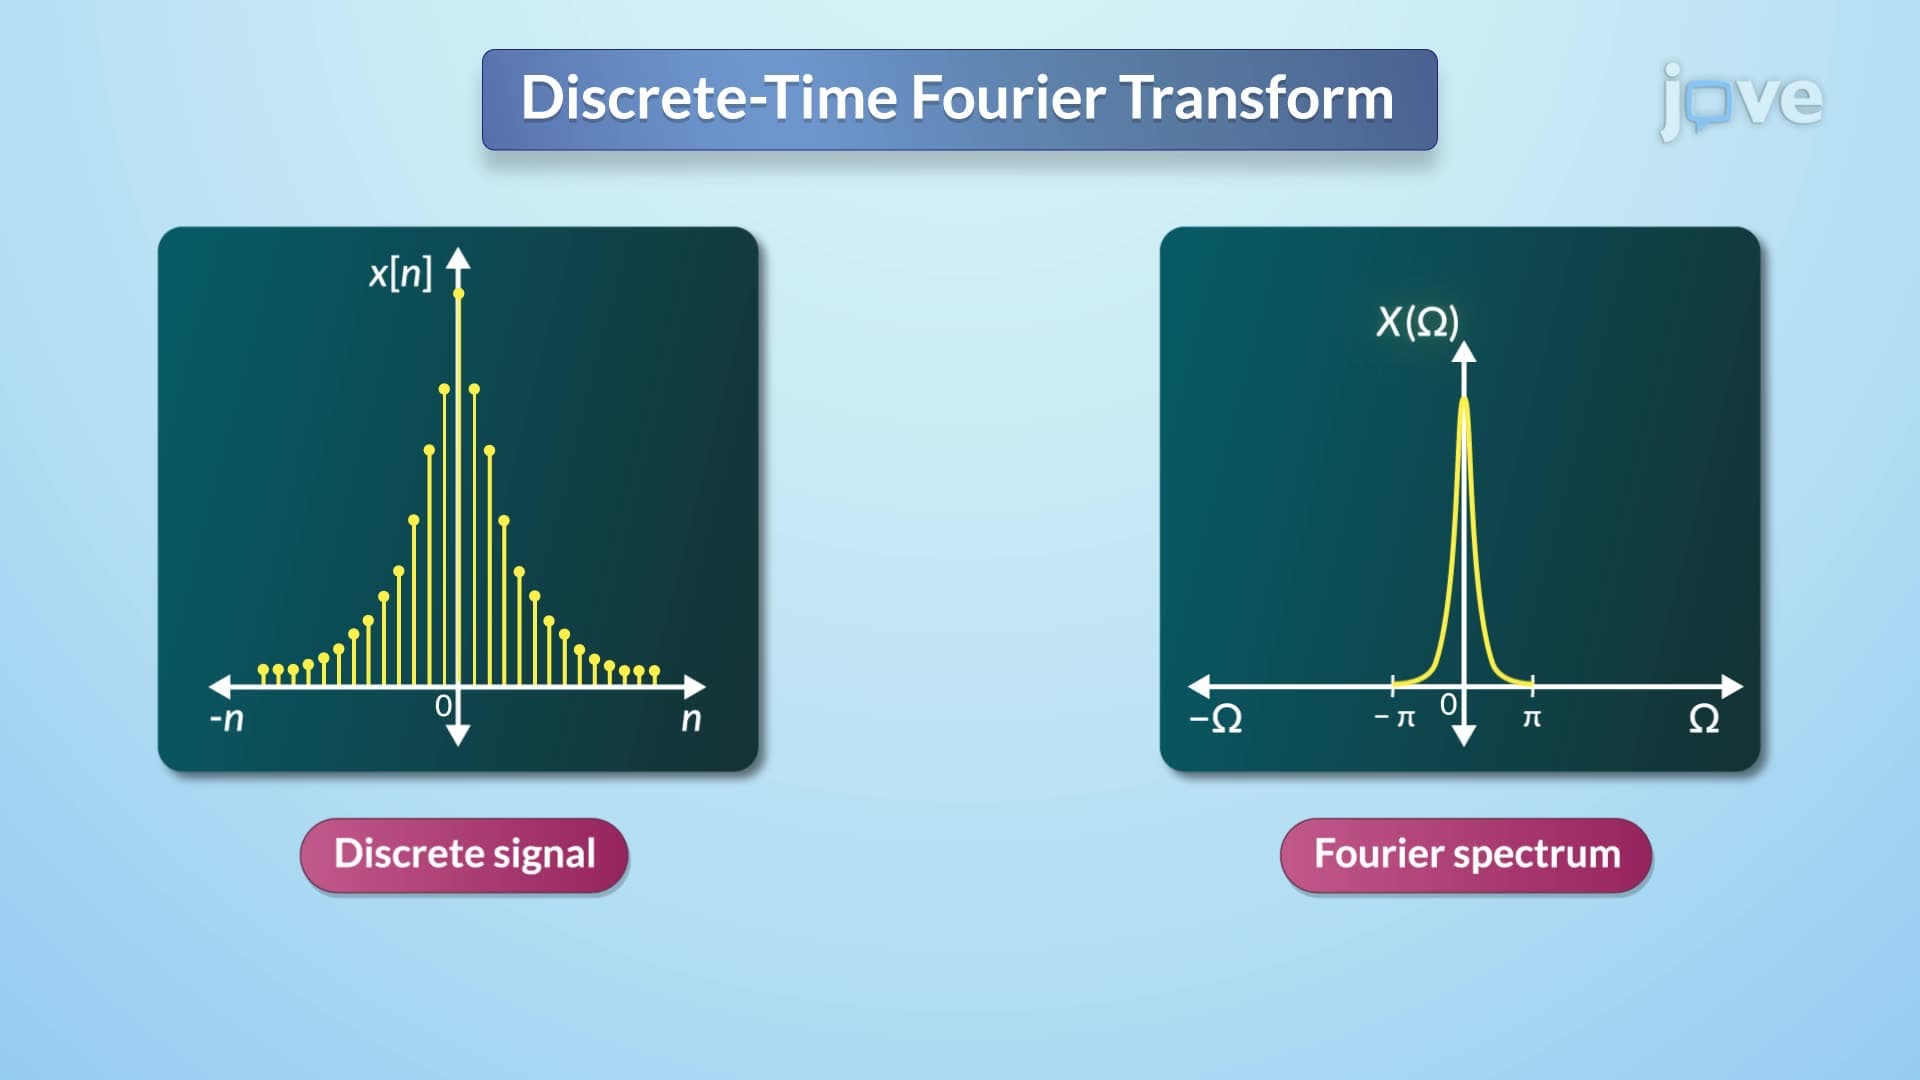
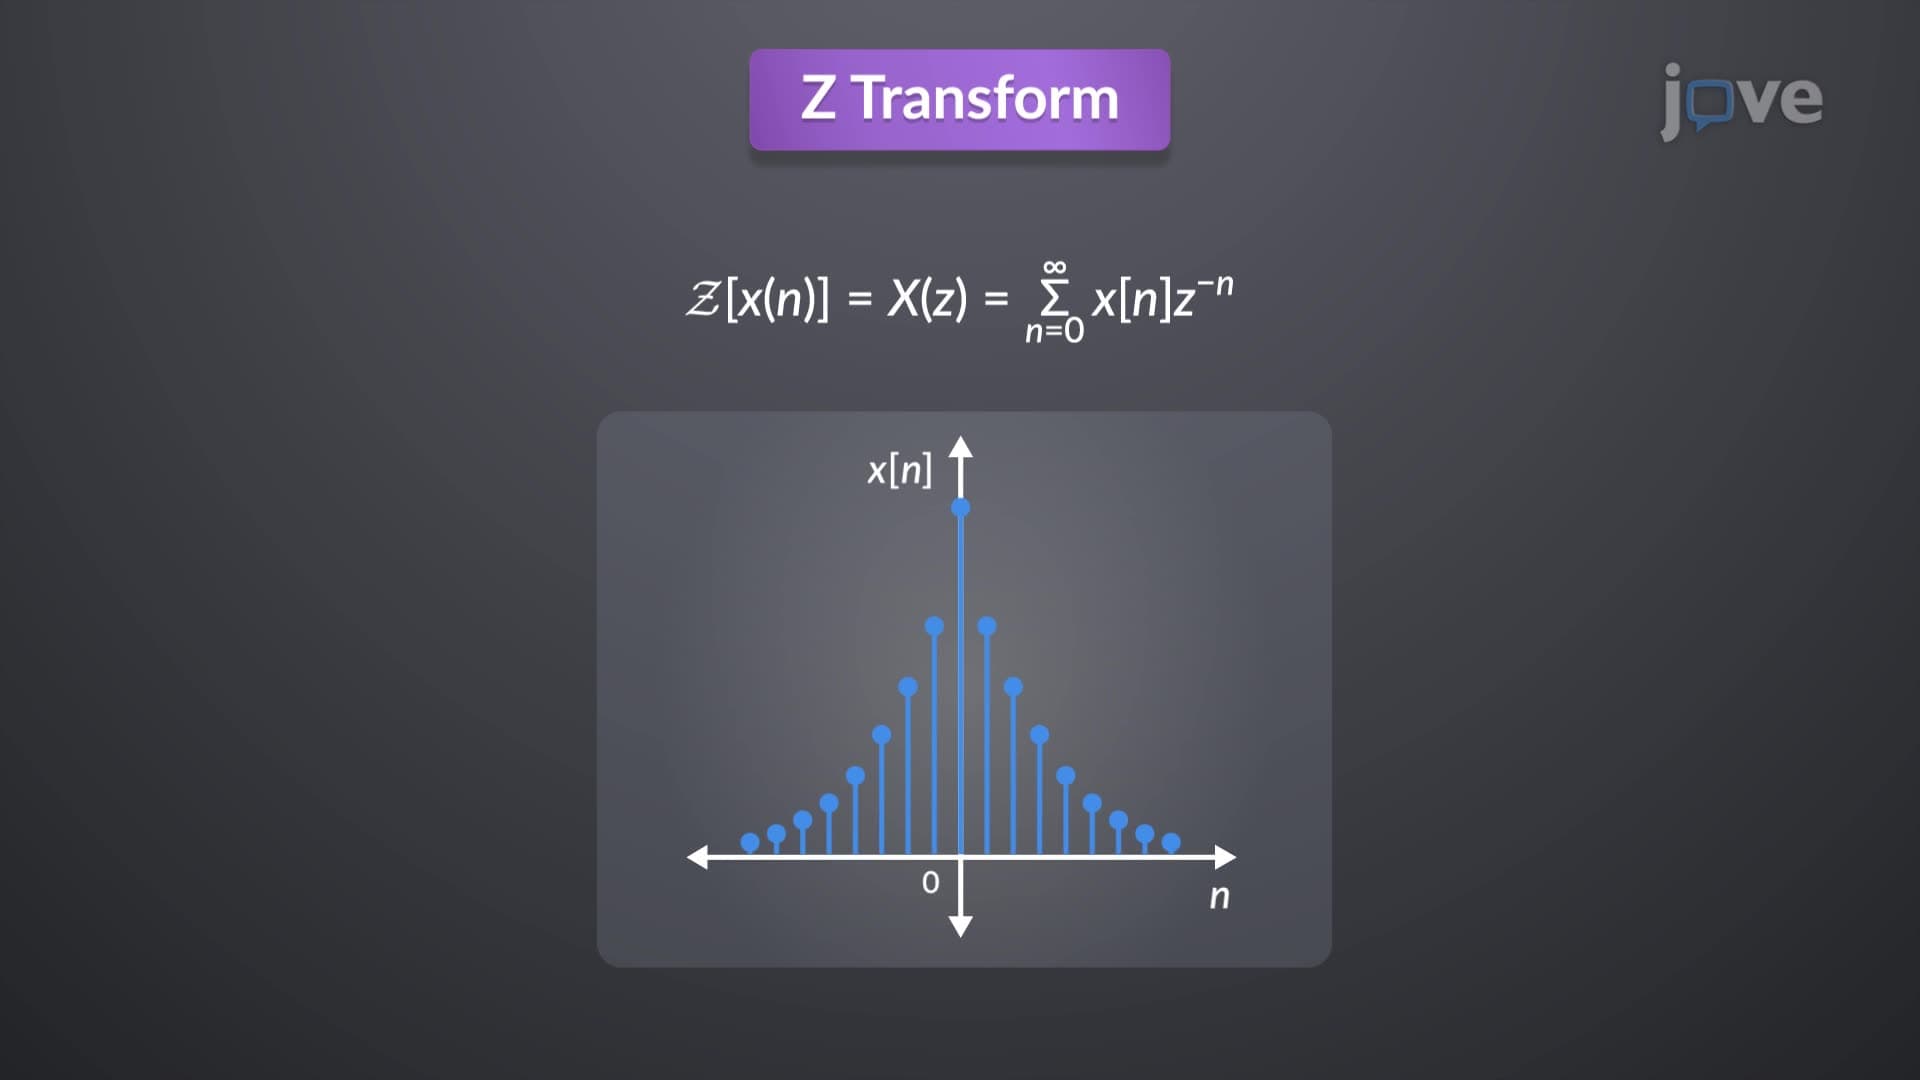
The Discrete Fourier Transform serves as a mathematical bridge between how we naturally think about signals (as they change over time) and how computers can efficiently analyze them (by breaking them into frequency components). Unlike its continuous counterpart, the DFT works exclusively with discrete data points-the kind of information that digital sensors, smartphones, and laboratory equipment actually collect.
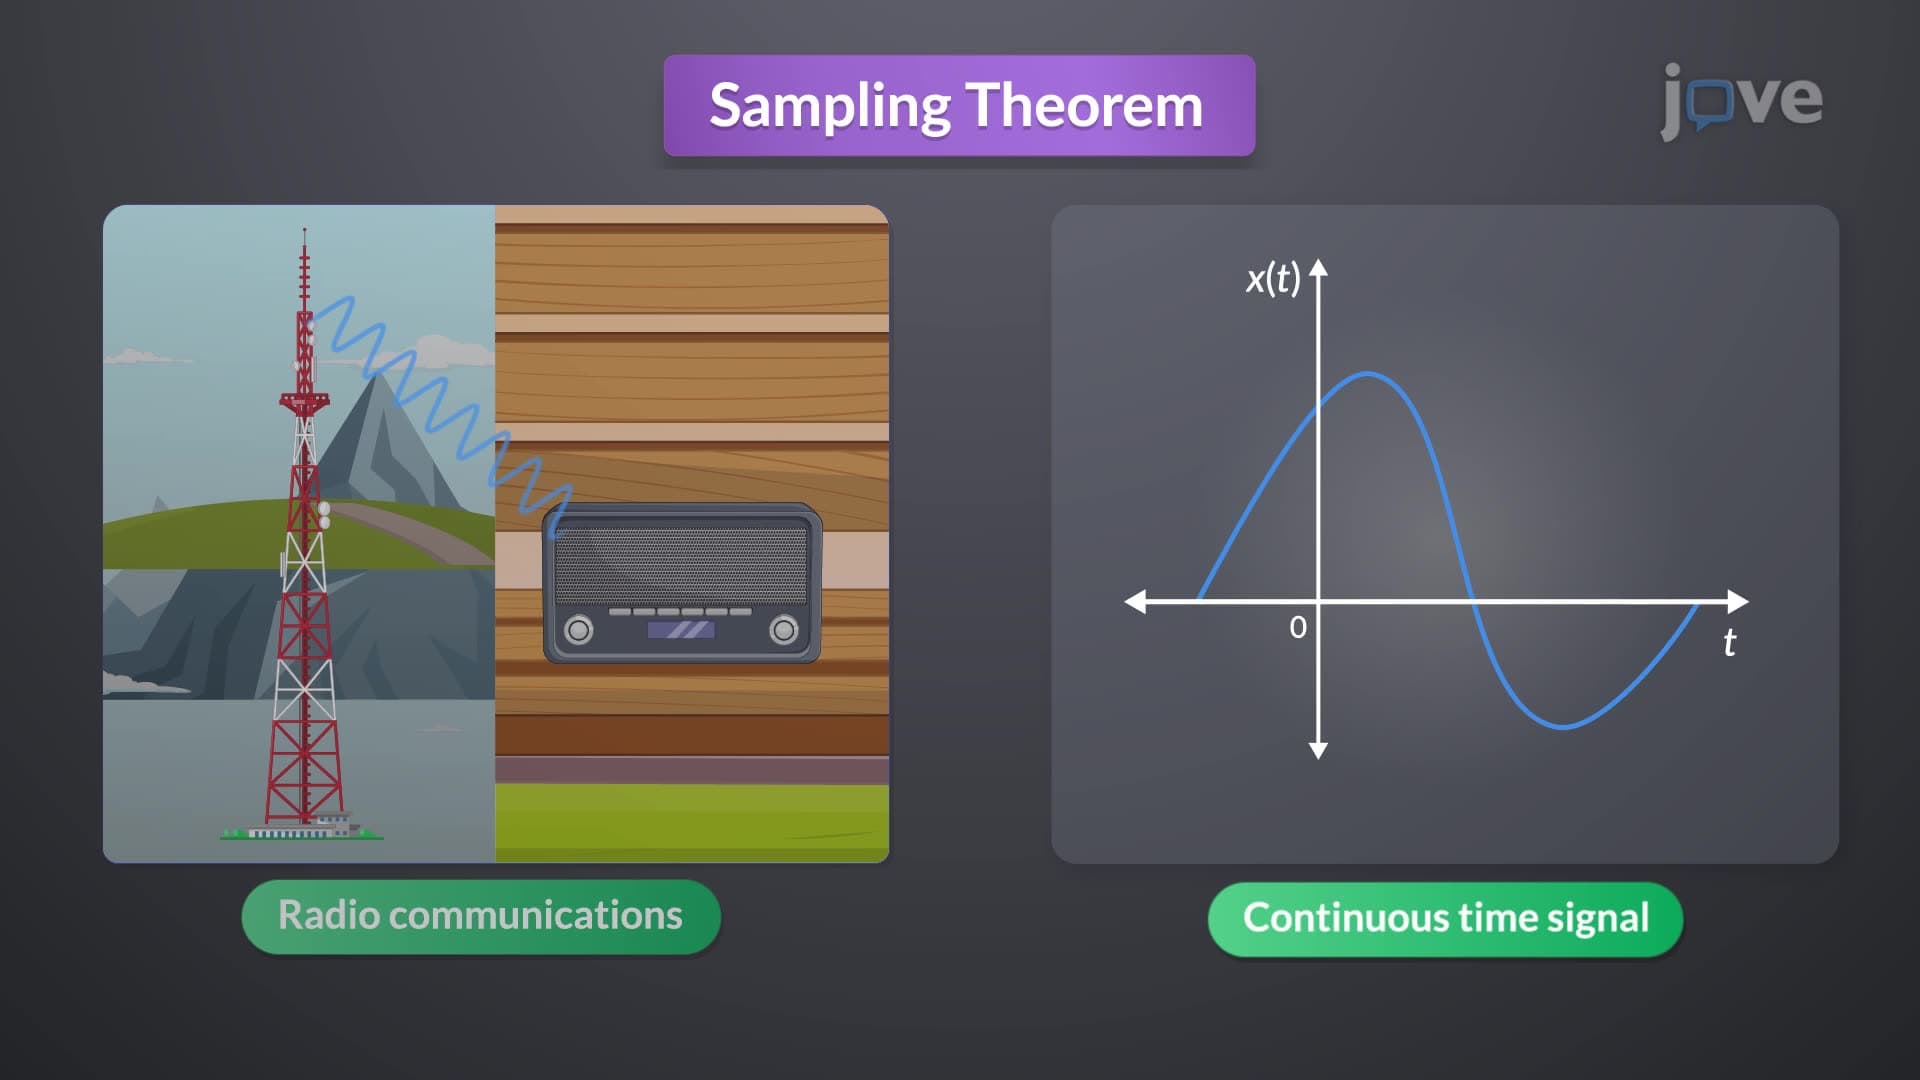
Real-world signals are inherently continuous, but our measurement tools capture them as snapshots at regular intervals. Consider seismographs monitoring earthquake activity along the San Andreas Fault: these instruments sample ground motion thousands of times per second, creating discrete data points that represent continuous earth movement. The fast Fourier transform algorithm processes these discrete measurements to identify specific frequency signatures that distinguish between different types of seismic events.
The DFT formula expresses any finite sequence of data points as a sum of complex exponentials, each corresponding to a specific frequency. When X(k) yields a large value for a particular frequency k, it indicates that the original signal contains strong components at that frequency. This mathematical relationship proves essential for students preparing for AP Physics or college-level signal processing courses, where understanding frequency domain analysis becomes crucial for solving wave mechanics and electronics problems.
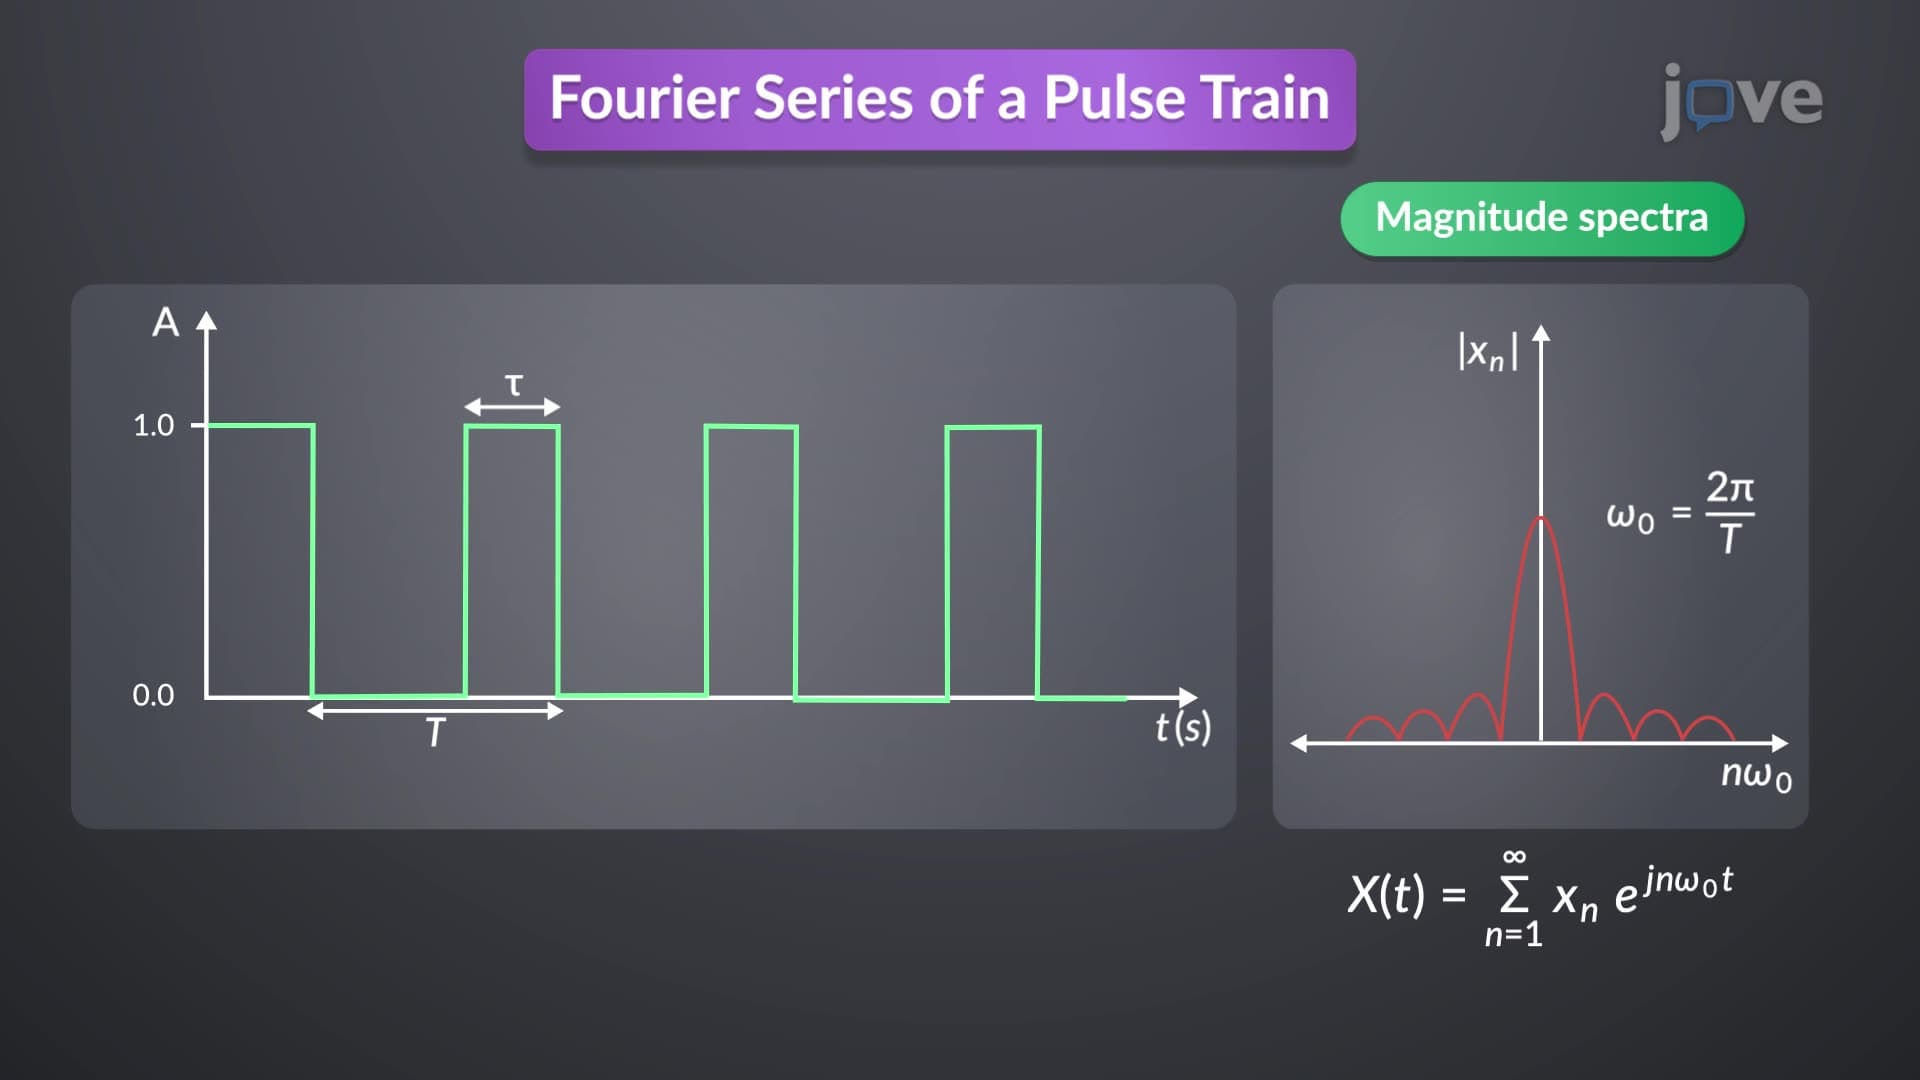
The amplitude spectrum-visualized as a bar graph-reveals which frequencies dominate a signal. Each bar's height represents the strength of a particular frequency component after normalization. For instance, when analyzing audio recordings for music production at institutions like Berklee College of Music, engineers use DFT amplitude spectra to identify problematic frequencies, enhance desired harmonics, or design equalizers. This visual representation makes complex mathematical concepts accessible to students who might struggle with abstract frequency domain thinking.
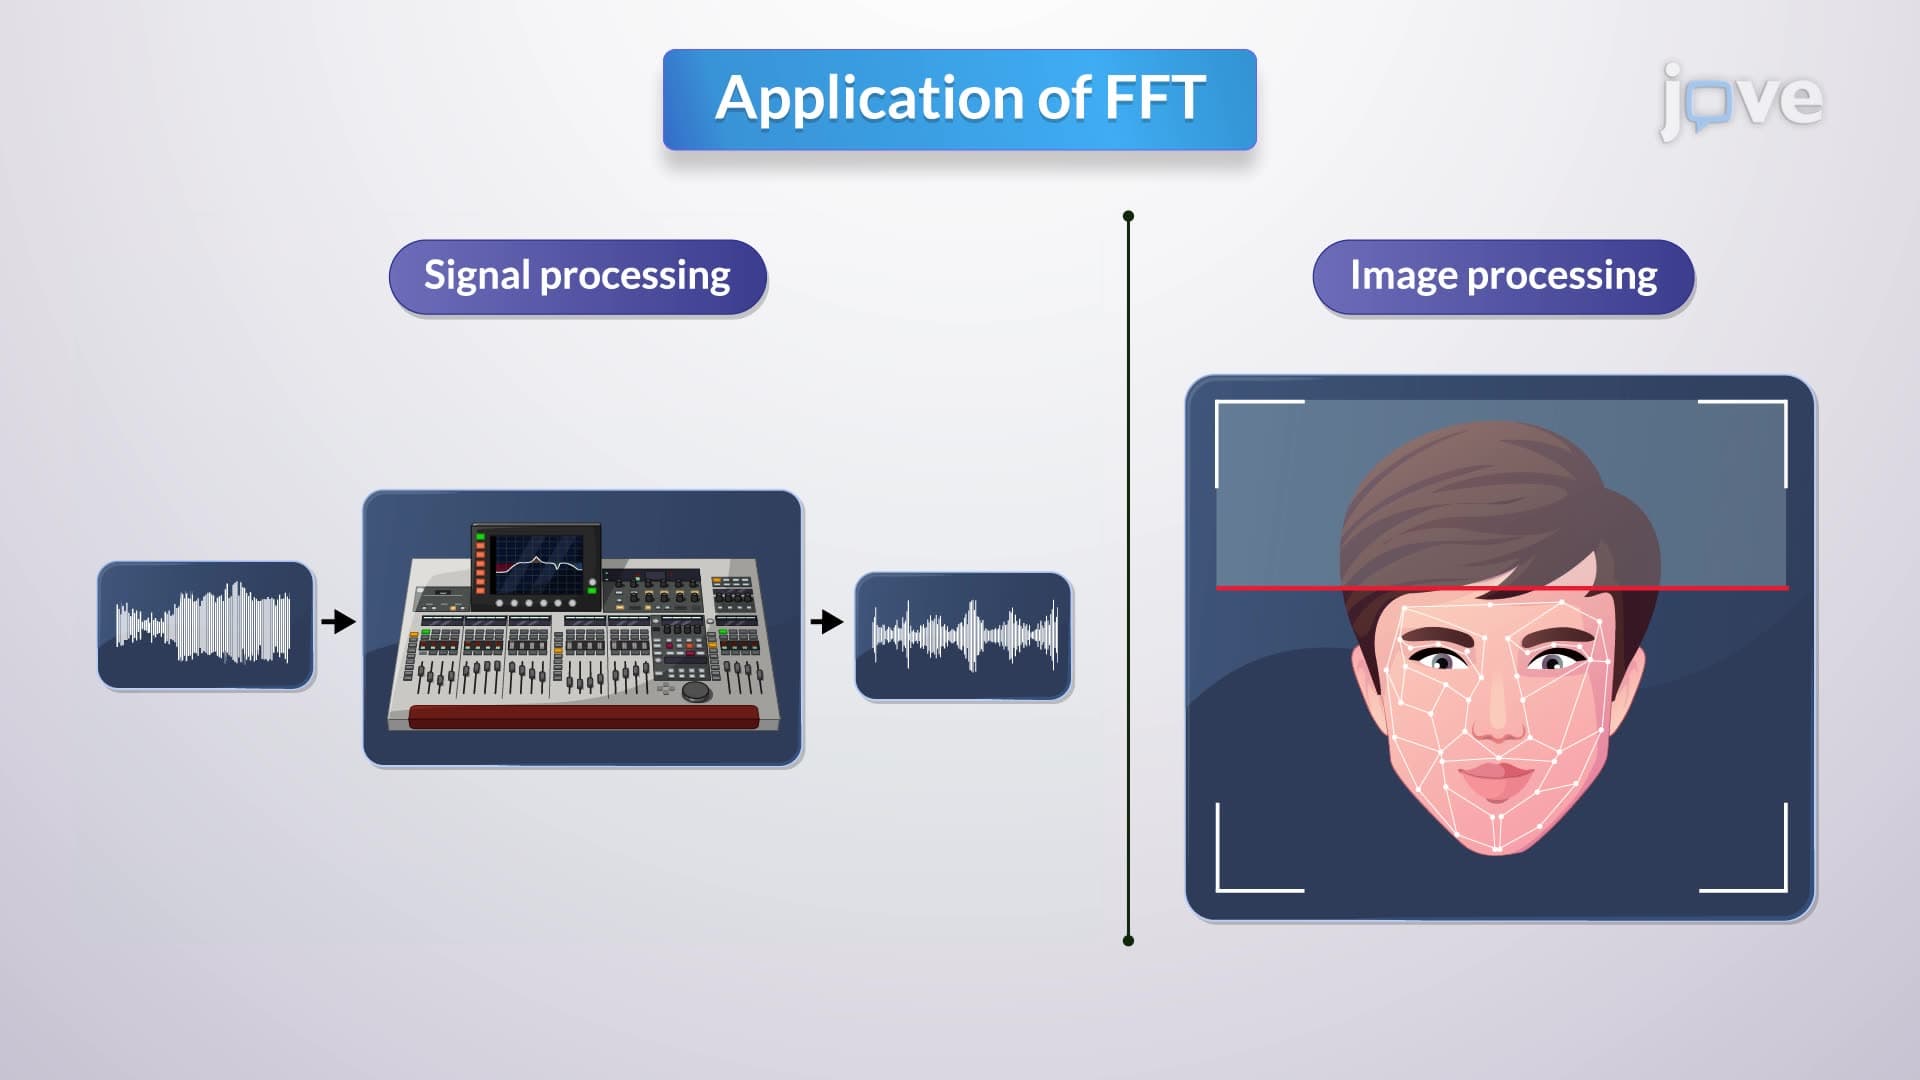
The fast Fourier transform appears throughout American industry and research: NASA uses it for processing satellite communications, medical professionals apply it in MRI image reconstruction, and automotive engineers employ it for engine vibration analysis. Students encounter DFT concepts in AP Computer Science when studying algorithm efficiency, in AP Physics when analyzing wave interference, and in college calculus when exploring series representations. Understanding these connections helps students see beyond mathematical formalism to real-world problem-solving applications.
Related Micro-courses