Loading video…


 22 Concepts
 3.2K views

Video Summary: Trends in Labor Force Participation in the U S Explained
Did you know the U.S. labor force participation rate hit its peak around 2000, and has been declining ever since? Understanding trends in labor force participation in the U.S. helps explain why millions of working-age Americans sit outside the job market today. For example, as Baby Boomers retire en masse, the workforce shrinks even when unemployment stays low. Watch the full video on JoVE Coach to master this concept with expert-led visuals and step-by-step explanations.
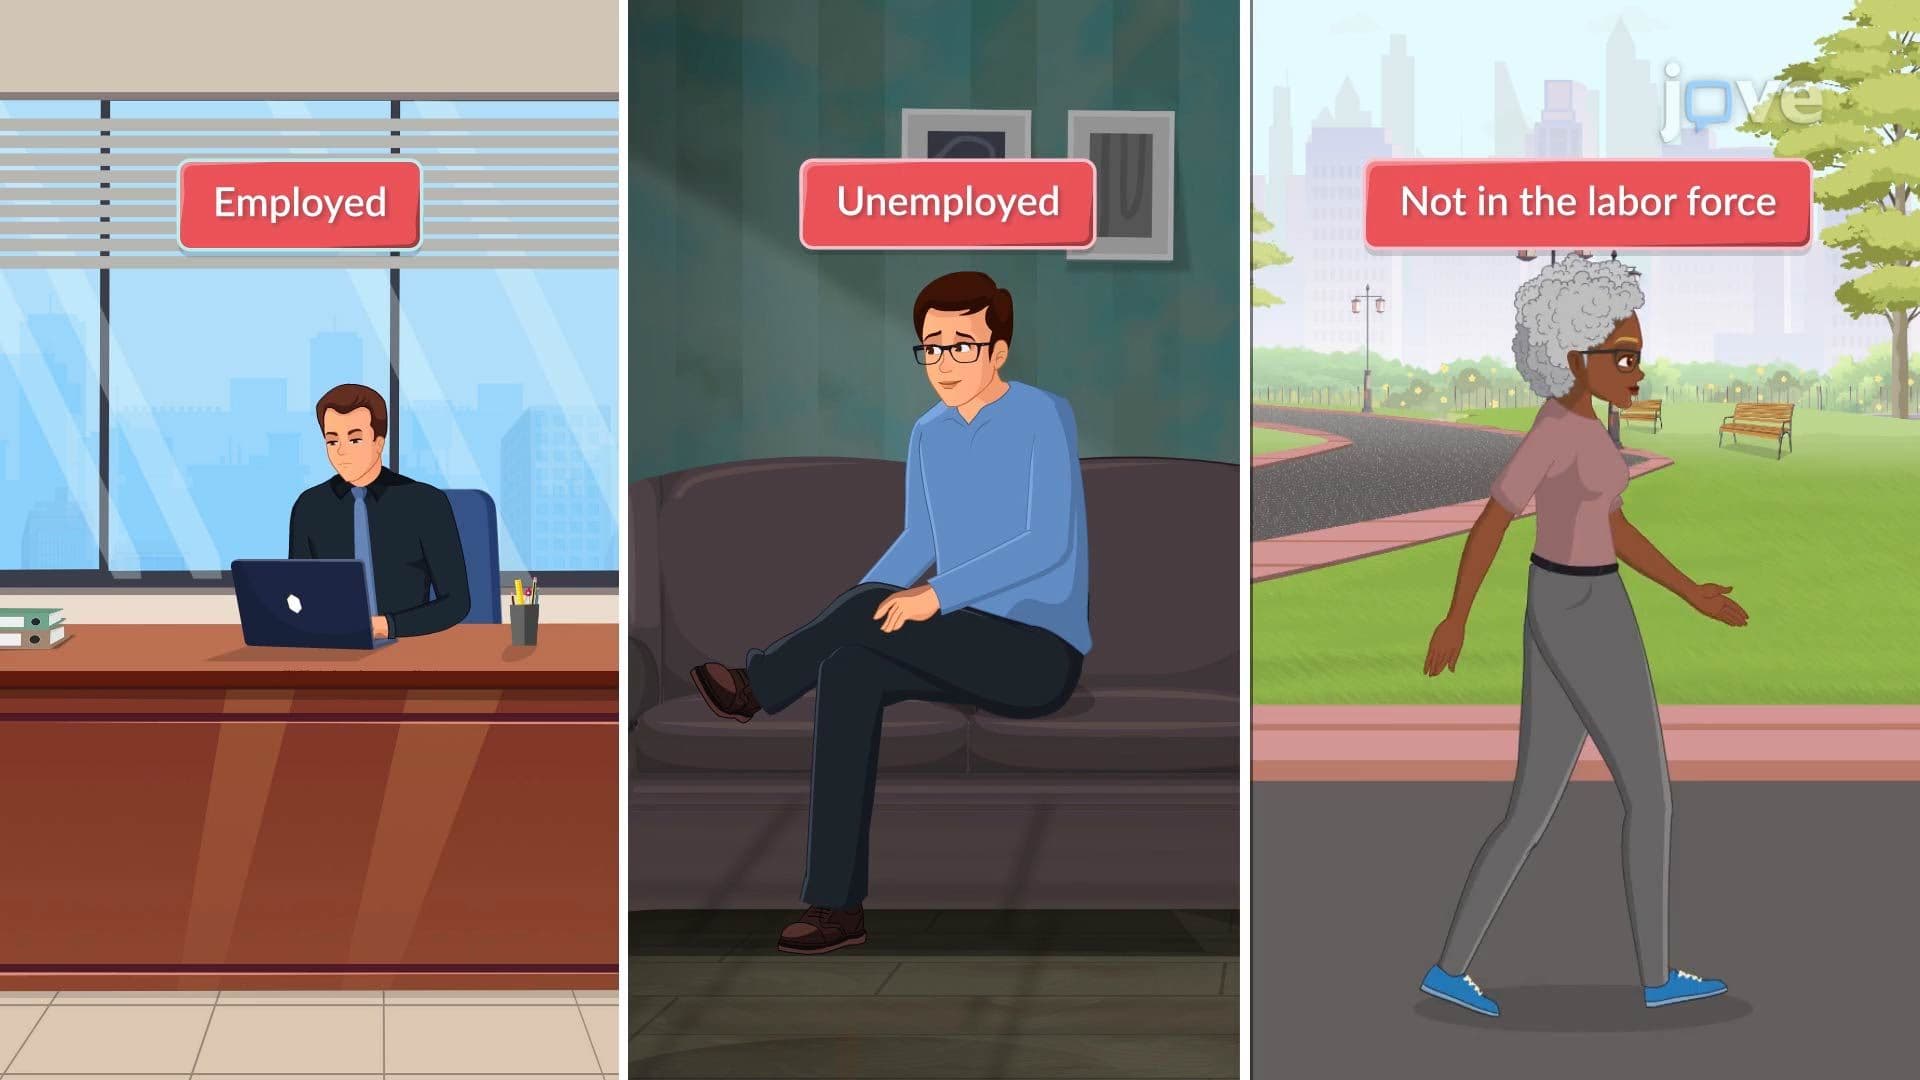
The labor force participation rate (LFPR) measures the percentage of the civilian noninstitutional population aged 16 and older that is either employed or actively seeking employment. Published monthly by the U.S. Bureau of Labor Statistics (BLS), it is one of the most closely watched economic indicators in the country. Unlike the unemployment rate, which only counts those actively looking for work, the LFPR captures a broader picture of how engaged the working-age population actually is with the labor market. Tracking trends in labor force participation in the U.S. is essential for understanding economic health, demographic change, and long-term growth potential.
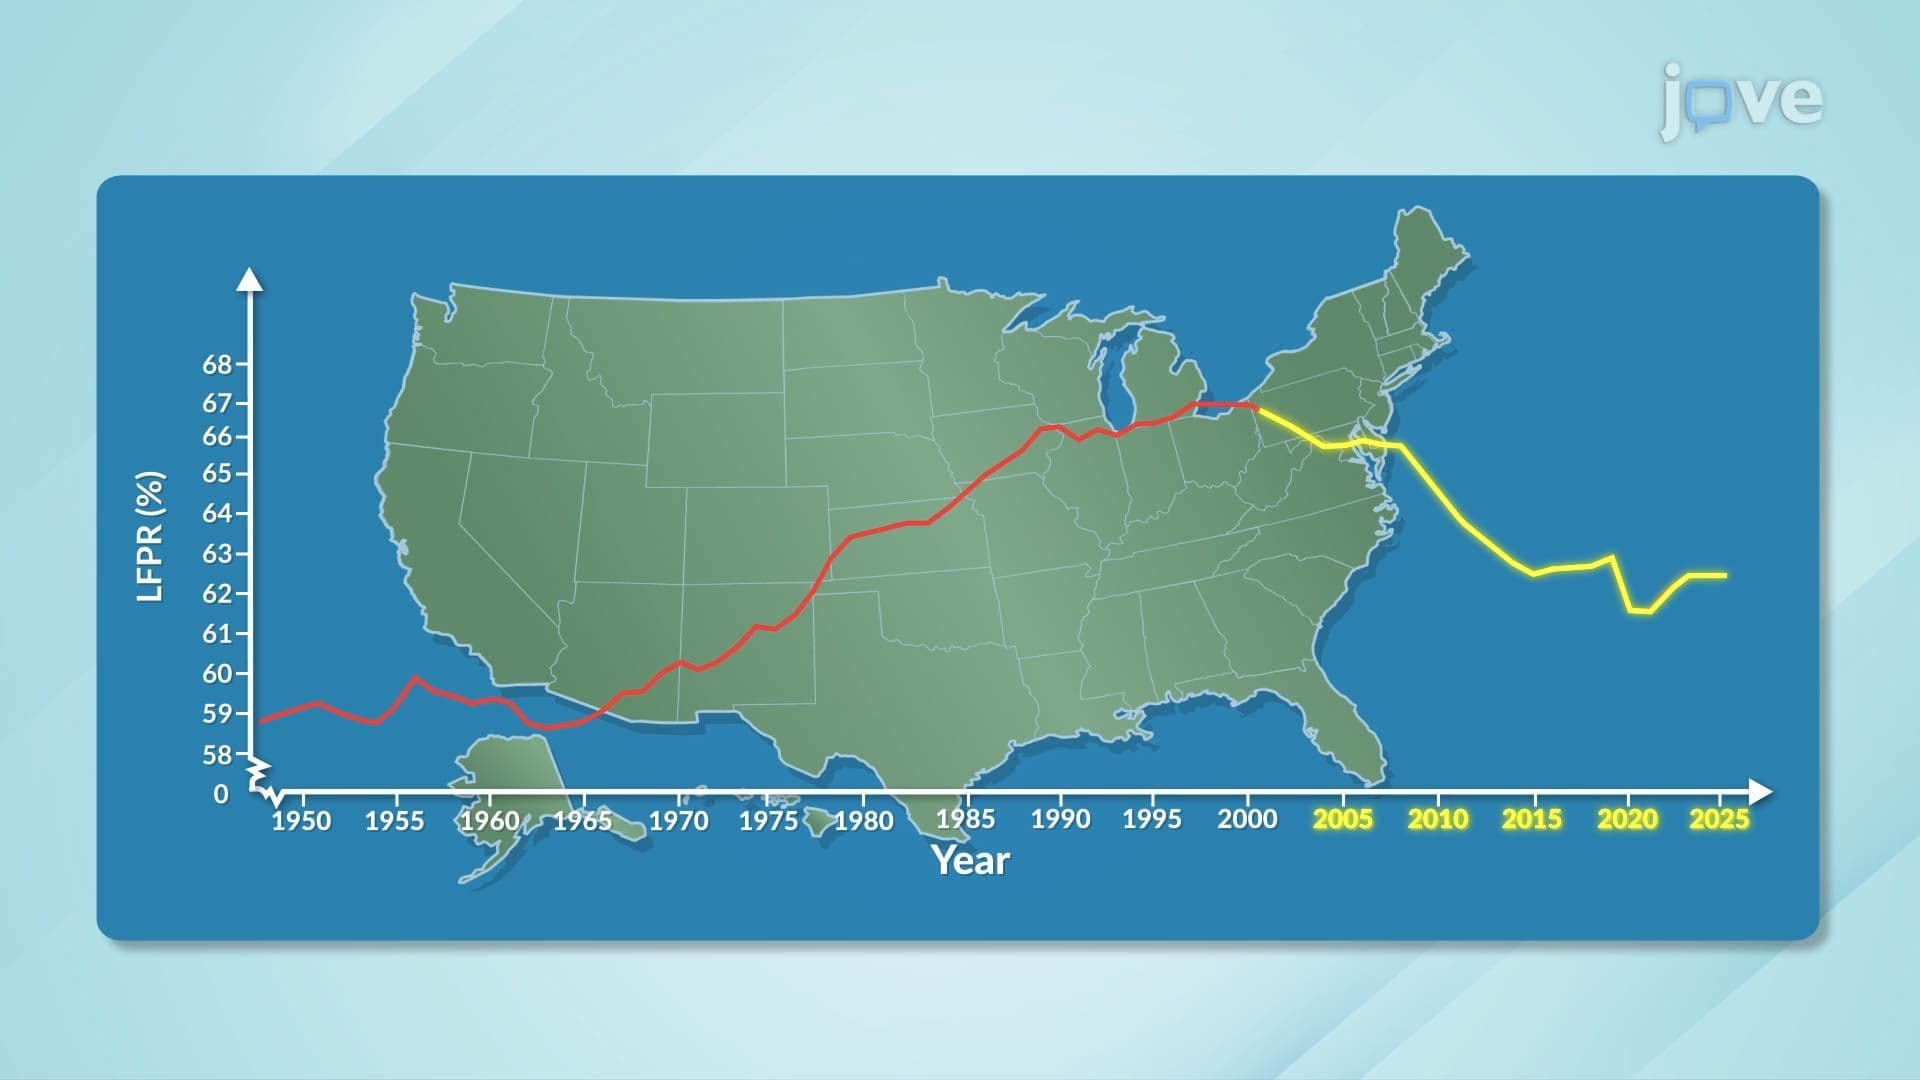
From the 1950s through the early 1970s, the U.S. LFPR hovered around 60%, driven primarily by male workers in an era when women's workforce involvement was limited by both cultural norms and legal barriers. That shifted dramatically in the 1970s and 1980s. Second-wave feminism, the Equal Pay Act of 1963, and expanding access to higher education combined with economic necessity, particularly rising household costs, to draw millions of women into the workforce. By the late 1990s, women's participation rates had climbed significantly, narrowing the gender gap in employment. Simultaneously, the enormous Baby Boomer generation (born 1946-1964) reached peak working age, flooding the labor market with an unusually large cohort of workers.
The LFPR reached its historic high near 67% around 2000. After that, the trend reversed, and it has not fully recovered since. Several interconnected factors explain the decline. First, Baby Boomers began aging out of the workforce, and retirements accelerated sharply after 2010. Second, increasing college enrollment among young adults temporarily pulls 18-24-year-olds out of the labor force. Third, automation and globalization eroded stable employment in manufacturing and other low-skill sectors, discouraging some workers from even searching for jobs, a group economists call discouraged workers. By 2015, the LFPR had dropped to approximately 62.7%.
The COVID-19 pandemic triggered one of the sharpest single drops in U.S. LFPR in modern history, as millions exited the workforce due to layoffs, caregiving responsibilities, health concerns, and early retirements. While there was a partial rebound as the economy reopened, full recovery has remained elusive. As of April 2025, the LFPR stands at approximately 62.6%, barely above the post-pandemic low. Policy discussions now center on how to re-engage sidelined workers through job retraining programs, expanded childcare support, and policies addressing technological displacement.
In AP Macroeconomics, understanding the LFPR is essential for units on unemployment, the business cycle, and fiscal policy. Students are frequently asked to distinguish between the unemployment rate and the LFPR, a common multiple-choice trap. In college-level Principles of Economics courses, LFPR trends anchor discussions of long-run aggregate supply and potential output. For students preparing for the AP Economics exam, being able to explain *why* a falling unemployment rate paired with a falling LFPR may not indicate a truly strengthening economy is a high-value analytical skill. Real-world literacy in this area also strengthens performance in current events-based exam prompts and college application essays addressing economic issues.
Related Micro-courses