Loading subject page…


1,932 views


Video Summary: What are Levels of Use Gis
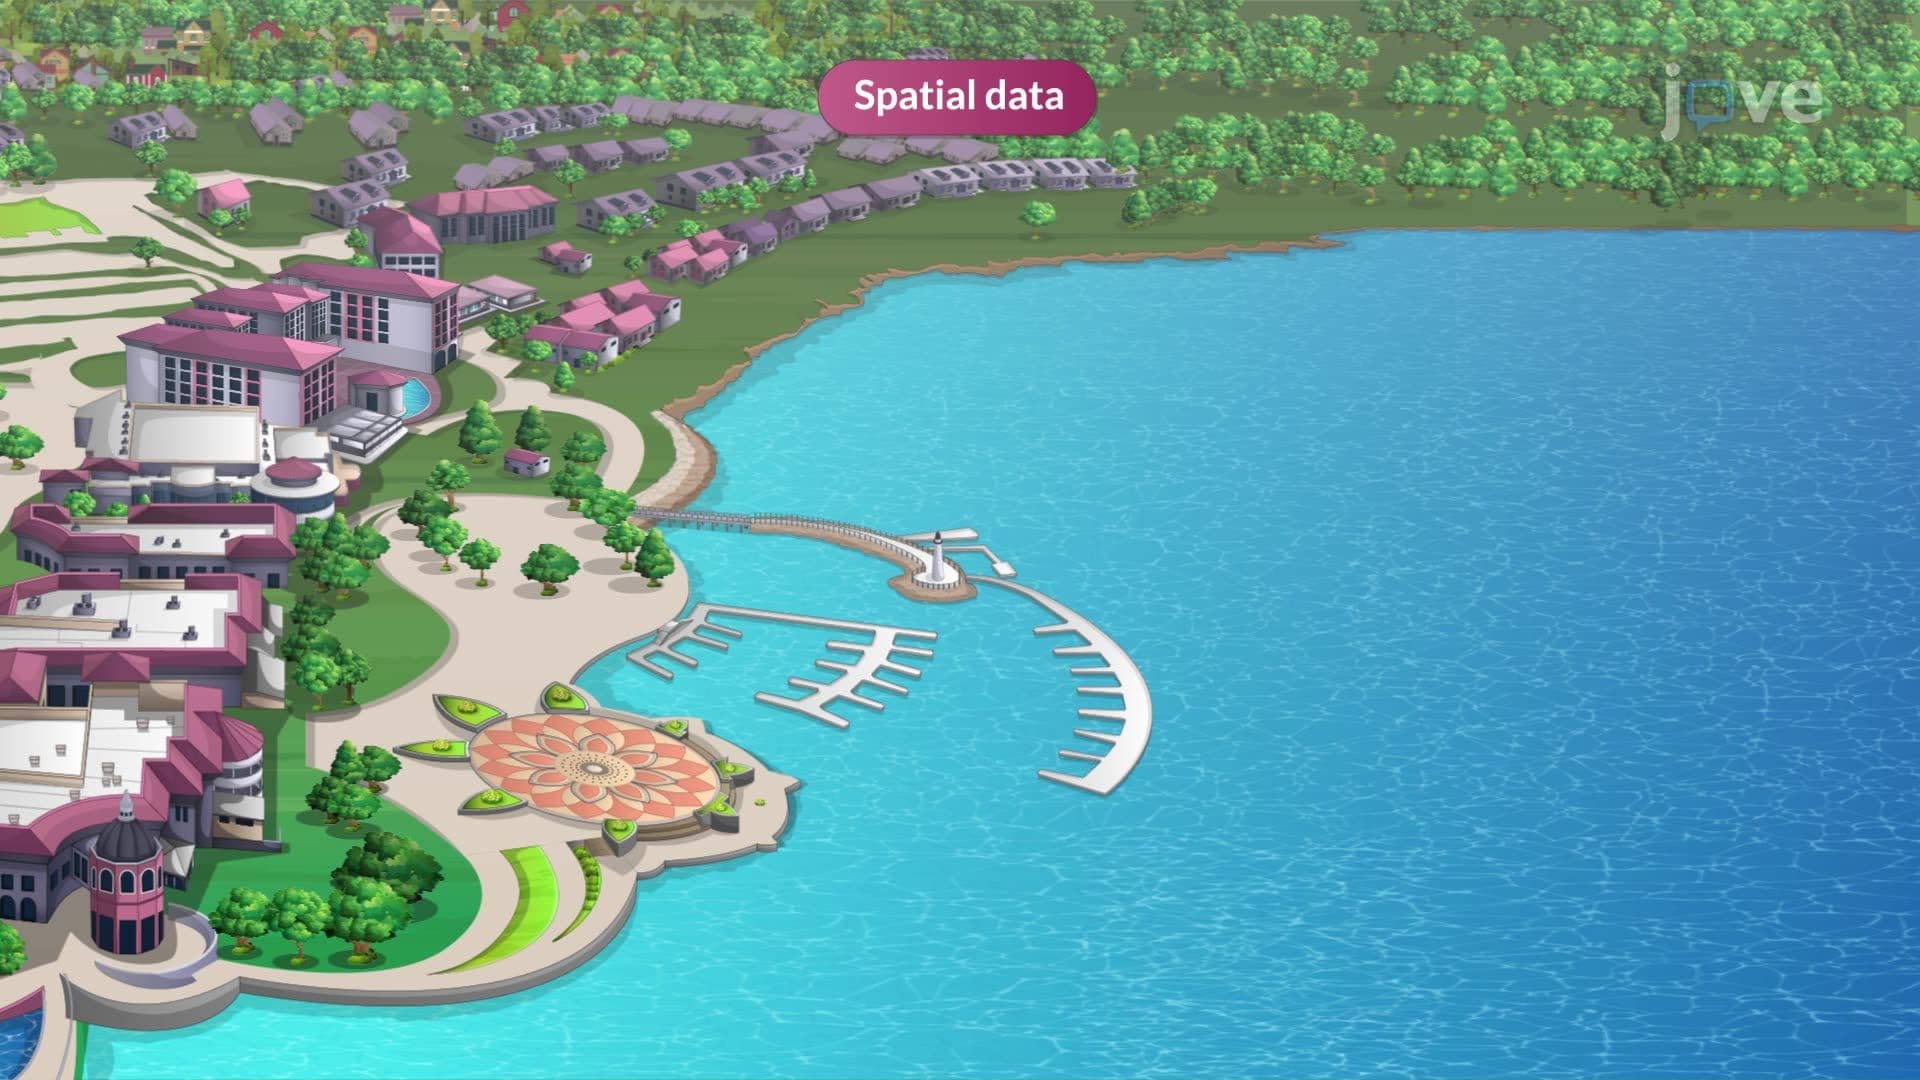
Ever wondered how emergency responders know exactly where to deploy resources during a hurricane? Selected data about geographic locations powers Geographic Information Systems (GIS) through three distinct complexity levels. From the U.S. Census Bureau's population databases to FEMA's disaster prediction models, understanding What are Levels of Use GIS reveals how spatial data transforms from simple storage to sophisticated forecasting tools. Watch the full video on JoVE Coach to master this concept with expert-led visuals and step-by-step explanations.
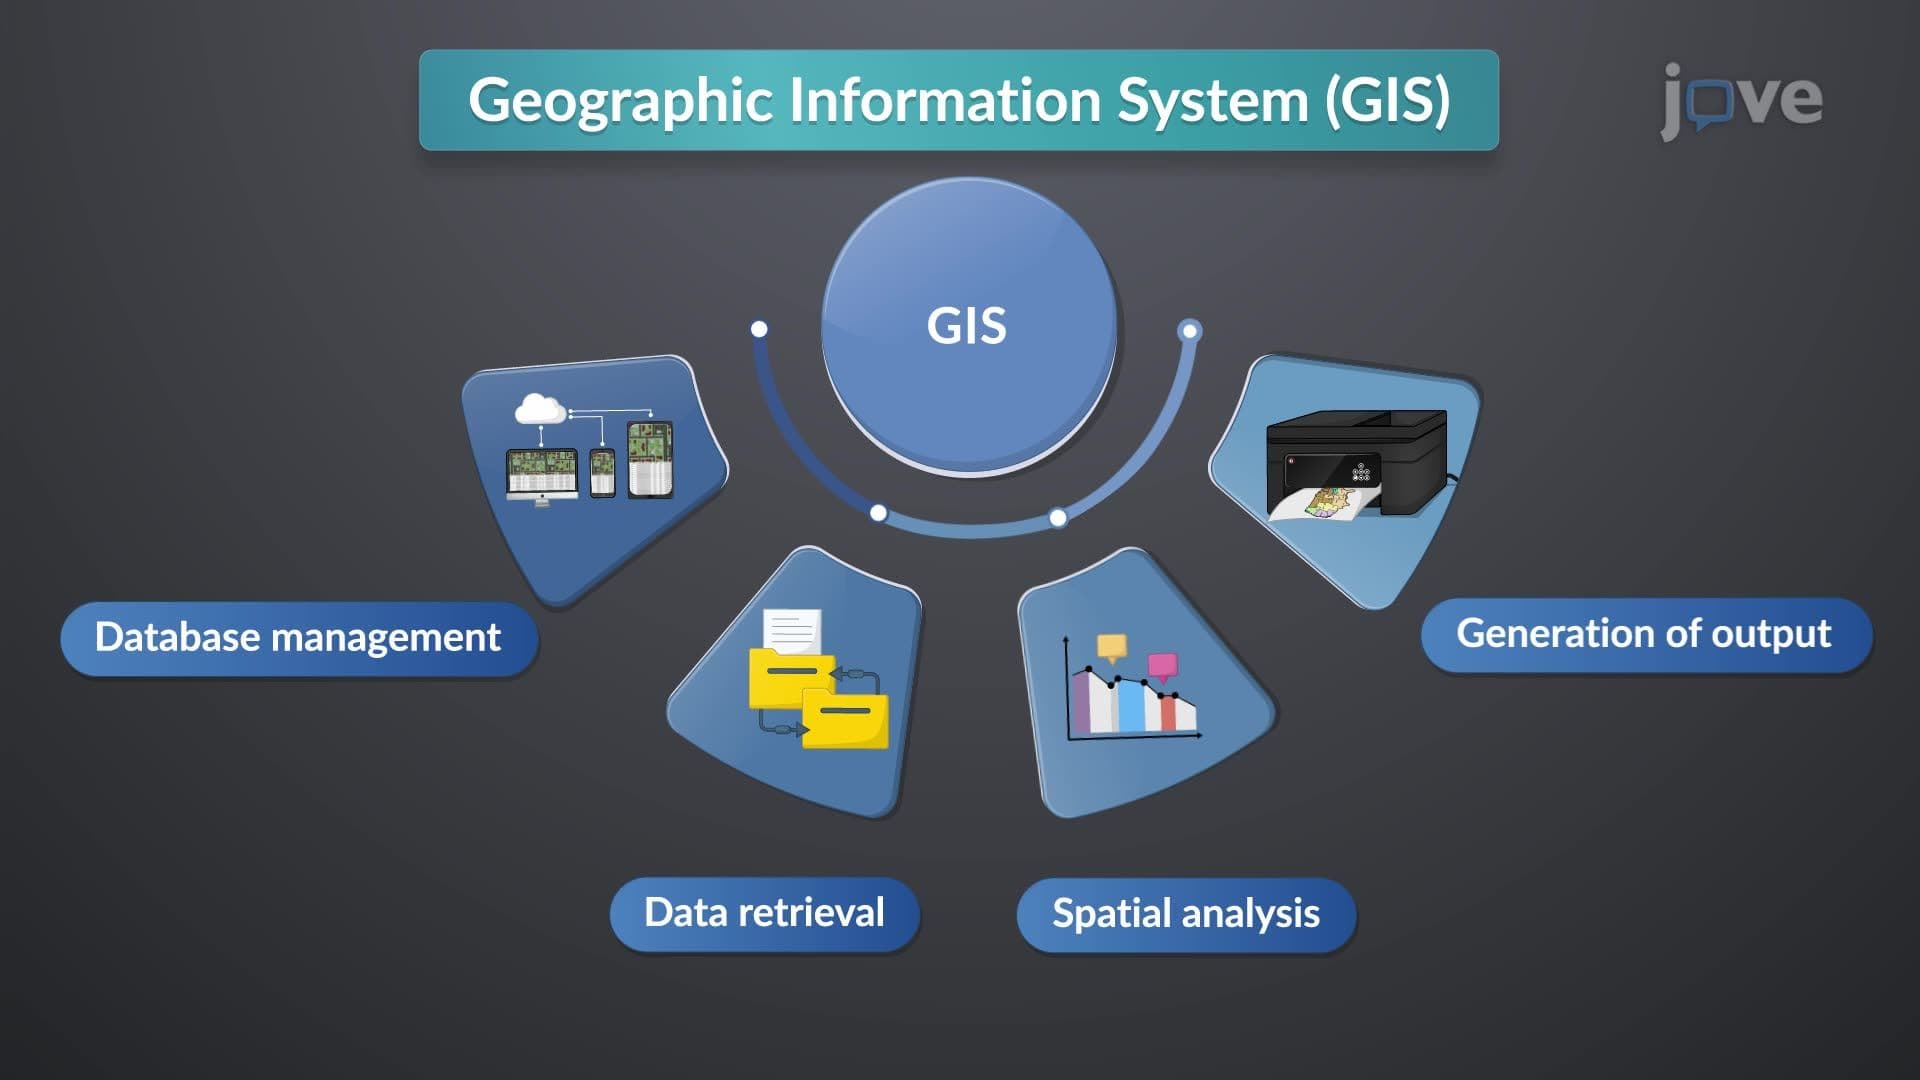
Geographic Information Systems operate through a hierarchical framework of three distinct usage levels, each building upon the previous to create increasingly sophisticated spatial analysis capabilities. This selected data about geographic locations framework provides students and professionals with a clear pathway for understanding GIS applications from basic data storage to complex predictive modeling.
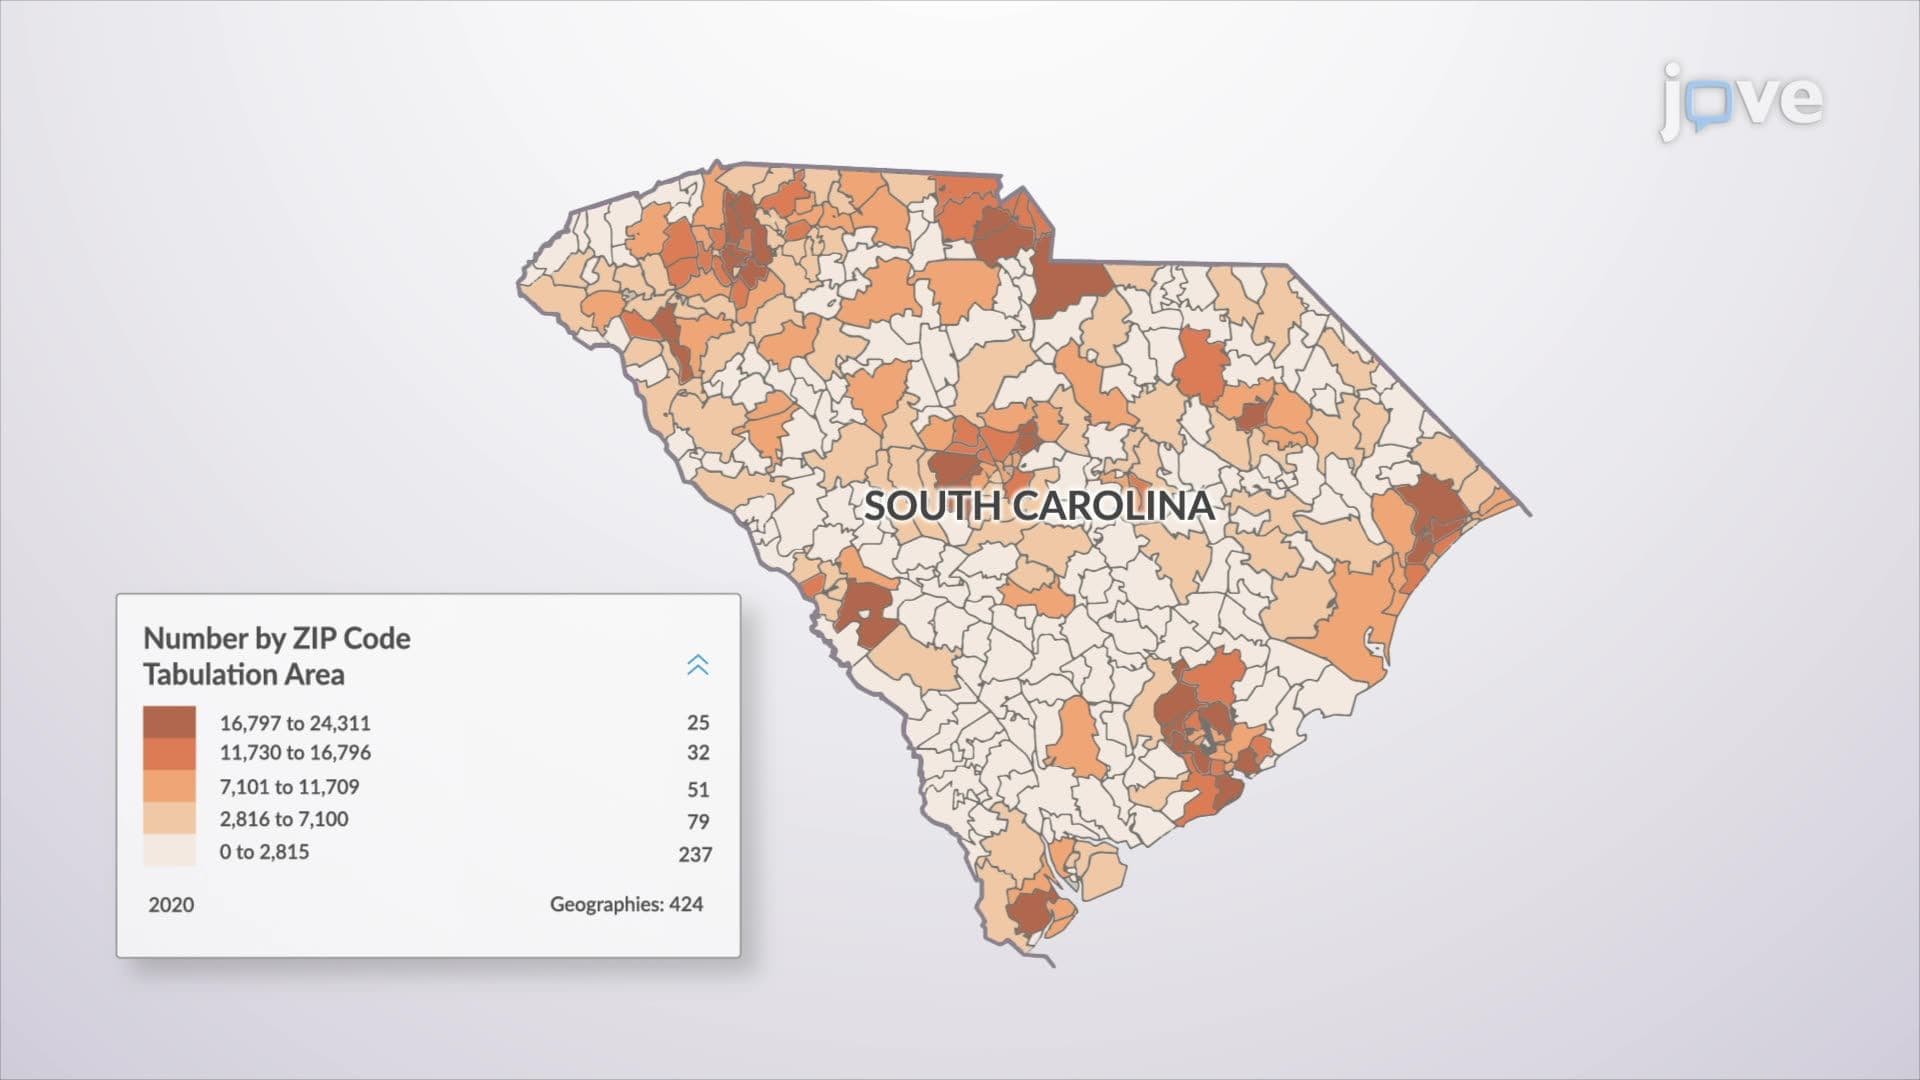
The foundational level focuses on the fundamental task of organizing selected data about geographic locations through systematic input, storage, and retrieval processes. At this level, GIS functions similarly to a sophisticated database management system specifically designed for spatial information. For instance, the New York City Department of Environmental Protection uses GIS at this level to maintain comprehensive records of the city's extensive water infrastructure, cataloging pipe materials, installation dates, maintenance histories, and capacity specifications across thousands of miles of underground networks.
Students preparing for AP Human Geography or college-level geography courses will encounter this concept as the building block for understanding more complex spatial analysis. The data management level typically handles attribute queries, basic mapping functions, and simple data visualization tasks that form the backbone of most municipal and organizational GIS implementations.
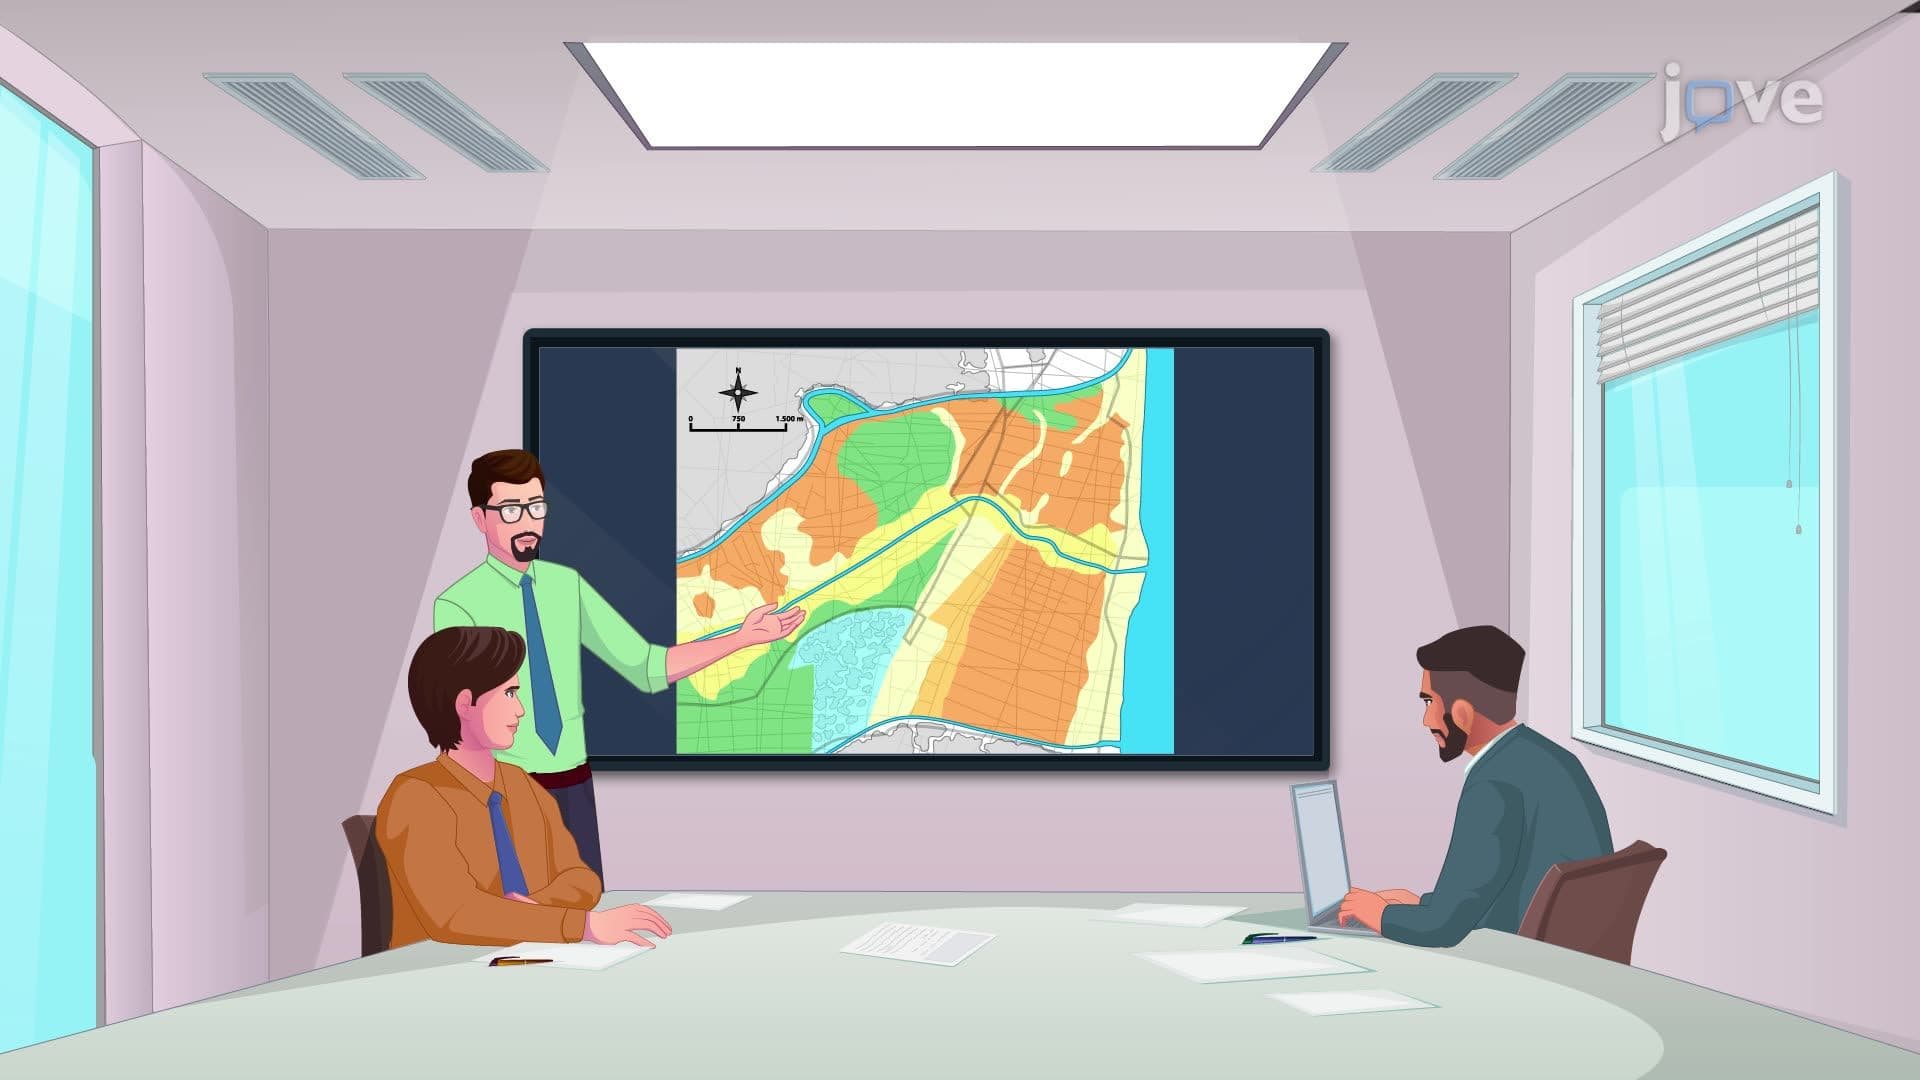
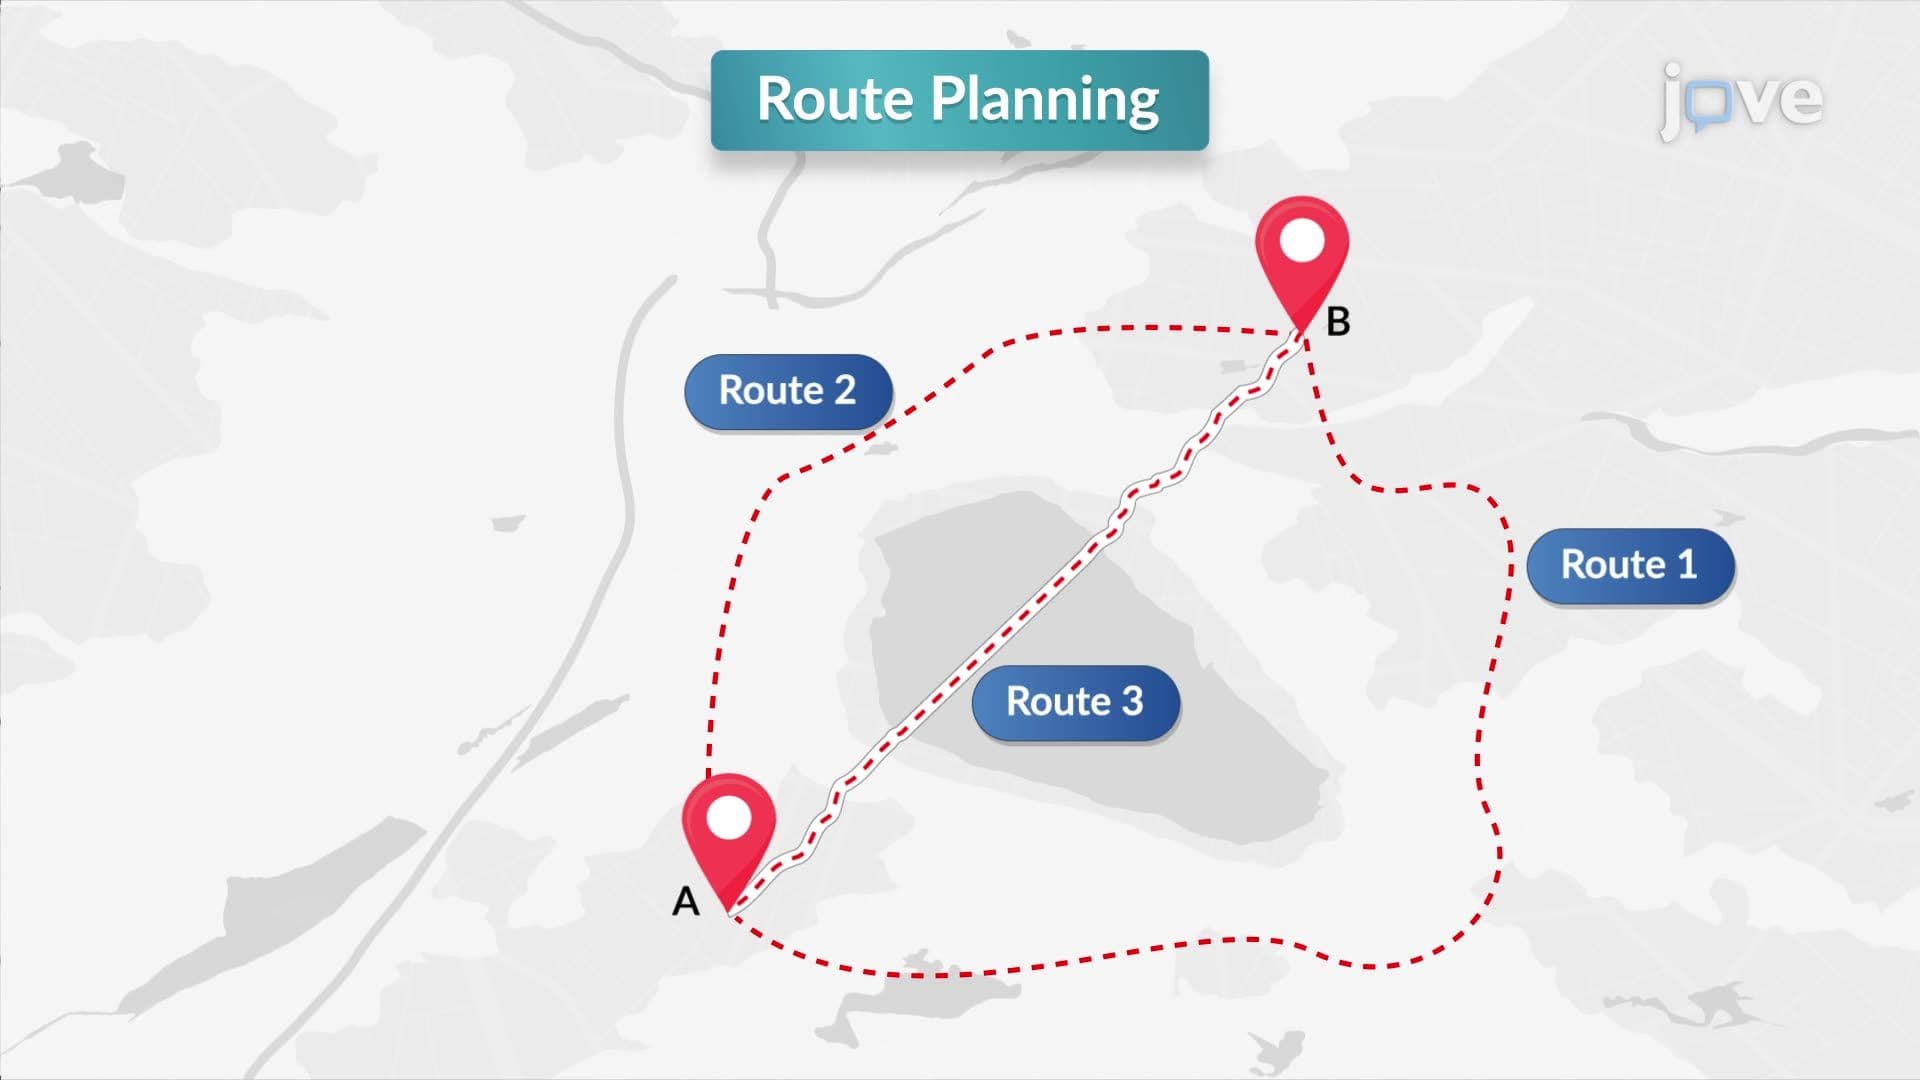
The analytical level transforms static spatial data into meaningful insights through pattern recognition and relationship analysis. This selected data about geographic locations overview encompasses sophisticated functions including shortest path calculations, spatial clustering, demographic analysis, and proximity assessments. The California Department of Transportation exemplifies this level through their traffic flow analysis systems, which evaluate congestion patterns, identify bottleneck locations, and optimize signal timing across major metropolitan areas.
College students studying urban planning or environmental science frequently encounter analytical GIS applications in coursework, particularly when examining population density distributions, land use patterns, or environmental impact assessments. This level requires understanding of spatial statistics, buffer analysis, and overlay operations that appear regularly on standardized geography exams.
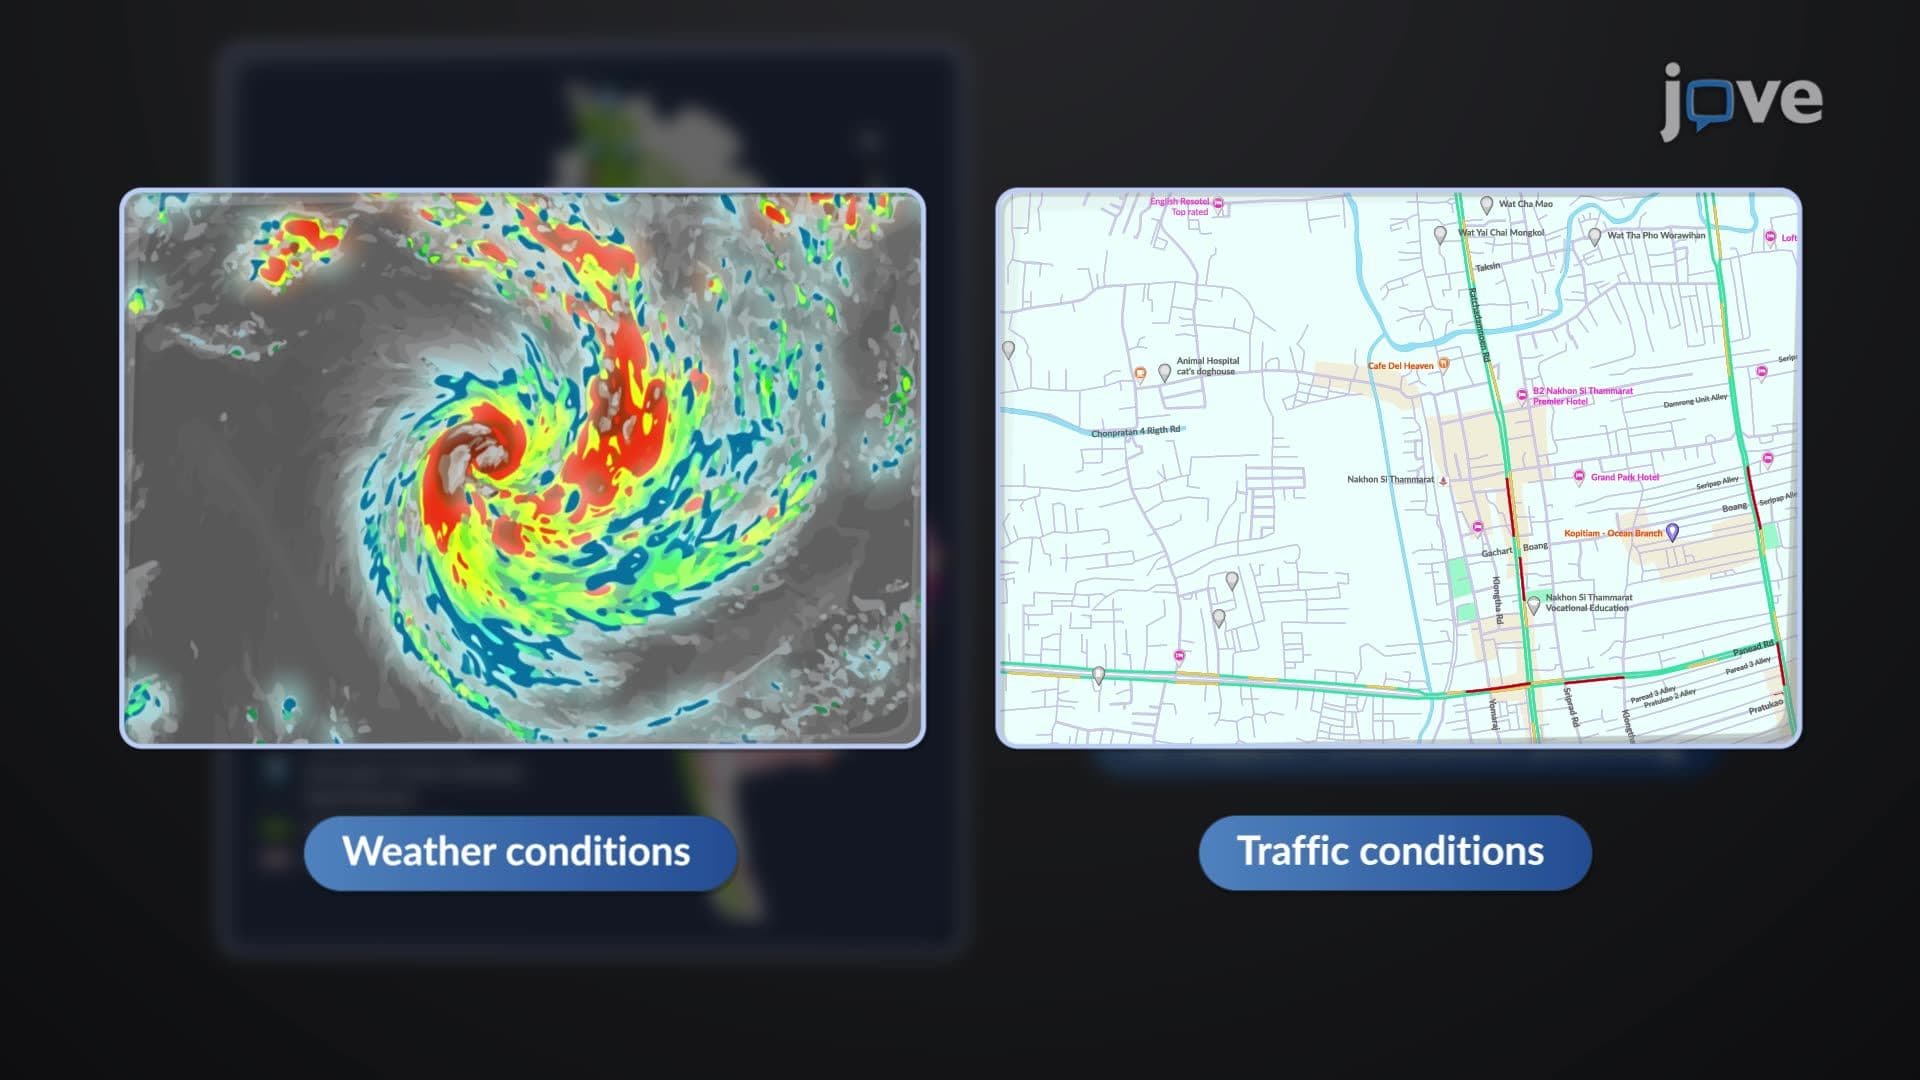
The most sophisticated level employs selected data about geographic locations for predictive modeling and scenario planning. The National Hurricane Center demonstrates this advanced capability through their storm surge prediction models, which integrate meteorological data, topographical information, and population distributions to forecast potential impacts and guide evacuation planning. Similarly, the United States Geological Survey uses predictive GIS modeling for earthquake risk assessment, wildfire behavior prediction, and flood plain management.
This selected data about geographic locations complete guide level challenges students to think critically about spatial relationships over time, incorporating variables such as climate change projections, demographic shifts, and economic development patterns. Advanced placement and college-level coursework increasingly emphasize these predictive capabilities as essential tools for addressing contemporary environmental and social challenges.
Related Micro-courses