Loading subject page…


13,776 views

Video Summary: Cross Price Elasticity of Demand Explained
Ever wonder why Coca-Cola sales spike when Pepsi raises prices? Cross price elasticity of demand reveals these hidden market connections by measuring how one product's price change affects another's quantity demanded. When McDonald's increases burger prices by 15%, Burger King might see a 12% jump in sales-demonstrating positive cross-elasticity between substitute goods. Understanding Cross Price Elasticity of Demand Explained helps predict consumer behavior and competitive market dynamics. Watch the full video on JoVE Coach to master this concept with expert-led visuals and step-by-step explanations.
Cross price elasticity of demand quantifies the relationship between two goods by measuring how responsive the quantity demanded of one product is to price changes in another. This economic concept goes beyond simple supply and demand, revealing the intricate web of consumer preferences and market interdependencies that drive purchasing decisions.
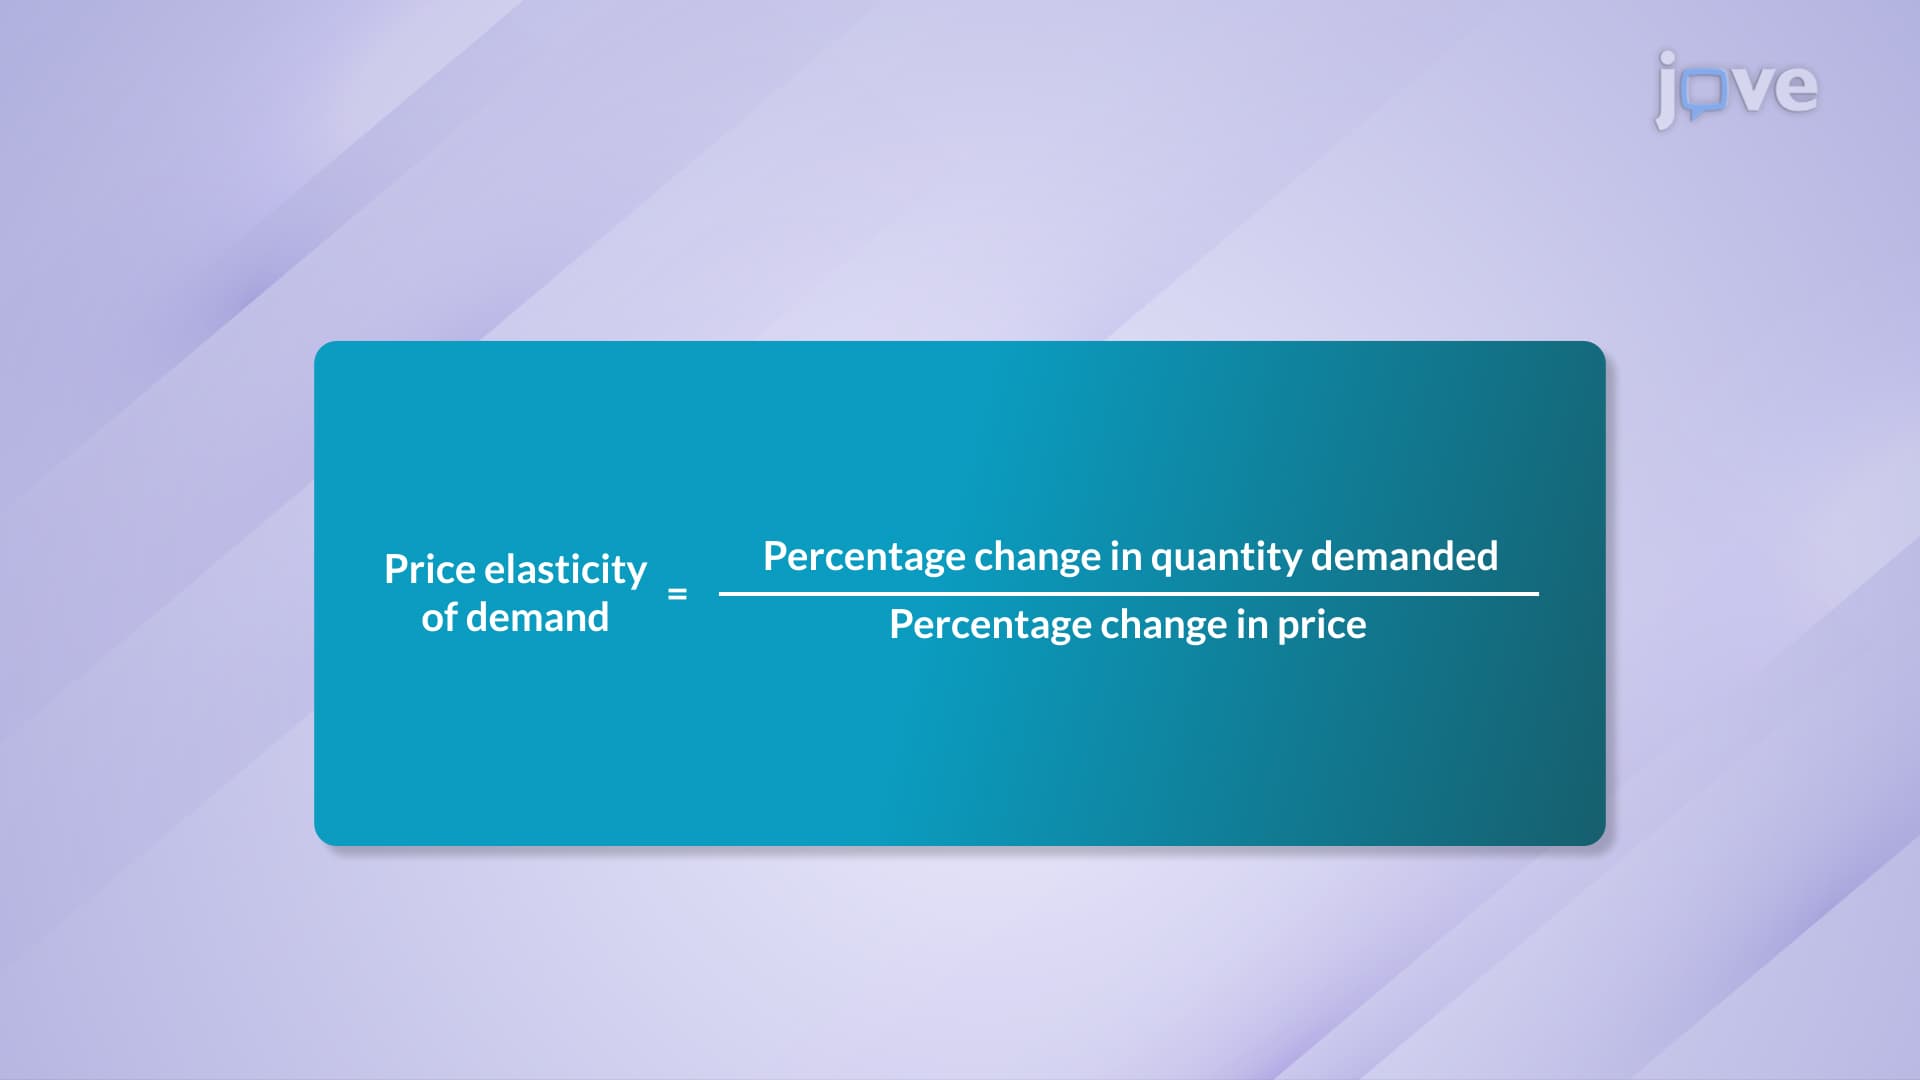
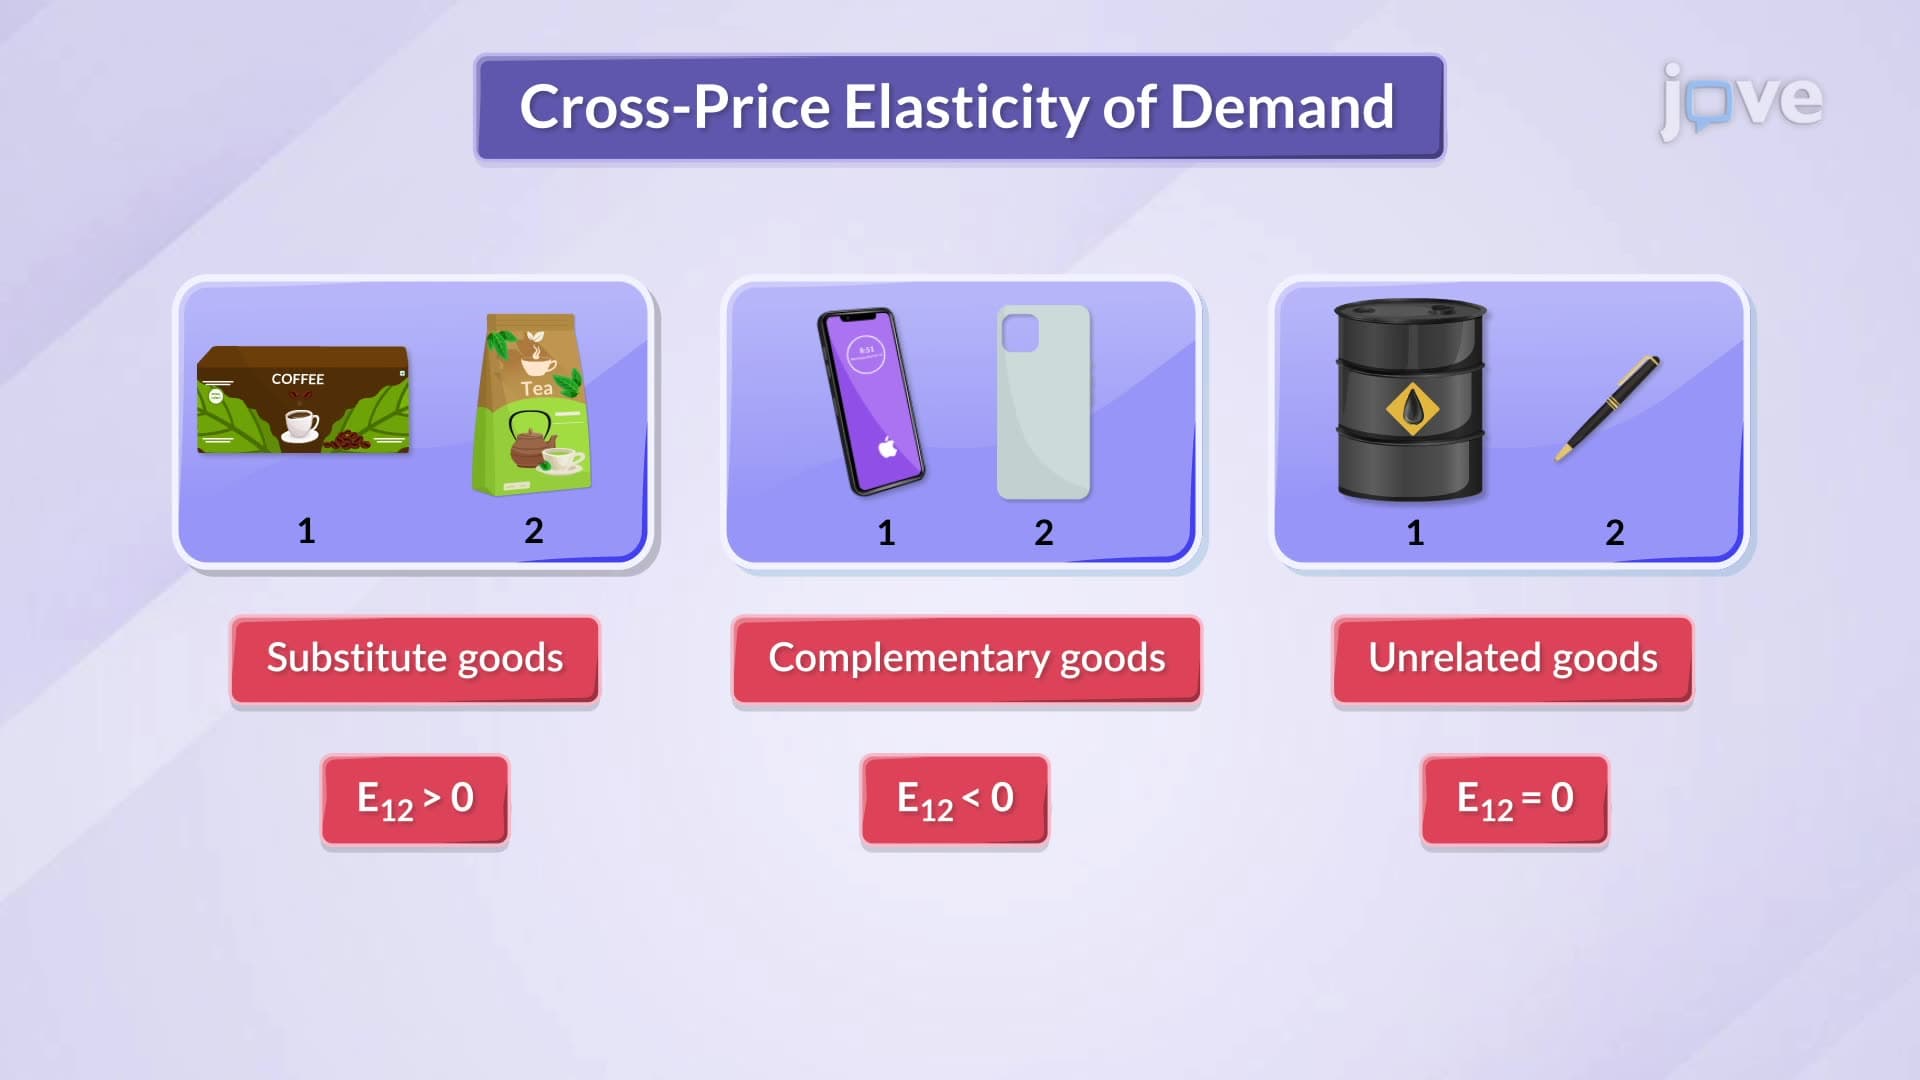
The formula appears straightforward: Cross Price Elasticity = (% Change in Quantity Demanded of Good A) / (% Change in Price of Good B). However, interpreting the results requires understanding three distinct market relationships that emerge from the calculation.
When cross-price elasticity yields a positive value, the goods function as substitutes in consumers' minds. Consider the streaming wars: when Netflix raised subscription prices by 20% in 2022, Disney+ reported a 15% increase in new subscribers. This positive relationship (0.75 elasticity coefficient) demonstrates how consumers readily switch between similar entertainment services.
American consumers frequently exhibit this behavior across industries. When gasoline prices surge, hybrid car sales typically increase. When brand-name cereal prices rise significantly, store-brand alternatives experience demand spikes. These substitute relationships help explain market competition and consumer loyalty patterns that businesses monitor closely.
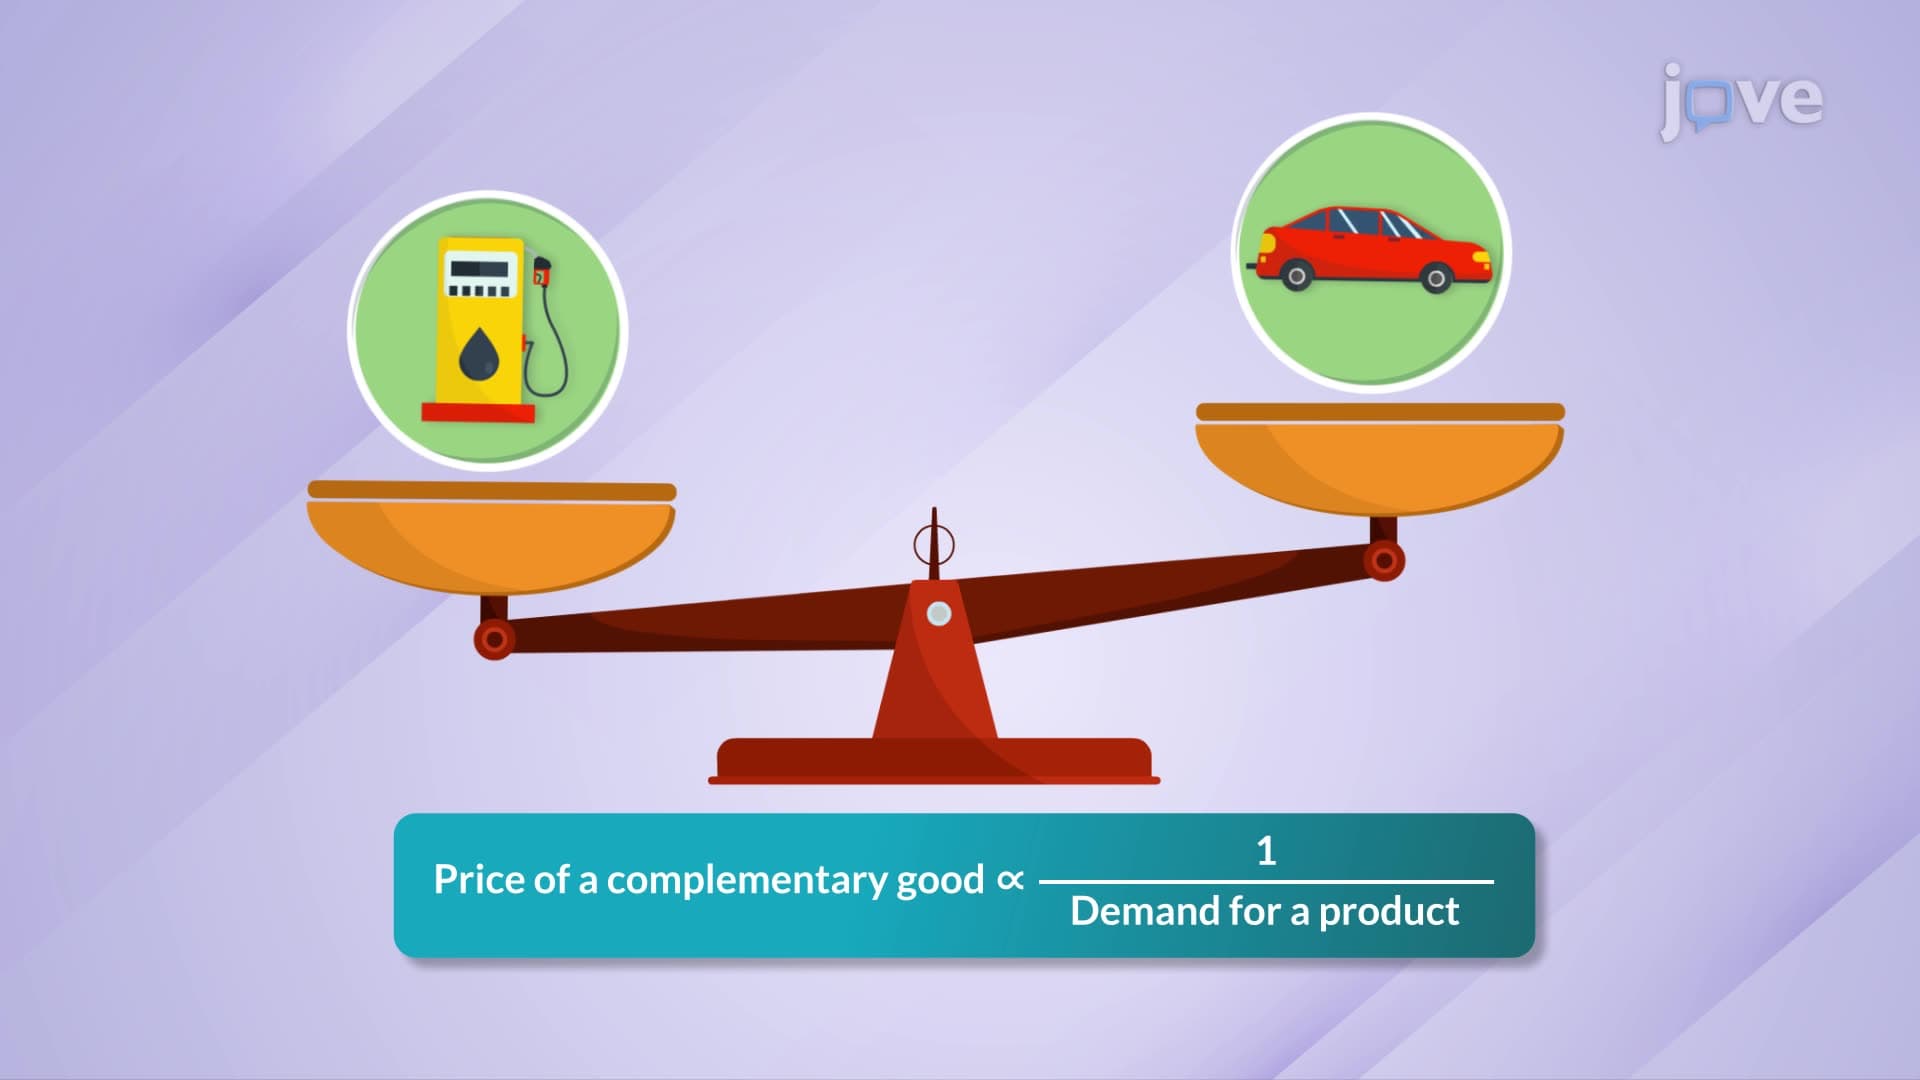
Negative cross-price elasticity reveals complementary goods-products consumed together. The smartphone and phone case example from everyday life illustrates this perfectly. When Apple increased iPhone prices by 10%, accessory manufacturers reported 8% decreased sales for cases and screen protectors, yielding a -0.8 elasticity coefficient.
This relationship extends throughout the American economy. Video game console price increases reduce game software sales. Coffee machine price hikes decrease coffee pod purchases. Understanding these relationships helps retailers bundle products effectively and manufacturers coordinate pricing strategies across product lines.
When cross-price elasticity approaches zero, goods operate independently in consumer decision-making. A 15% increase in movie theater ticket prices rarely affects toothpaste purchases, illustrating market independence.
For AP Economics students and college microeconomics courses, mastering cross-price elasticity calculations proves essential for exam success. Practice problems frequently test your ability to identify relationship types, calculate coefficients, and predict market outcomes. Business students applying to programs requiring GMAT preparation will encounter similar analytical challenges in quantitative reasoning sections.
Related Micro-courses