Loading video…


 21 Concepts
 13.8K views

Video Summary: What Is Elasticity Linear Demand Curve
Ever wonder why Netflix can charge $15/month while a gallon of milk stays around $3? The answer lies in understanding elasticity linear demand curve behavior. This fundamental economic concept reveals how consumer responsiveness to price changes varies dramatically along a single demand line. For instance, when Apple raises iPhone prices by 10%, sales might drop only 3% (inelastic), but a 10% increase in movie theater tickets could slash attendance by 15% (elastic). What is Elasticity Linear Demand Curve demonstrates this fascinating relationship between price sensitivity and market position. Watch the full video on JoVE Coach to master this concept with expert-led visuals and step-by-step explanations.
The elasticity linear demand curve concept reveals a counterintuitive truth: even though a linear demand curve has a constant slope, its elasticity changes dramatically from point to point. This occurs because elasticity depends not just on the slope (change in price over change in quantity), but also on the specific price and quantity values at each point along the curve.
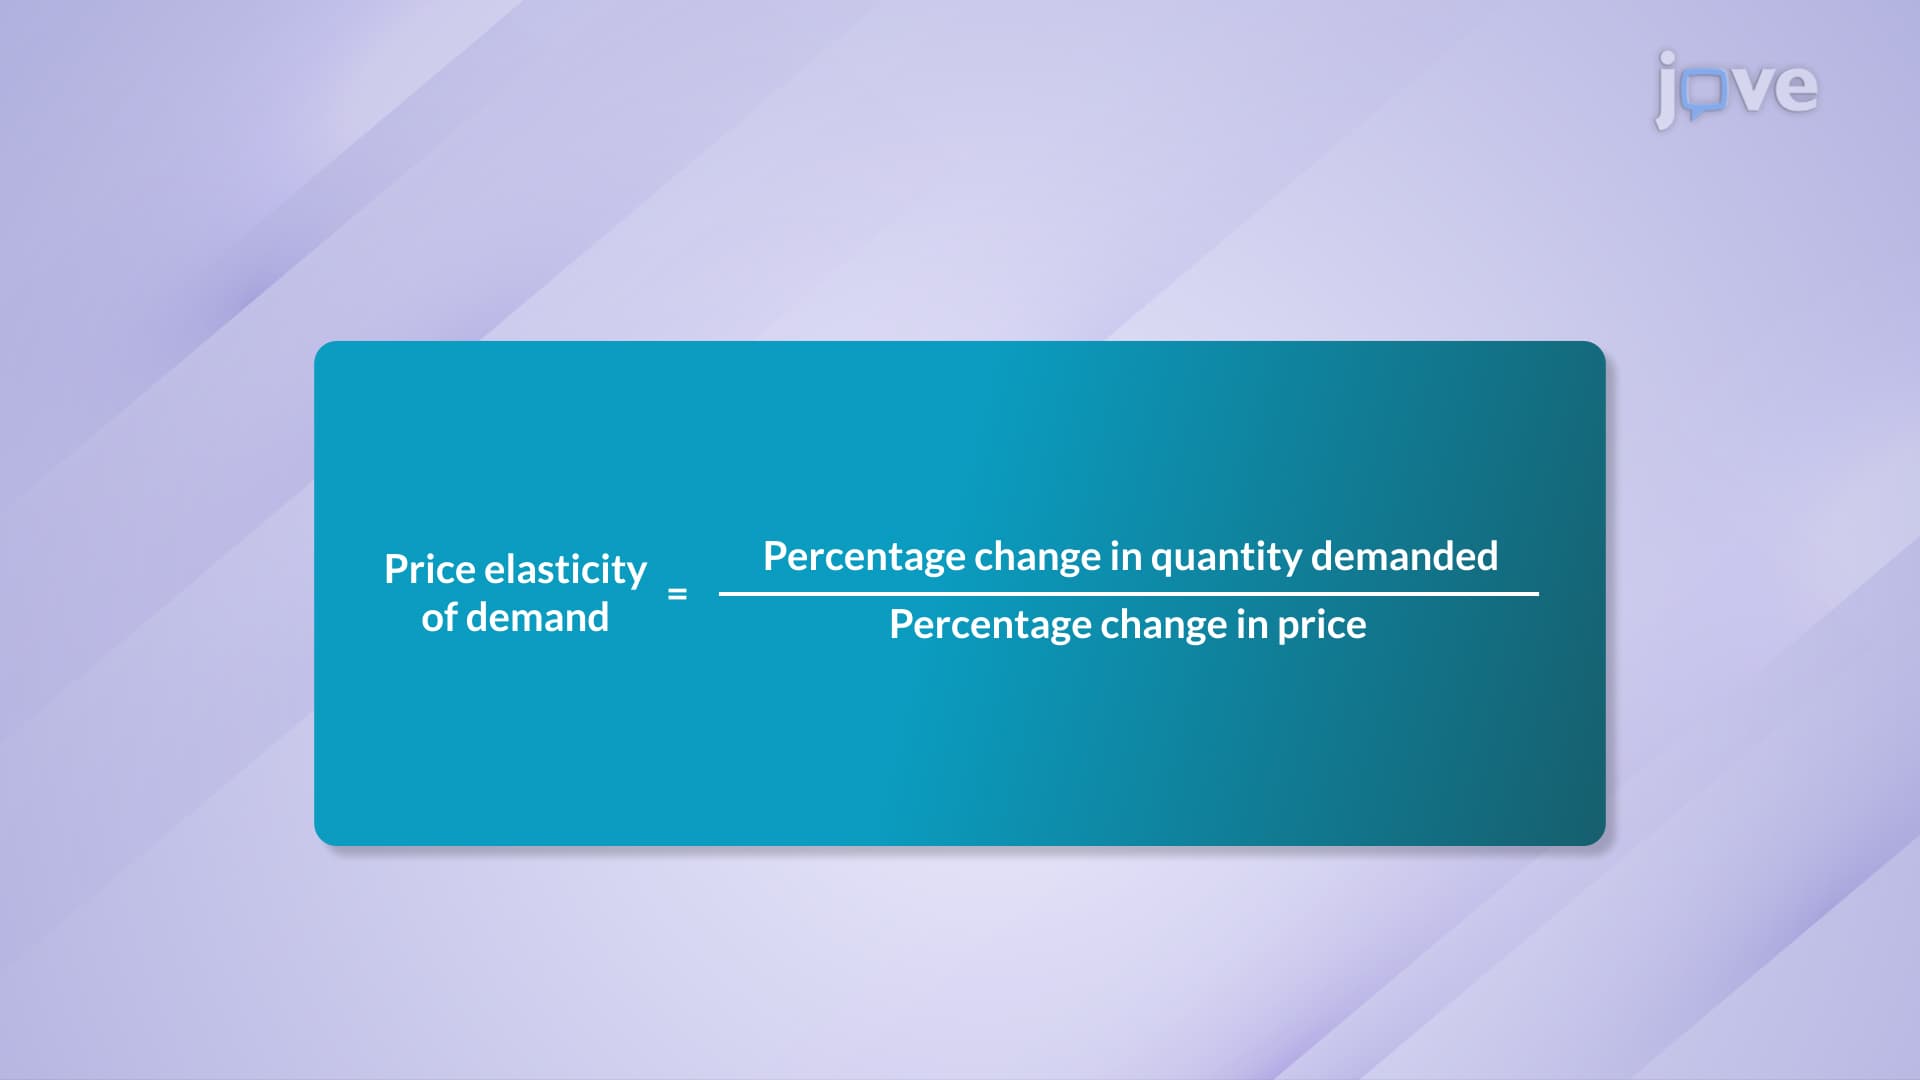
The mathematical foundation rests on the price elasticity formula: elasticity = (% change in quantity demanded) / (% change in price). For any linear demand curve, this translates to: elasticity = (ΔQ/ΔP) × (P/Q). While ΔQ/ΔP remains constant (the slope), the P/Q ratio varies significantly as you move along the curve.
At the top of a linear demand curve, where price is highest and quantity approaches zero, elasticity approaches infinity-perfectly elastic demand. Here, consumers are extremely sensitive to price changes. Think of luxury goods like designer handbags: a small price increase can drastically reduce purchases.
Moving downward, we enter the elastic region (elasticity > 1) where percentage changes in quantity exceed percentage changes in price. This is where companies like streaming services often operate-customers are price-sensitive but still willing to pay for the service.
The midpoint represents unitary elasticity (elasticity = 1), where percentage changes in price and quantity are equal. This point maximizes total revenue, making it crucial for business strategy.
Below the midpoint lies the inelastic region (elasticity < 1), where price changes have smaller effects on quantity demanded. Essential goods like gasoline or prescription medications typically operate here-people need them regardless of moderate price increases.
Finally, at the horizontal intercept where price equals zero, elasticity becomes zero (perfectly inelastic), though this theoretical point rarely exists in real markets.
Understanding elasticity linear demand curves proves essential for AP Economics students and college microeconomics courses. The concept frequently appears on AP exams, particularly in questions about revenue optimization and market analysis. Students often encounter problems requiring them to identify which region of the demand curve a business operates in, or to calculate how price changes affect total revenue.
For instance, when analyzing why movie theaters charge less for matinee showings, the answer lies in recognizing that different consumer segments operate on different portions of the demand curve. Price-sensitive customers (students, seniors) respond elastically to price changes, while convenience-seeking customers show more inelastic behavior.
This concept also appears in business case studies, where companies must decide whether to raise or lower prices based on their position on the demand curve. Understanding that the same product can exhibit both elastic and inelastic characteristics depending on the price point helps explain complex pricing strategies across industries.
Related Micro-courses