Loading subject page…


13,776 views


Video Summary: What Is Elasticity and Slope
Ever wonder why gas prices soar but people still drive to work? The elasticity slope relationship reveals this puzzle. While slope measures how steeply demand curves fall, elasticity captures true price sensitivity-explaining why Americans reduce luxury purchases more than necessities when costs rise. Understanding What is Elasticity And Slope helps predict consumer behavior across different markets, from iPhone demand to college tuition responses. Watch the full video on JoVE Coach to master this concept with expert-led visuals and step-by-step explanations.
What is Elasticity And Slope represents two distinct ways economists measure demand responsiveness. Slope calculates the absolute change in quantity demanded per unit price change, expressed as ΔQ/ΔP. This measurement depends heavily on the units chosen-whether prices are in dollars or cents dramatically affects slope values, making cross-product comparisons nearly impossible.
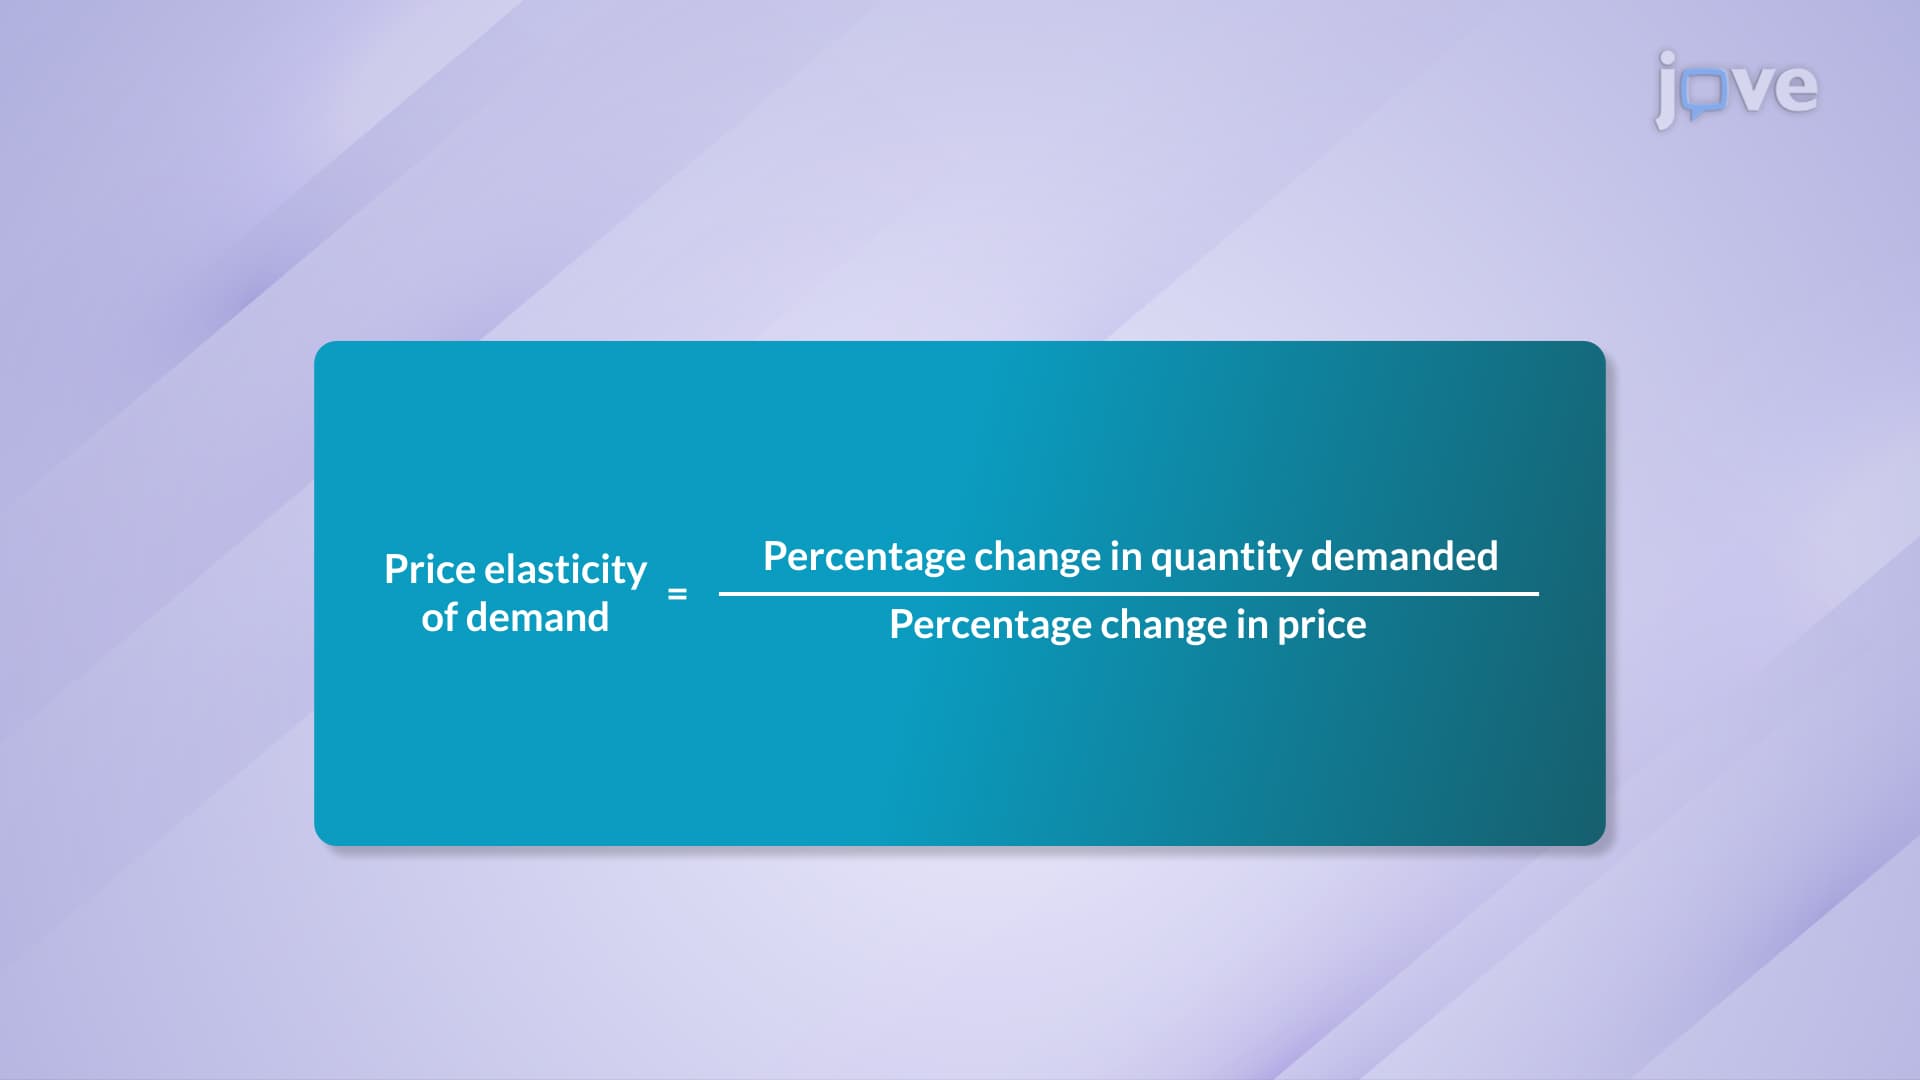
Elasticity, conversely, measures percentage changes: the percent change in quantity demanded divided by the percent change in price. This unit-free measurement allows economists to compare vastly different products-from Tesla vehicles to Starbucks coffee-on equal footing.
Consider two identical products: one priced at $50 and another at 5,000 cents. Their demand curves appear different when graphed, despite representing the same market behavior. The dollar-priced good shows a gentle slope, while the cent-priced version displays a steep decline. This elasticity slope discrepancy illustrates why economists prefer elasticity for standardized analysis.
American businesses face this challenge constantly. Netflix subscription data measured in monthly fees versus annual payments would show different slopes, but identical elasticities-revealing the true consumer price sensitivity that guides strategic decisions.
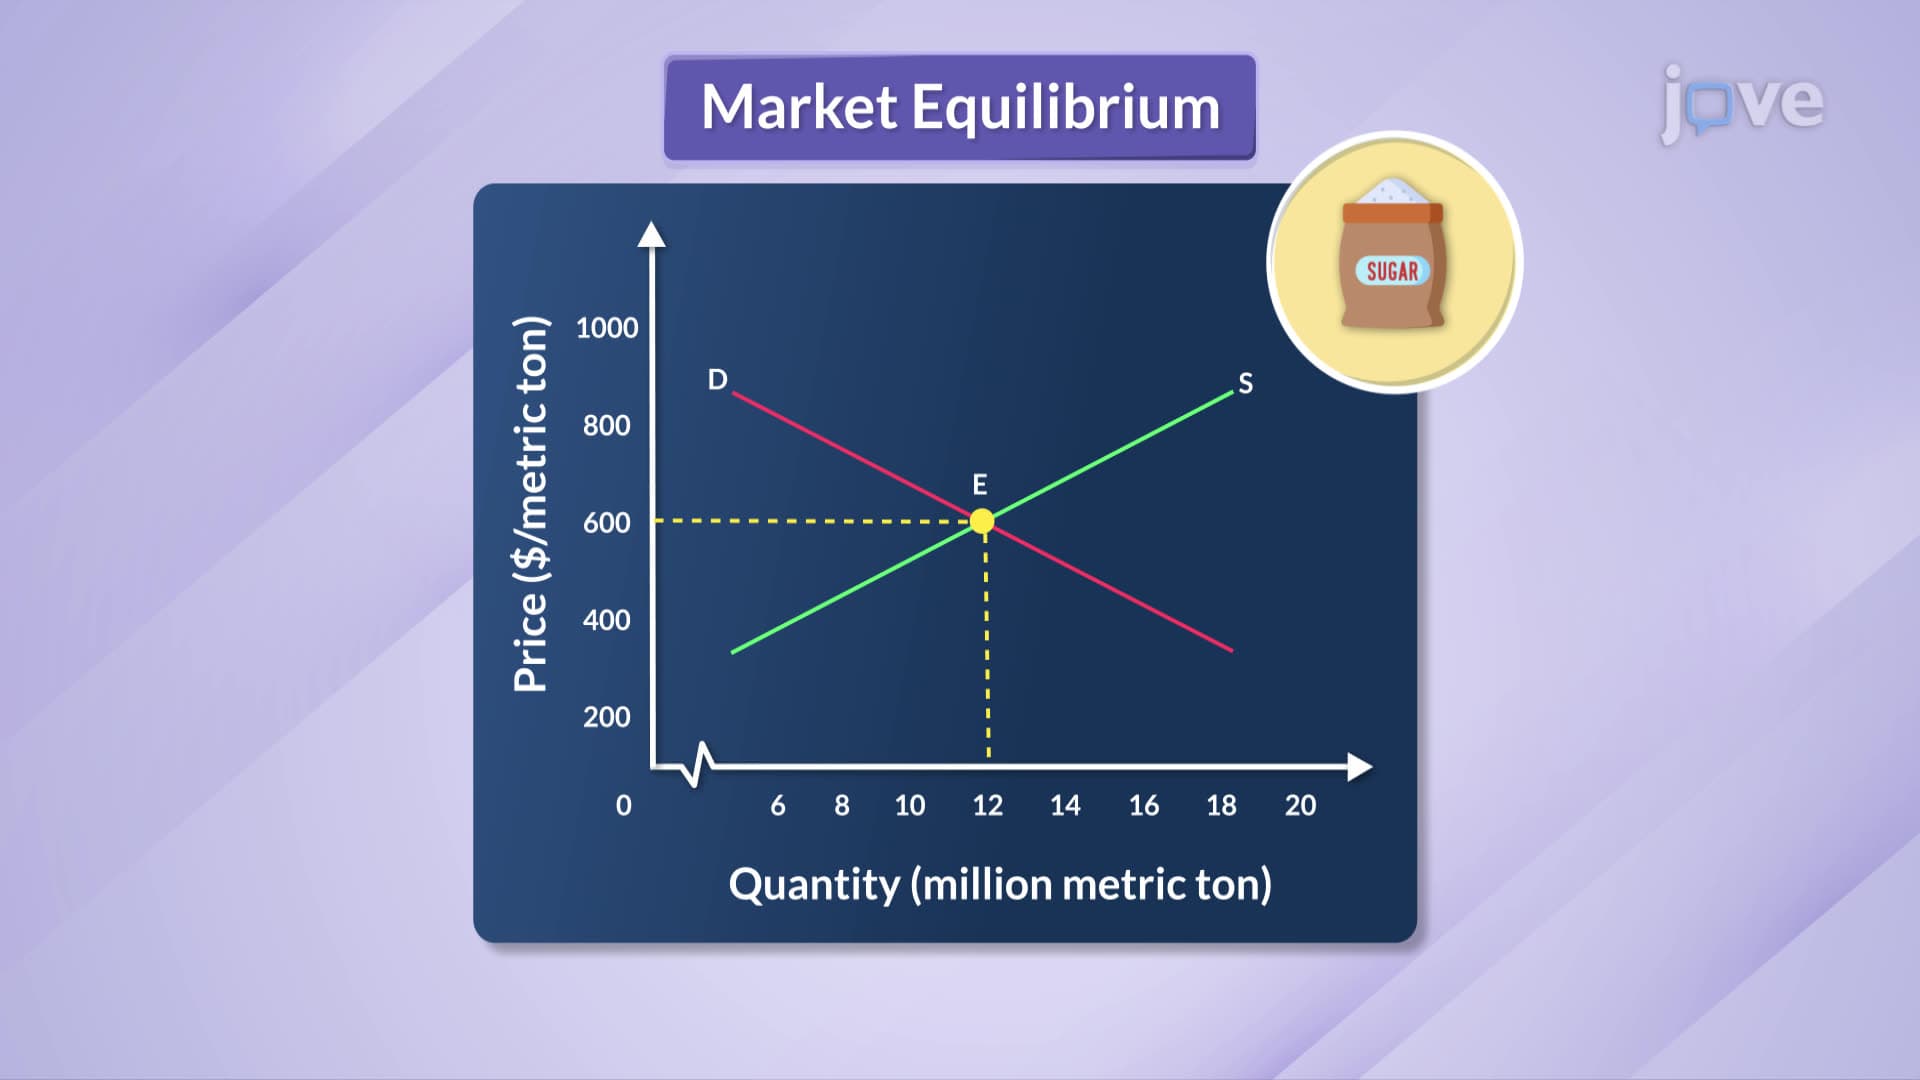
A surprising insight emerges from elasticity and slope definition explained: linear demand curves maintain constant slopes but exhibit changing elasticity along their length. At higher prices with lower quantities, demand appears more elastic (consumers respond strongly to price changes). At lower prices with higher quantities, the same curve shows less elasticity.
This relationship proves crucial for AP Economics students and college microeconomics courses. The mathematical connection follows: Elasticity = (1/Slope) × (P/Q). As you move along a linear demand curve, the slope stays constant, but the P/Q ratio changes, altering elasticity values.
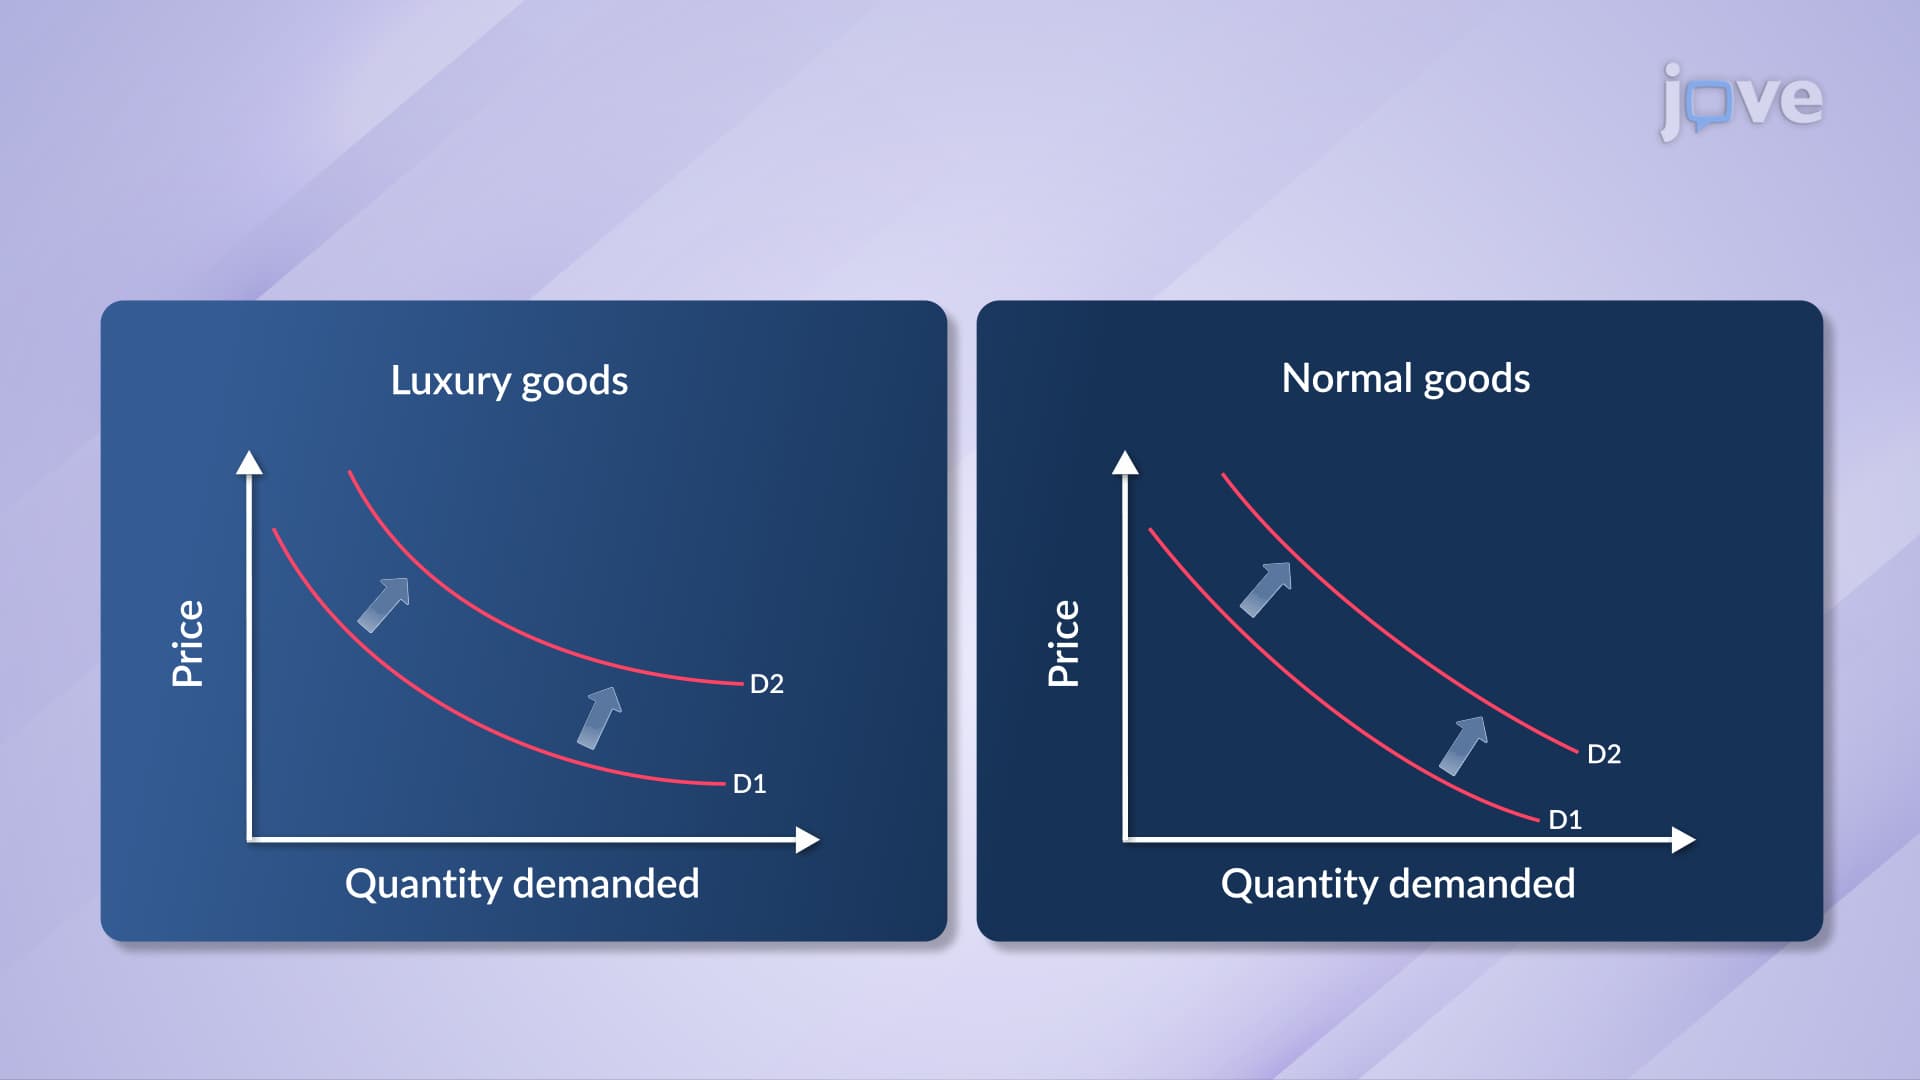
Understanding elasticity slope overview helps explain market phenomena across US industries. Gasoline demand shows low elasticity-Americans still drive despite price increases-but high absolute slope values due to large quantity measurements. Luxury goods like designer handbags exhibit high elasticity, with consumers dramatically reducing purchases when prices rise, even if the slope appears modest.
This concept appears frequently in standardized exams, from AP Microeconomics to college midterms, where students must distinguish between these measures for accurate economic analysis and policy recommendations.
Related Micro-courses