Loading subject page…


13,776 views

Video Summary: What Is Mathematical Representation Demand Curve
Ever wondered why Netflix increases prices during peak demand seasons? The mathematical representation demand curve provides the formula economists use to predict exactly how consumers respond to price changes. Using equations like Q_D = 200 - 50P, businesses from Starbucks to Tesla can calculate optimal pricing strategies that maximize revenue while understanding consumer behavior. This quantitative approach transforms abstract economic principles into precise tools for real-world decision-making. Watch the full video on JoVE Coach to master this concept with expert-led visuals and step-by-step explanations.
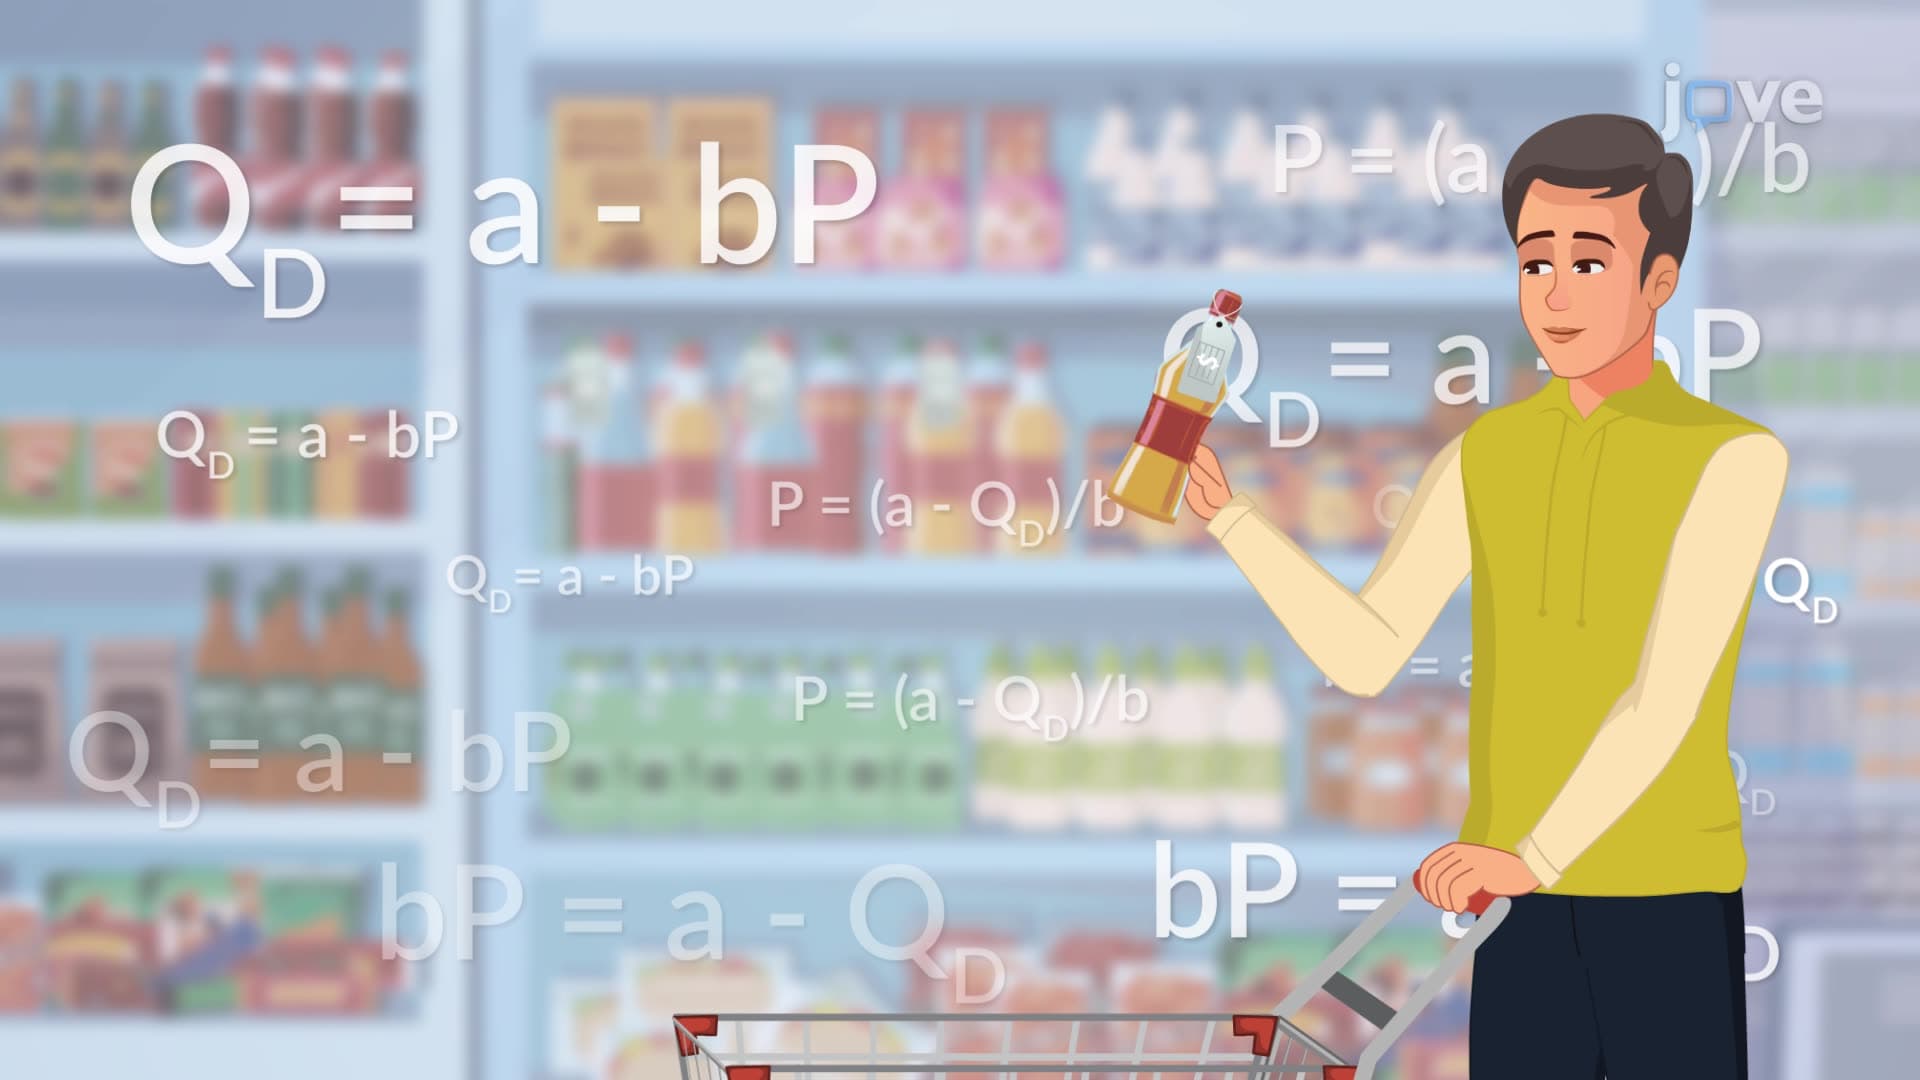
The mathematical representation demand curve transforms economic theory into quantifiable relationships that businesses and policymakers use daily. Unlike qualitative descriptions of consumer behavior, mathematical demand curves provide precise equations that predict how quantity demanded changes with price variations. The standard linear form Q_D = a - bP serves as the foundation for economic analysis across industries, from technology companies setting subscription prices to agricultural markets determining commodity values.
The linear demand equation Q_D = a - bP contains four critical elements that economics students must master for AP Economics exams and college coursework. The variable Q_D represents quantity demanded at any given price point, while P indicates the price per unit. The parameter 'a' serves as the horizontal intercept, showing maximum quantity demanded when price equals zero-though this theoretical point rarely occurs in practice. The coefficient 'b' determines the slope's steepness, indicating how sensitive consumers are to price changes.
Consider Amazon's pricing strategy for Prime memberships. If their internal demand equation were Q_D = 150 - 2P (in millions of subscribers), this would indicate that at $50 annually, they could expect 50 million subscribers, while at $75, demand would drop to zero. The coefficient '2' shows that each dollar increase reduces demand by 2 million subscribers, helping Amazon optimize their pricing strategy.
The demand choke price represents the maximum price at which quantity demanded reaches zero-a crucial concept for businesses setting upper price limits. Using the equation P = (a - Q_D)/b, companies can calculate this threshold. For instance, if a local coffee shop's demand follows Q_D = 100 - 25P, the choke price would be $4 per coffee. This mathematical insight helps businesses avoid pricing themselves out of the market while maximizing revenue potential.
While linear demand curves provide valuable insights for standardized tests like the SAT Subject Tests and college economics courses, actual market behavior often follows non-linear patterns. Companies like Apple experience demand curves that may flatten at premium price points due to brand loyalty, while essential goods like gasoline show relatively inelastic demand regardless of price changes. Understanding these limitations helps students critically evaluate when mathematical models apply and when additional factors require consideration.
Related Micro-courses