Loading subject page…

154,408 views

Video Summary: What are Types of Skewness
Ever wonder why most Americans earn less than the "average" income, yet the average keeps rising? The answer lies in understanding the types of skewness that shape data distributions. When datasets aren't perfectly balanced, they create distinct patterns that reveal hidden stories in the numbers. For instance, US household income data shows positive skewness because a small percentage of high earners pulls the average upward, while most families cluster around lower income levels. Watch the full video on JoVE Coach to master this concept with expert-led visuals and step-by-step explanations.
Types of skewness represent fundamental patterns that emerge when data distributions deviate from perfect symmetry. These patterns occur frequently in real-world datasets and significantly impact how we interpret statistical results. Mastering skewness concepts is essential for students preparing for AP Statistics, college statistics courses, and standardized tests like the SAT Math section.
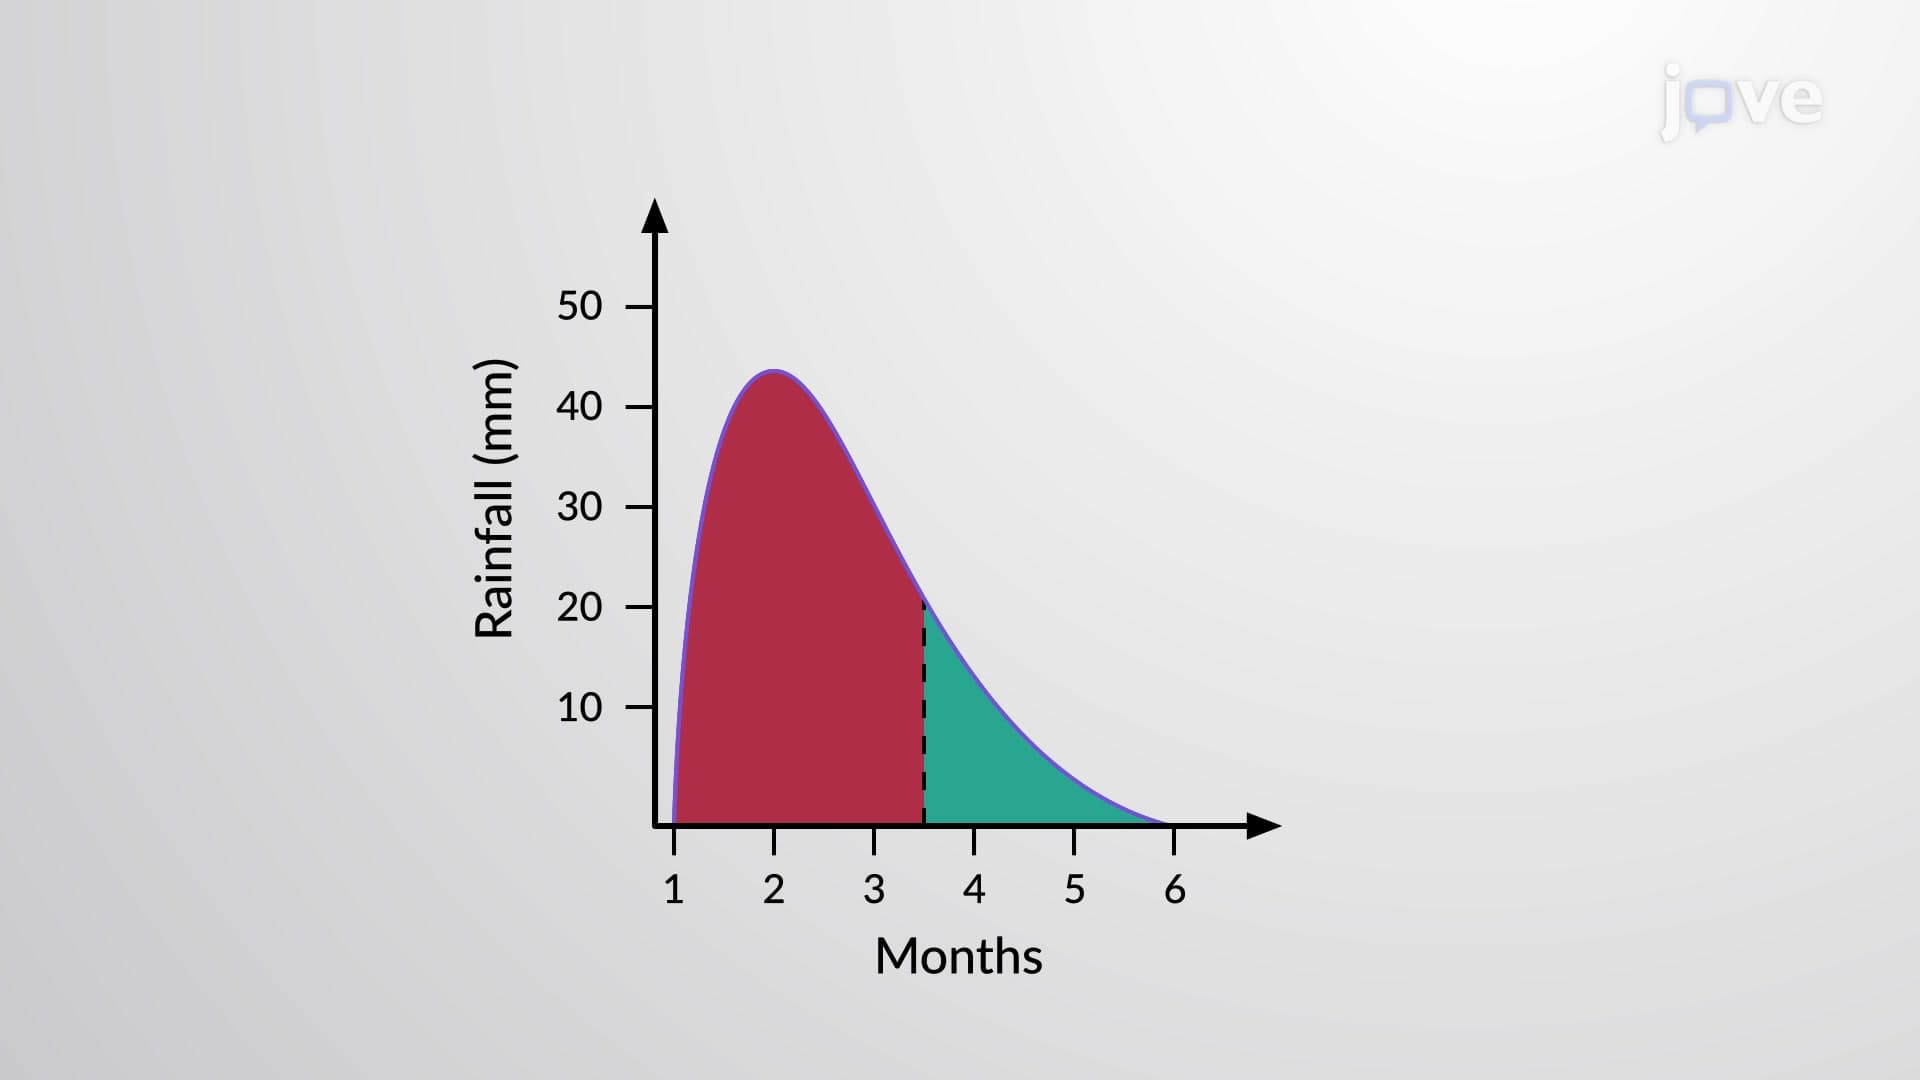
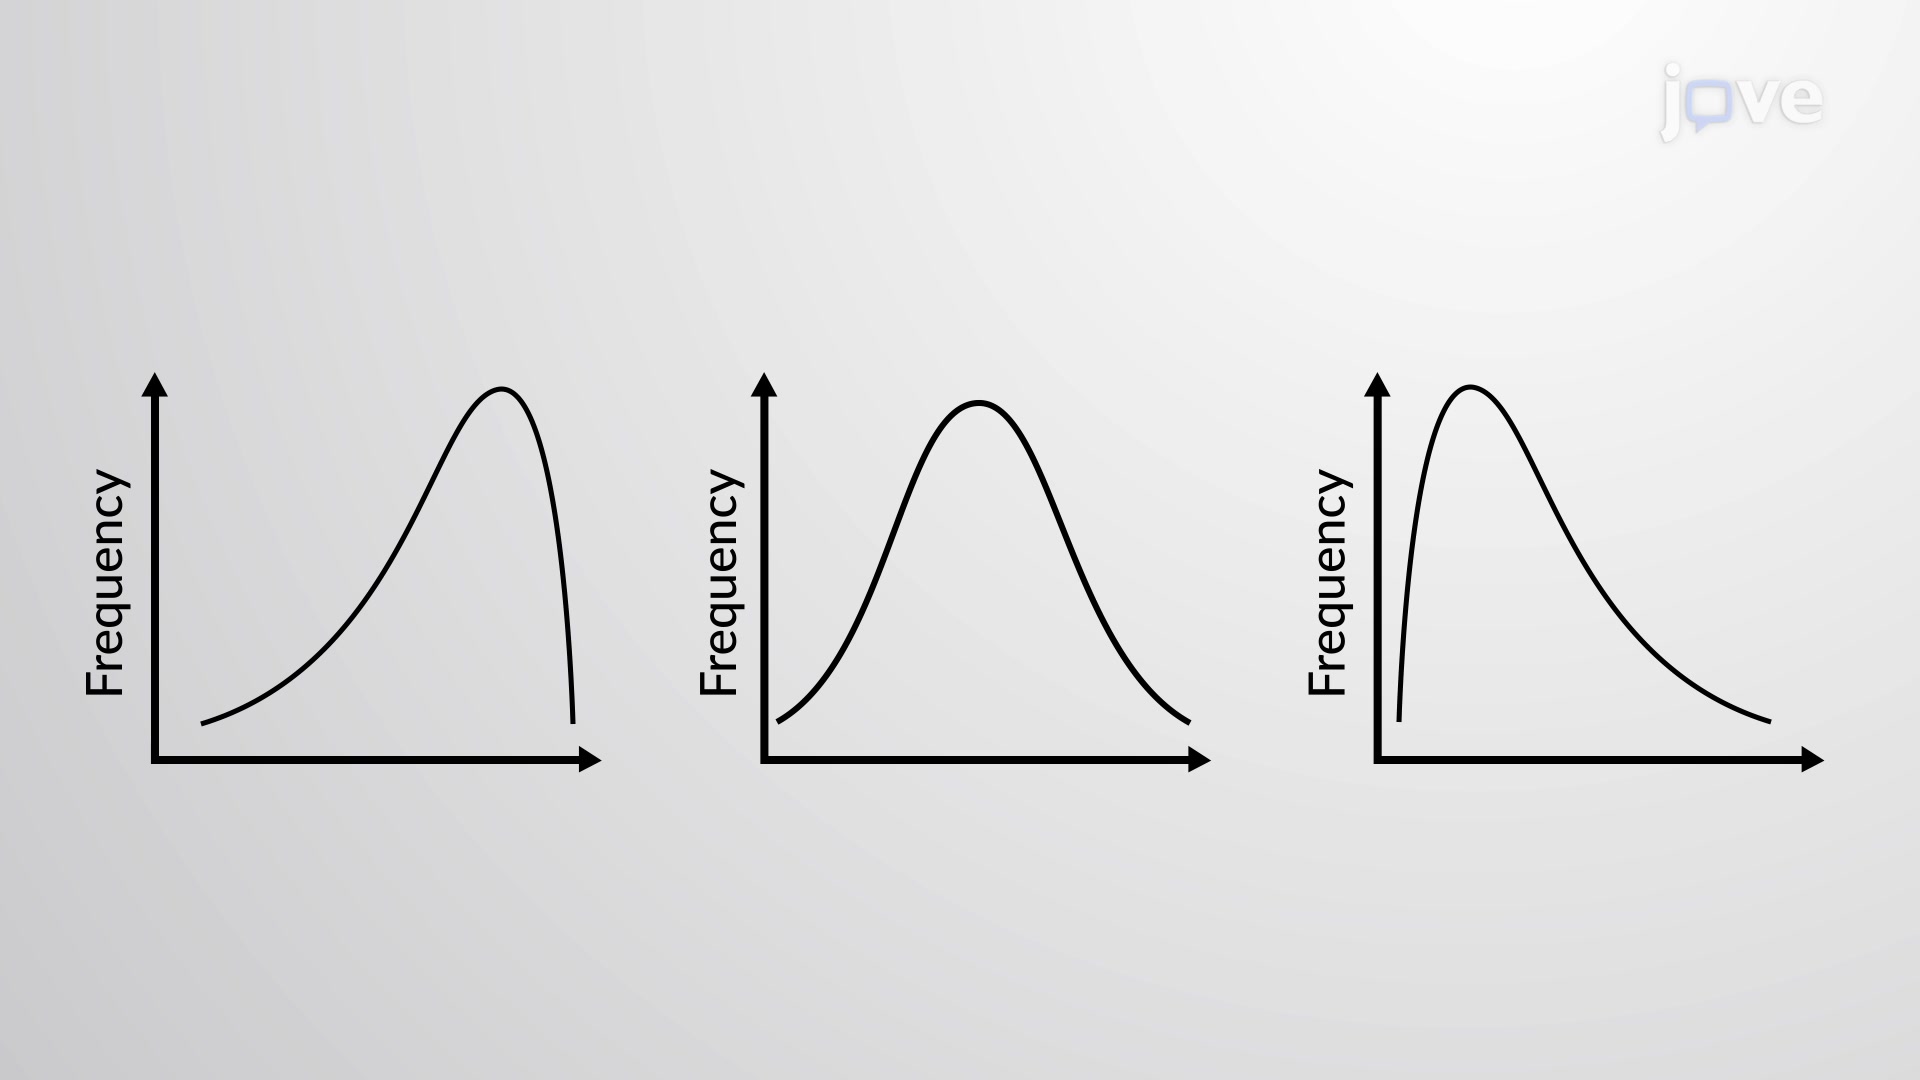
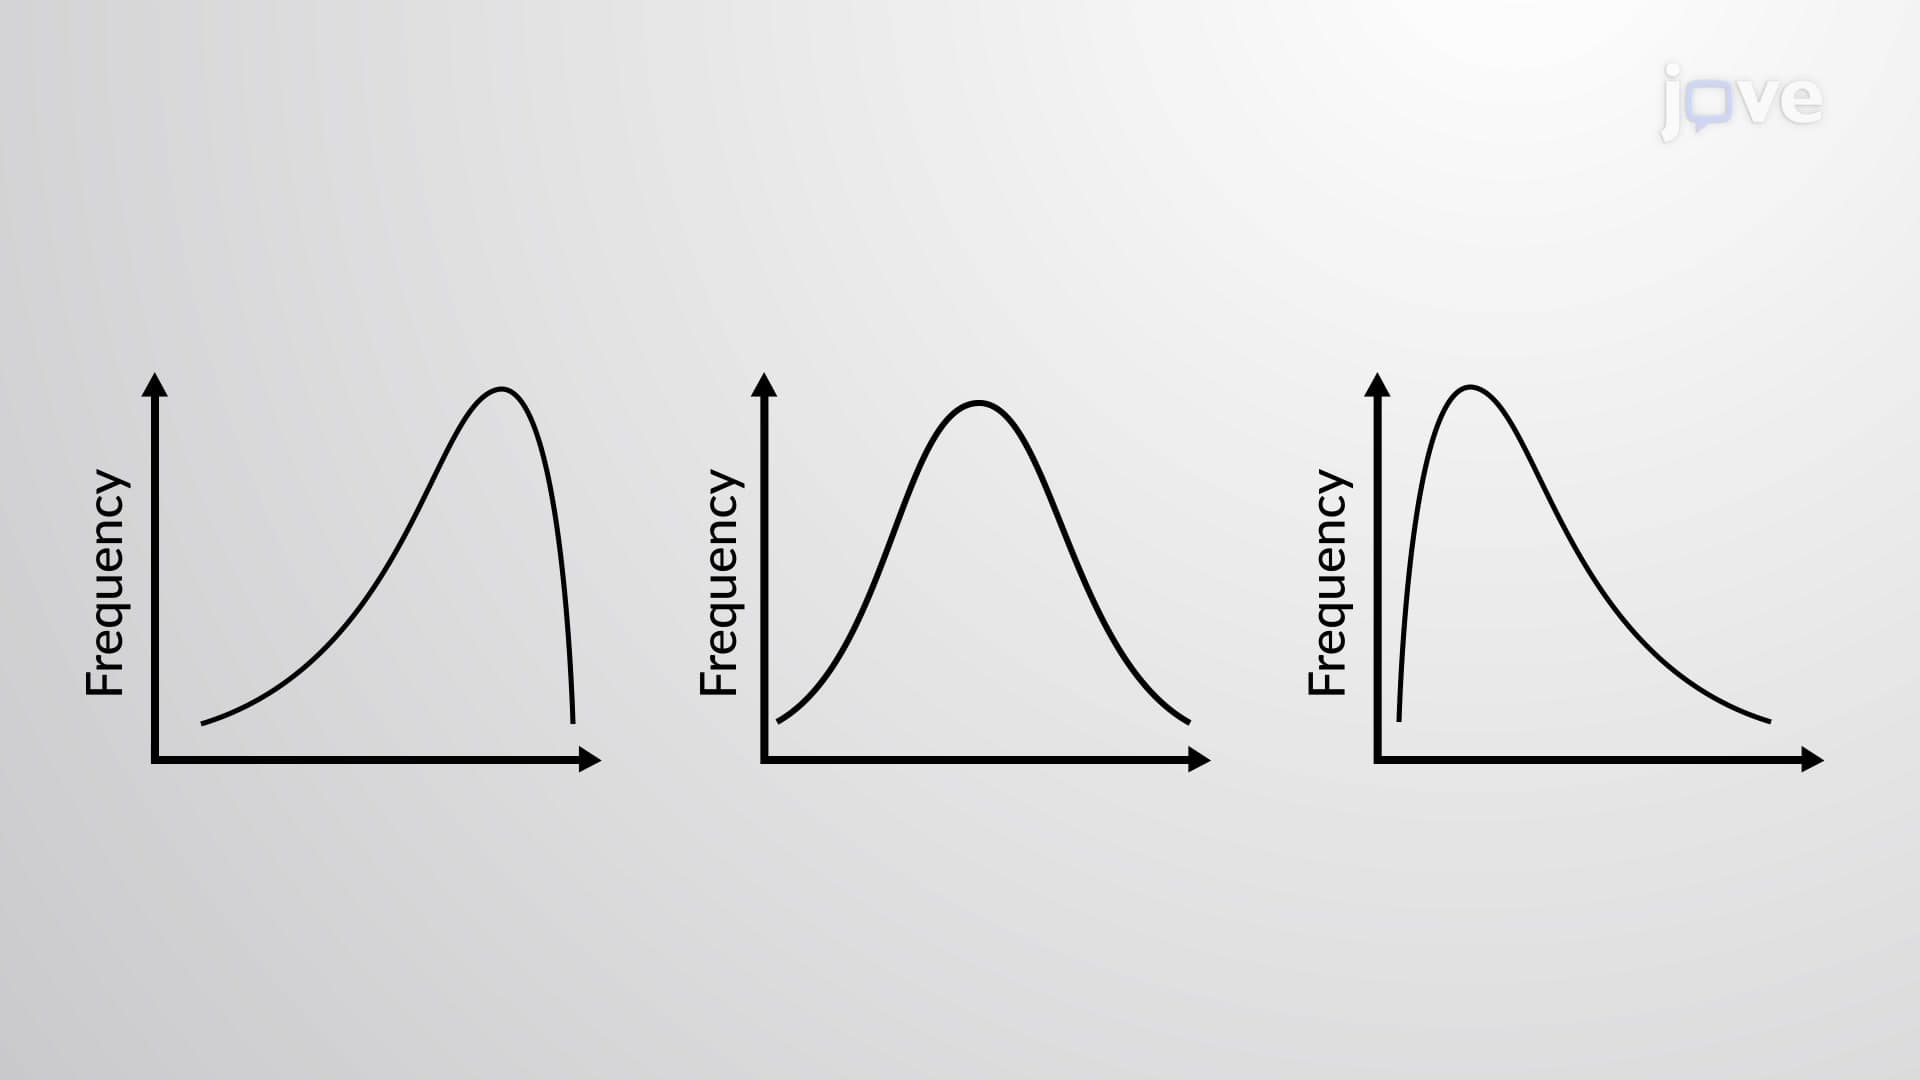
Positive Skewness (Right-Skewed Distribution) Positive skewness occurs when data extends further toward higher values, creating a longer tail on the right side of the distribution. In positively skewed data, the mean exceeds the median, which in turn exceeds the mode. Classic examples include US household income data, where most families earn moderate amounts while a small percentage earns significantly more, pulling the average upward. Real estate prices in major US cities like San Francisco or New York also demonstrate positive skewness, with most properties at moderate prices and fewer extremely expensive properties creating the extended right tail.
Negative Skewness (Left-Skewed Distribution) Negative skewness appears when data concentrates toward higher values with a longer tail extending toward lower values. Here, the mode exceeds the median, which exceeds the mean. A prime example is student performance on relatively easy standardized tests, where most students score well, but a few lower scores create the left tail. Age at death in developed countries often shows negative skewness, as most people live to advanced ages while fewer deaths occur at younger ages.
Zero Skewness (Symmetric Distribution) Zero skewness indicates perfect symmetry, where the left and right halves mirror each other exactly. In symmetric distributions, the mean, median, and mode are identical. The classic normal distribution exemplifies zero skewness, commonly seen in standardized test scores designed to follow bell curves, such as SAT scores or IQ measurements.
Understanding skewness proves crucial for students tackling AP Statistics free-response questions, where interpreting distribution shapes determines correct statistical method selection. College students studying business or economics frequently encounter skewed datasets when analyzing market research, consumer behavior, or financial performance metrics. Pre-med students preparing for the MCAT encounter skewness concepts in biological data interpretation, while psychology students analyze skewed reaction time data in experimental research.
Related Micro-courses