Loading video…


 13 Concepts
 154.4K views

Video Summary: Central Tendency Definition
Did you know that Major League Baseball batting averages, Netflix recommendation algorithms, and college admissions all rely on the same fundamental statistical concept? The central tendency definition describes statistical measures that identify a single representative value from a dataset. For instance, when the College Board reports that the average SAT score is 1050, they're using central tendency to summarize thousands of individual test scores into one meaningful number. Watch the full video on JoVE Coach to master this concept with expert-led visuals and step-by-step explanations.
The central tendency definition encompasses statistical measures designed to capture the "center" of a dataset with a single representative value. Think of it as finding the most typical or characteristic value that best summarizes an entire collection of data points. This concept forms the foundation of descriptive statistics and appears frequently in AP Statistics, college statistics courses, and standardized test questions.
Mean (Arithmetic Average) represents the sum of all values divided by the number of observations. When college admissions officers say the average GPA of admitted students is 3.7, they're reporting the mean. This measure works best with normally distributed data but can be misleading when extreme values (outliers) are present.
Median identifies the middle value when data is arranged in ascending order. If you ranked all SAT Math scores from lowest to highest, the median would be the score exactly in the middle position. The median remains stable even with extreme outliers, making it ideal for skewed distributions like household income data.
Mode pinpoints the most frequently occurring value in a dataset. In a survey of favorite pizza toppings among high school students, pepperoni might be the mode if chosen most often. Some datasets have multiple modes (bimodal or multimodal), while others have no mode at all.
Midrange calculates the average of the maximum and minimum values. For temperature data ranging from 32°F to 98°F, the midrange would be 65°F. While less commonly used than other measures, midrange provides insight into the data's spread and appears in some standardized test problems.
These measures appear throughout academic and professional contexts. The College Board uses mean scores to set national benchmarks, while the CDC relies on median values to report health statistics because medical data often contains outliers. In AP Statistics, students frequently encounter problems requiring them to choose the most appropriate measure based on data characteristics.
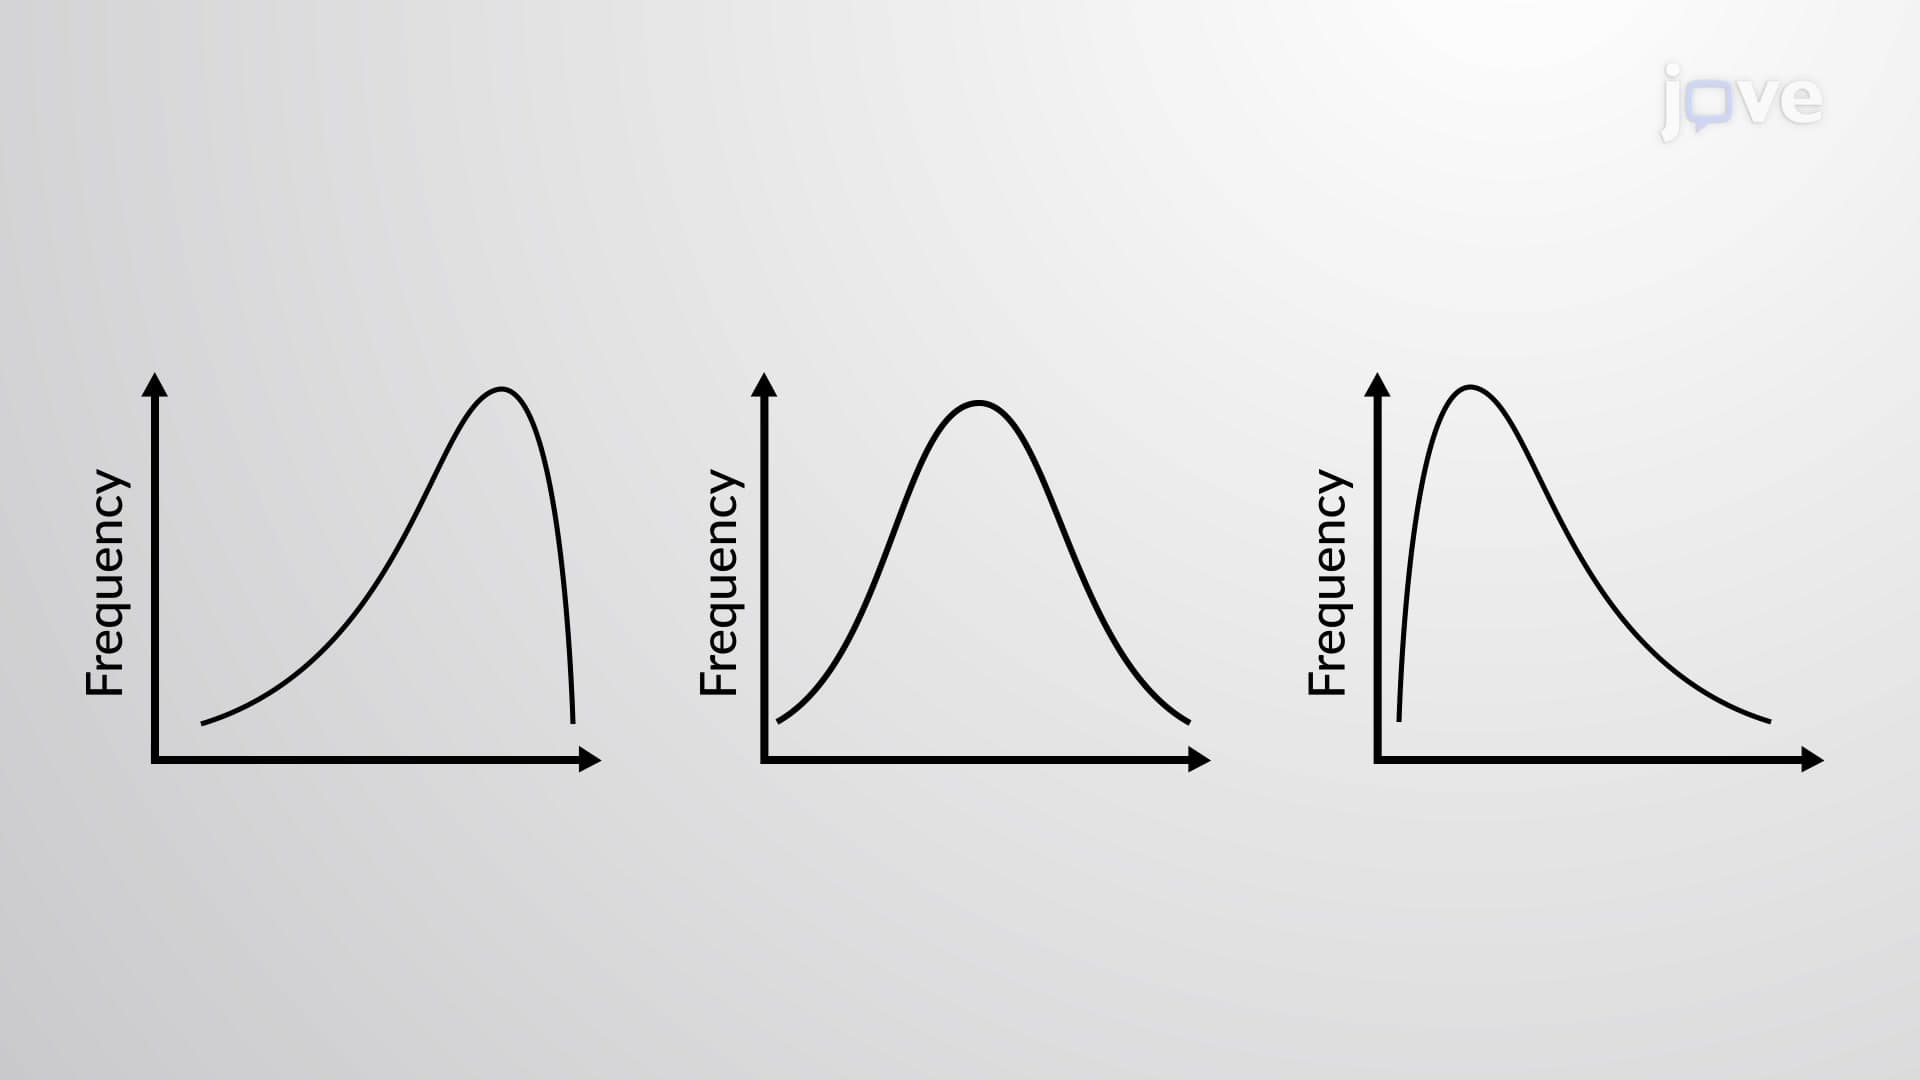
Understanding when each measure is most effective proves crucial for exam success. Symmetric distributions often use mean, skewed distributions favor median, and categorical data requires mode. This decision-making process appears in multiple-choice questions on the AP Statistics exam and college statistics courses nationwide.
Related Micro-courses