Loading subject page…
- Statistics
- Measure of Central Tendency
- Trimmed Mean
Micro-course: Measure of Central Tendency
154,401 views
Learn key concepts and earn your certificate.







Trimmed Mean

00:00
01:10
Video Summary: What Is Trimmed Mean
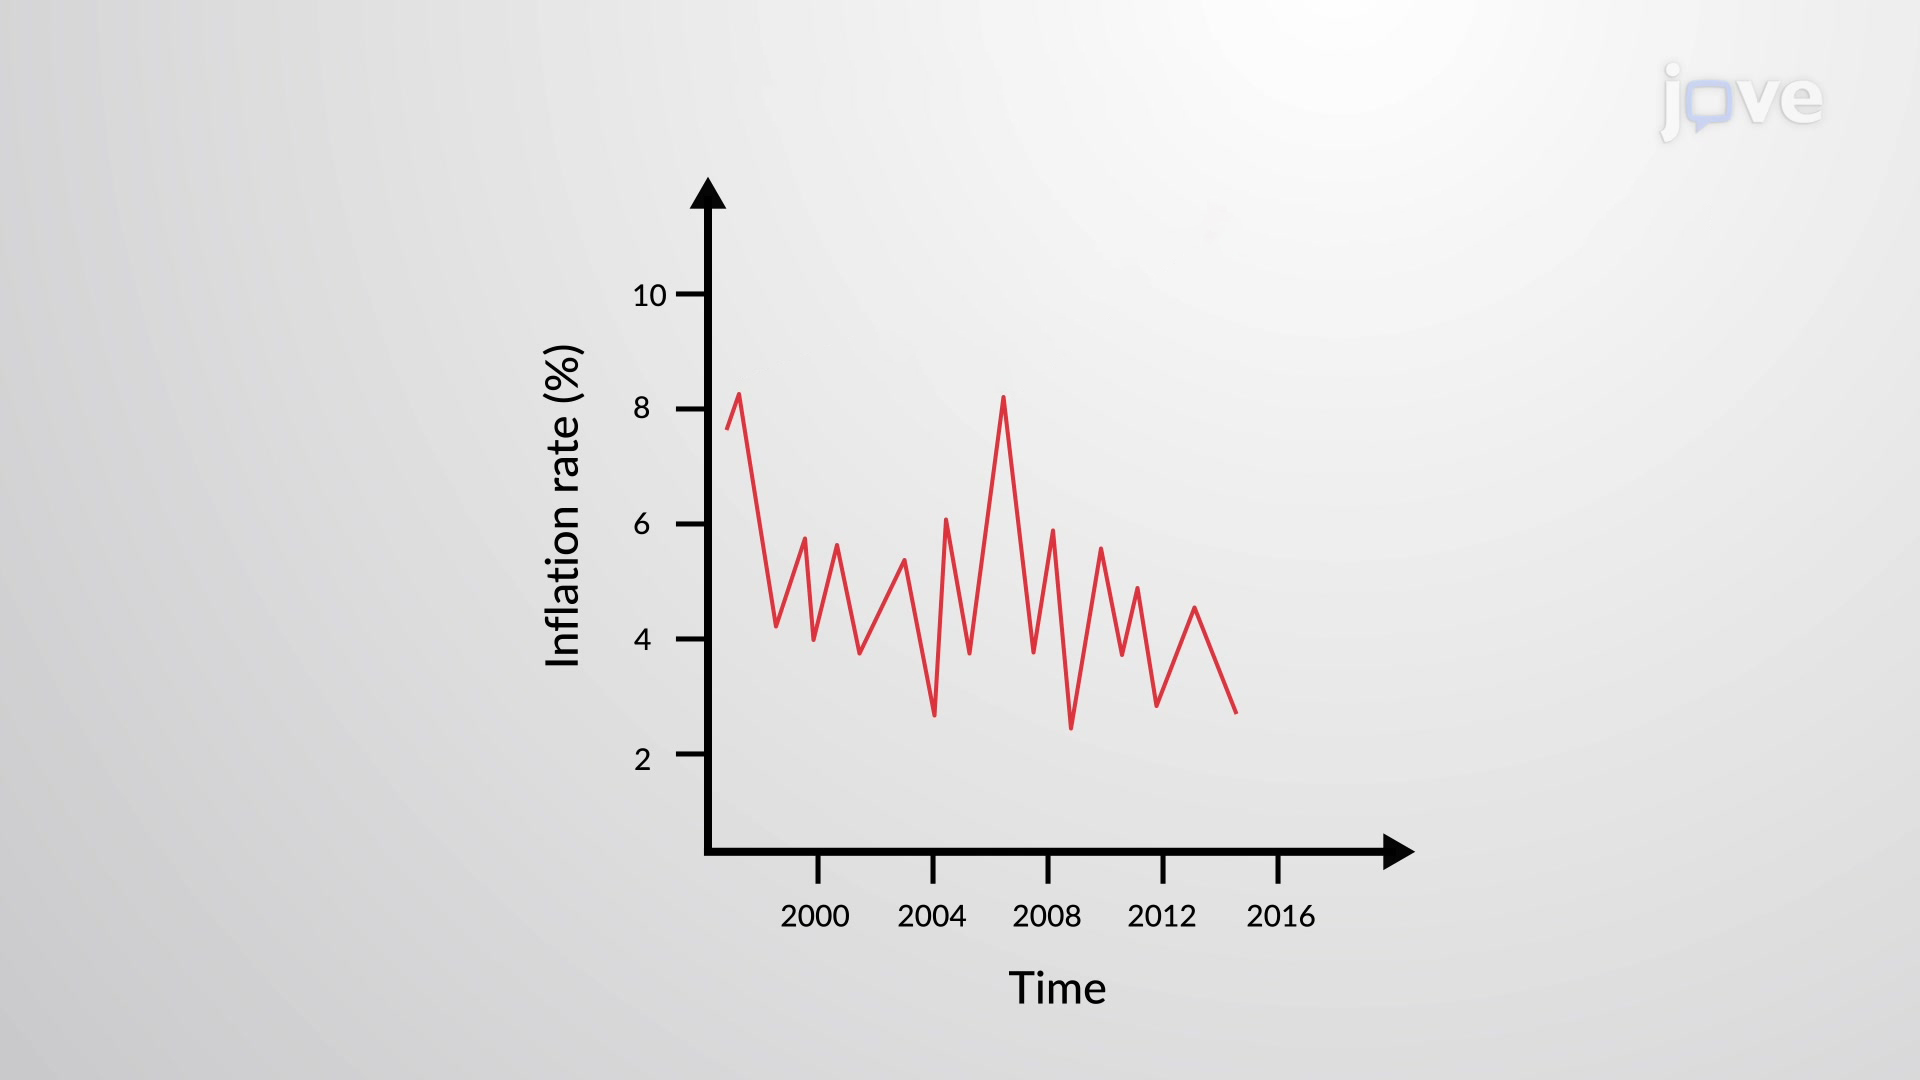
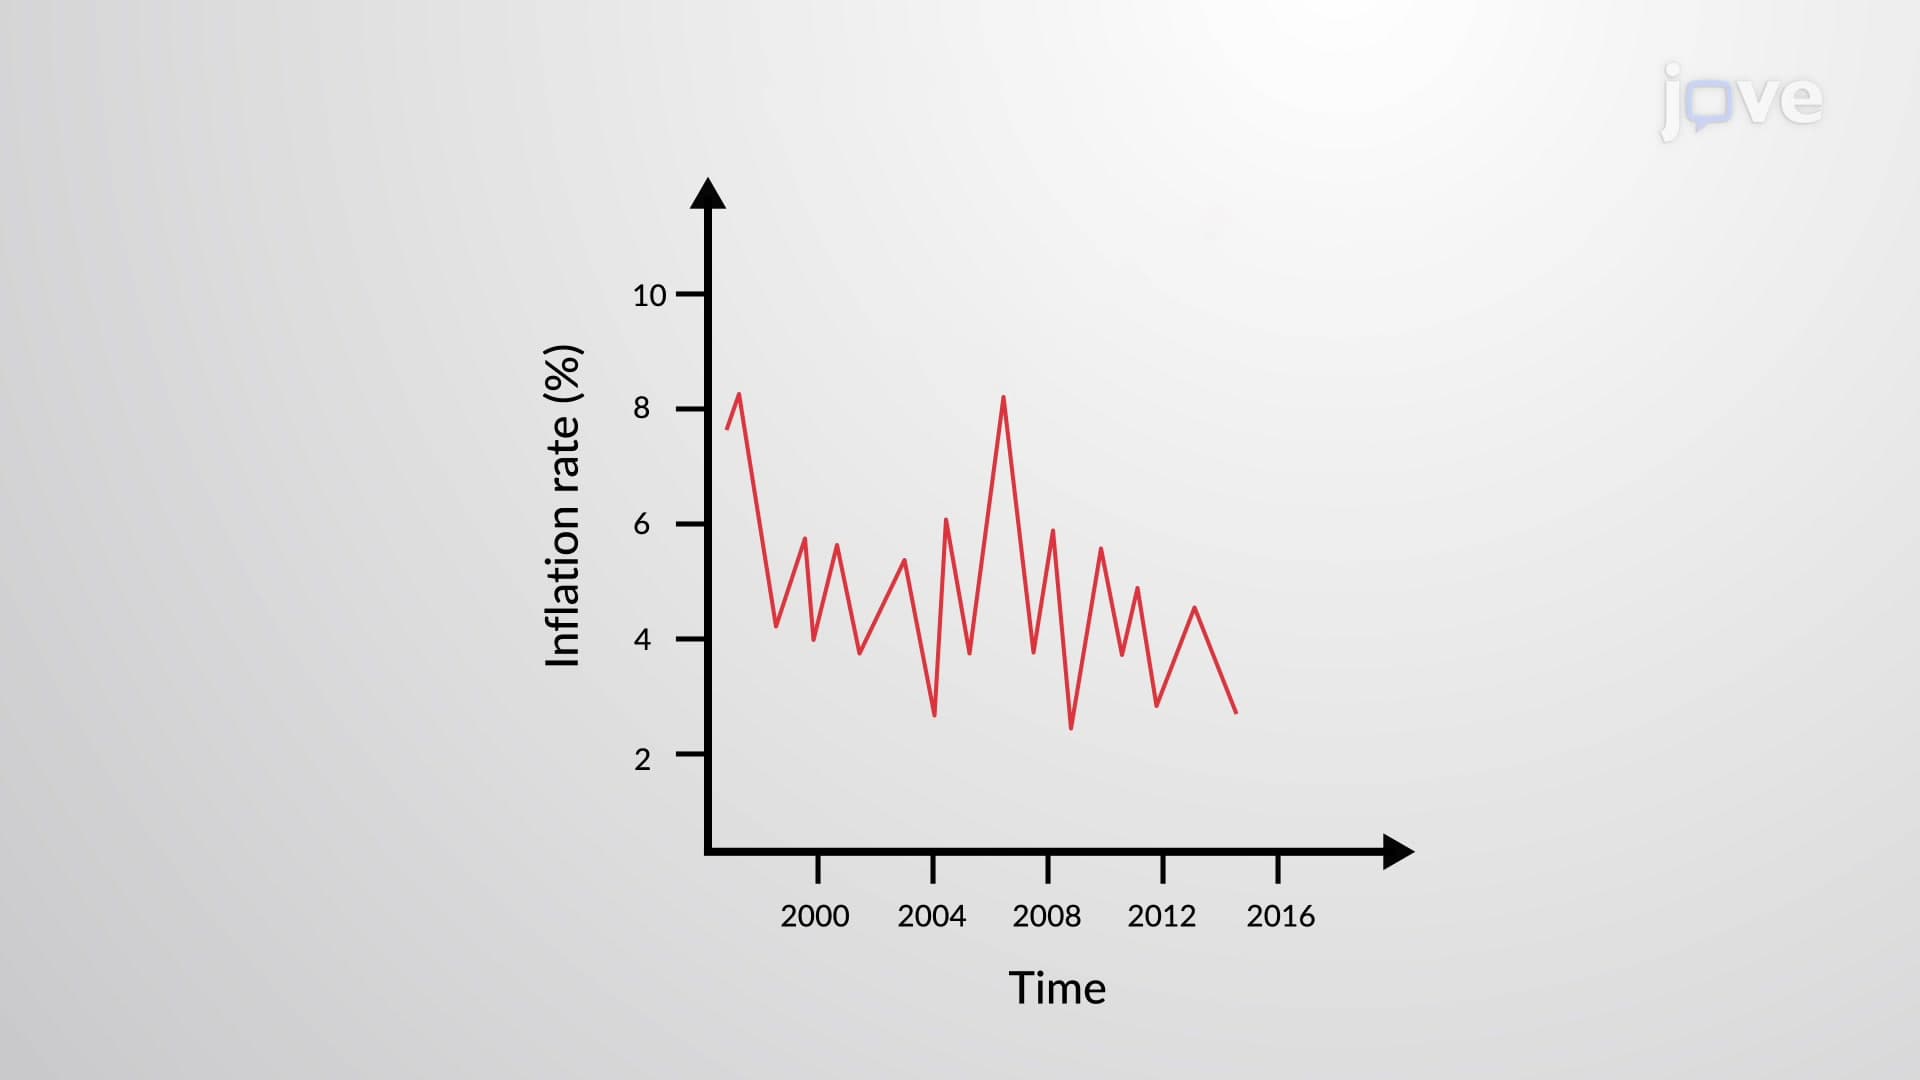
Did you know that the U.S. Bureau of Labor Statistics uses trimmed mean calculations to measure inflation more accurately? A trimmed mean removes extreme values (outliers) from a dataset before calculating the average, providing a more stable and representative measure than the regular mean. For instance, when calculating housing price trends in San Francisco, extremely high or low property values are trimmed to prevent skewing the overall average. This statistical technique is essential for creating reliable economic indicators and research data. Watch the full video on JoVE Coach to master this concept with expert-led visuals and step-by-step explanations.
- Understand what is trimmed mean and how it differs from the standard arithmetic mean
- Identify situations where outliers significantly impact data interpretation and require trimming
- Analyze the step-by-step process of ordering data and removing extreme values systematically
- Apply trimmed mean calculations to real datasets by removing specified percentages from both ends
- Recognize why economists and statisticians prefer trimmed means for measuring inflation and economic indicators
- Evaluate when to use trimmed mean versus other measures of central tendency in statistical analysis
- Compare the stability of trimmed mean results against regular mean calculations in the presence of outliers
- Explore practical applications of trimmed mean in fields like economics, psychology, and market research
Understanding What is Trimmed Mean: Core Definition and Purpose
The trimmed mean represents a robust statistical measure that addresses one of the most significant weaknesses of the arithmetic mean: sensitivity to extreme values. Unlike the standard mean, which includes every data point in its calculation, the trimmed mean systematically removes a predetermined percentage of the highest and lowest values before computing the average. This approach creates a more stable central tendency measure that better represents the typical values in a dataset.
The Mathematical Process Behind Trimmed Mean Calculations
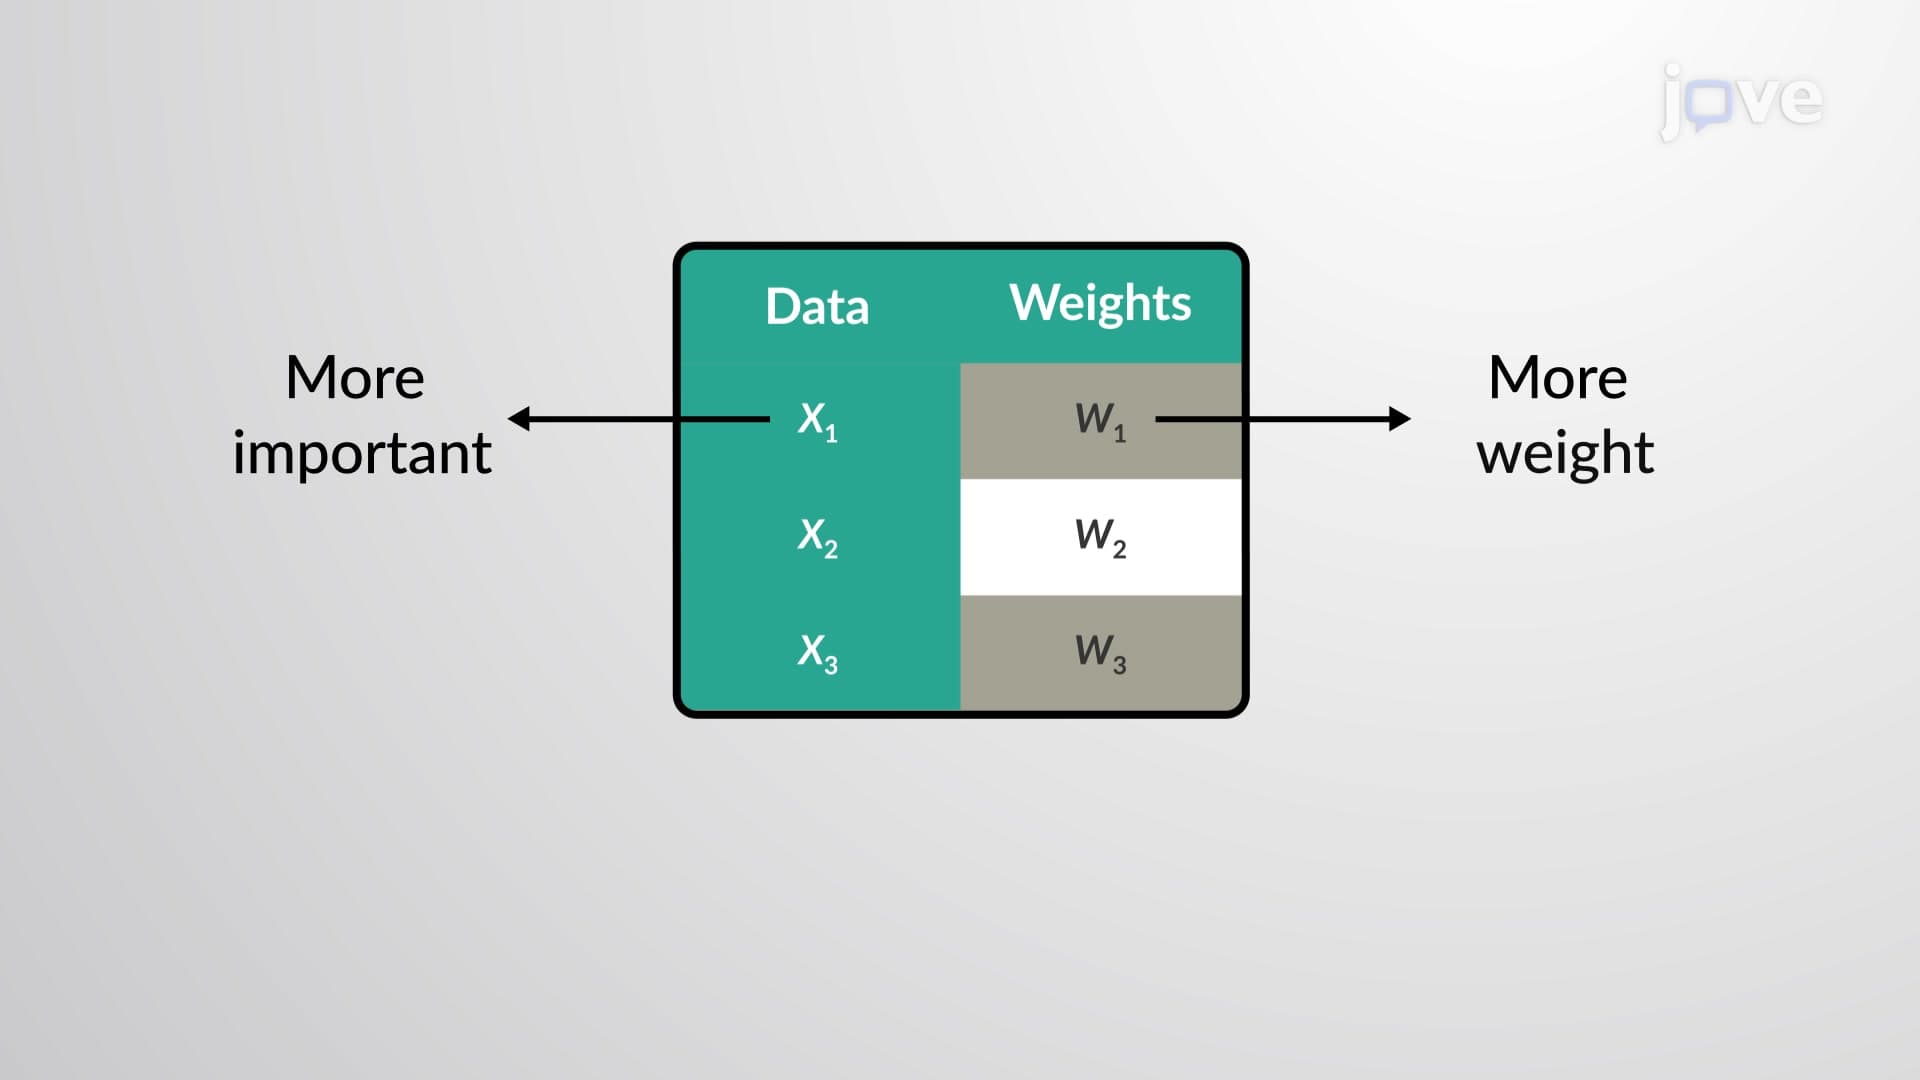
Calculating a trimmed mean follows a systematic four-step process. First, arrange all data values in ascending order from smallest to largest. Second, determine the trimming percentage (commonly 5%, 10%, or 20% from each end). Third, remove the specified percentage of values from both the minimum and maximum ends of the ordered dataset. Finally, calculate the arithmetic mean of the remaining values using the standard formula: sum of remaining values divided by the count of remaining values.
For example, with a 10% trimmed mean of 20 test scores, you would remove the 2 lowest and 2 highest scores (10% of 20 = 2 from each end), then calculate the mean of the remaining 16 scores. This process is particularly valuable in educational settings where AP Statistics students encounter datasets with significant outliers.
Real-World Applications in Economics and Beyond
The trimmed mean plays a crucial role in U.S. economic policy and business decision-making. The Federal Reserve Bank of Cleveland publishes a monthly "16% Trimmed-Mean CPI" that removes the most volatile price changes in consumer goods, providing policymakers with a clearer picture of underlying inflation trends. This measure proved especially valuable during the 2008 financial crisis and recent supply chain disruptions when certain commodity prices experienced extreme volatility.
Healthcare research frequently employs trimmed means when analyzing clinical trial data, particularly in pharmaceutical studies where a few patients may show unusually strong or weak responses to treatment. Market research firms use trimmed means when analyzing consumer spending data, ensuring that extremely wealthy or budget-conscious respondents don't skew insights about typical consumer behavior.
Strategic Advantages for Academic and Professional Success
Students preparing for standardized tests like the AP Statistics exam should understand that trimmed mean questions often appear in the context of data analysis and interpretation. The College Board frequently includes scenarios where students must recognize when outliers compromise data integrity and recommend appropriate statistical measures. Understanding trimmed mean concepts also proves valuable for college statistics courses and professional fields requiring data analysis skills, from business analytics to social science research.
Frequently Asked Questions
A trimmed mean removes a specified percentage of extreme values from both ends of an ordered dataset before calculating the average. It works by sorting data, eliminating outliers (like the top and bottom 10%), then computing the mean of remaining values, resulting in a more stable measure less affected by unusual data points.
In detail, trimmed mean is a statistical tool that creates more reliable averages by excluding extreme values that might distort results. You arrange data in order, remove equal percentages from both ends (commonly 5-20%), then average what remains. This technique helps analysts focus on typical values rather than unusual cases that could mislead conclusions.
AP Statistics exams typically test trimmed mean through data interpretation scenarios where students identify when outliers affect conclusions. Questions often ask students to calculate trimmed means, compare them with regular means, or explain why trimmed mean provides better insights for specific datasets like income distributions or test scores.
Absolutely. College statistics courses extensively cover robust statistical measures, and trimmed mean represents a fundamental concept in exploratory data analysis. Understanding this concept prepares students for advanced topics like winsorized means, bootstrap methods, and regression diagnostics commonly encountered in business, psychology, and economics courses.
The Federal Reserve uses trimmed mean inflation measures to guide monetary policy decisions, removing volatile energy and food prices to reveal underlying trends. Financial analysts apply trimmed means when evaluating stock returns, removing extreme market events to assess typical performance patterns for investment decisions.
No advanced math is required. Trimmed mean uses only basic arithmetic: sorting numbers, counting percentages, and calculating averages. If you can arrange numbers in order and compute simple averages, you can master trimmed mean calculations. The concept focuses more on statistical thinking than complex mathematical operations.
Practice with real datasets from sources like the Bureau of Labor Statistics or Census data to see how trimmed means change interpretations. Create your own examples using familiar scenarios like class test scores or sports statistics. Focus on explaining why you'd choose trimmed mean over regular mean rather than just memorizing calculation steps.
Explore other robust statistics like median, interquartile range, and winsorized means. Study outlier detection methods and learn about different measures of central tendency. Understanding box plots and five-number summaries will deepen your grasp of how trimmed means fit into comprehensive data analysis strategies.
Related Micro-courses
11 Concepts

9 Concepts

14 Concepts