Loading subject page…

- Statistics
- Hypothesis Testing
- Critical Region, Critical Values and Significance Level
Micro-course: Hypothesis Testing
130,604 views
Learn key concepts and earn your certificate.








Critical Region, Critical Values and Significance Level


00:00
01:16
Video Summary: How to Determine Critical Regions Critical Values and Significance Level
Did you know that pharmaceutical companies rely on statistical decision-making to determine if a new drug is truly effective? Understanding critical region, critical values, and significance level forms the backbone of hypothesis testing in statistics. When the FDA evaluates clinical trial data for medications, researchers must determine precise boundaries that separate statistically significant results from random chance. These fundamental concepts in how to determine critical regions, critical values, and significance level enable scientists, medical professionals, and researchers to make data-driven decisions with measurable confidence. Watch the full video on JoVE Coach to master this concept with expert-led visuals and step-by-step explanations.
- Understand how to determine critical regions, critical values, and significance level as essential components of hypothesis testing
- Identify the critical region as the area under a distribution curve where null hypothesis rejection occurs
- Analyze critical values as the boundary points that separate acceptance and rejection regions in statistical tests
- Apply significance level concepts to calculate the probability of Type I error in hypothesis testing
- Evaluate test statistics using z-scores, t-values, and chi-square distributions for different sample conditions
- Compare one-tailed versus two-tailed tests and their corresponding critical regions
- Recognize real-world applications in medical research, quality control, and scientific studies
- Explore the relationship between confidence intervals and critical values in statistical inference
Understanding Critical Regions, Critical Values, and Significance Level
The foundation of statistical hypothesis testing rests on three interconnected concepts that work together to help researchers make evidence-based decisions. When you conduct any statistical test-whether analyzing SAT score improvements, evaluating medication effectiveness, or studying environmental data-you need clear criteria for determining when your results are statistically meaningful versus due to random chance.
The Critical Region: Where Rejection Happens
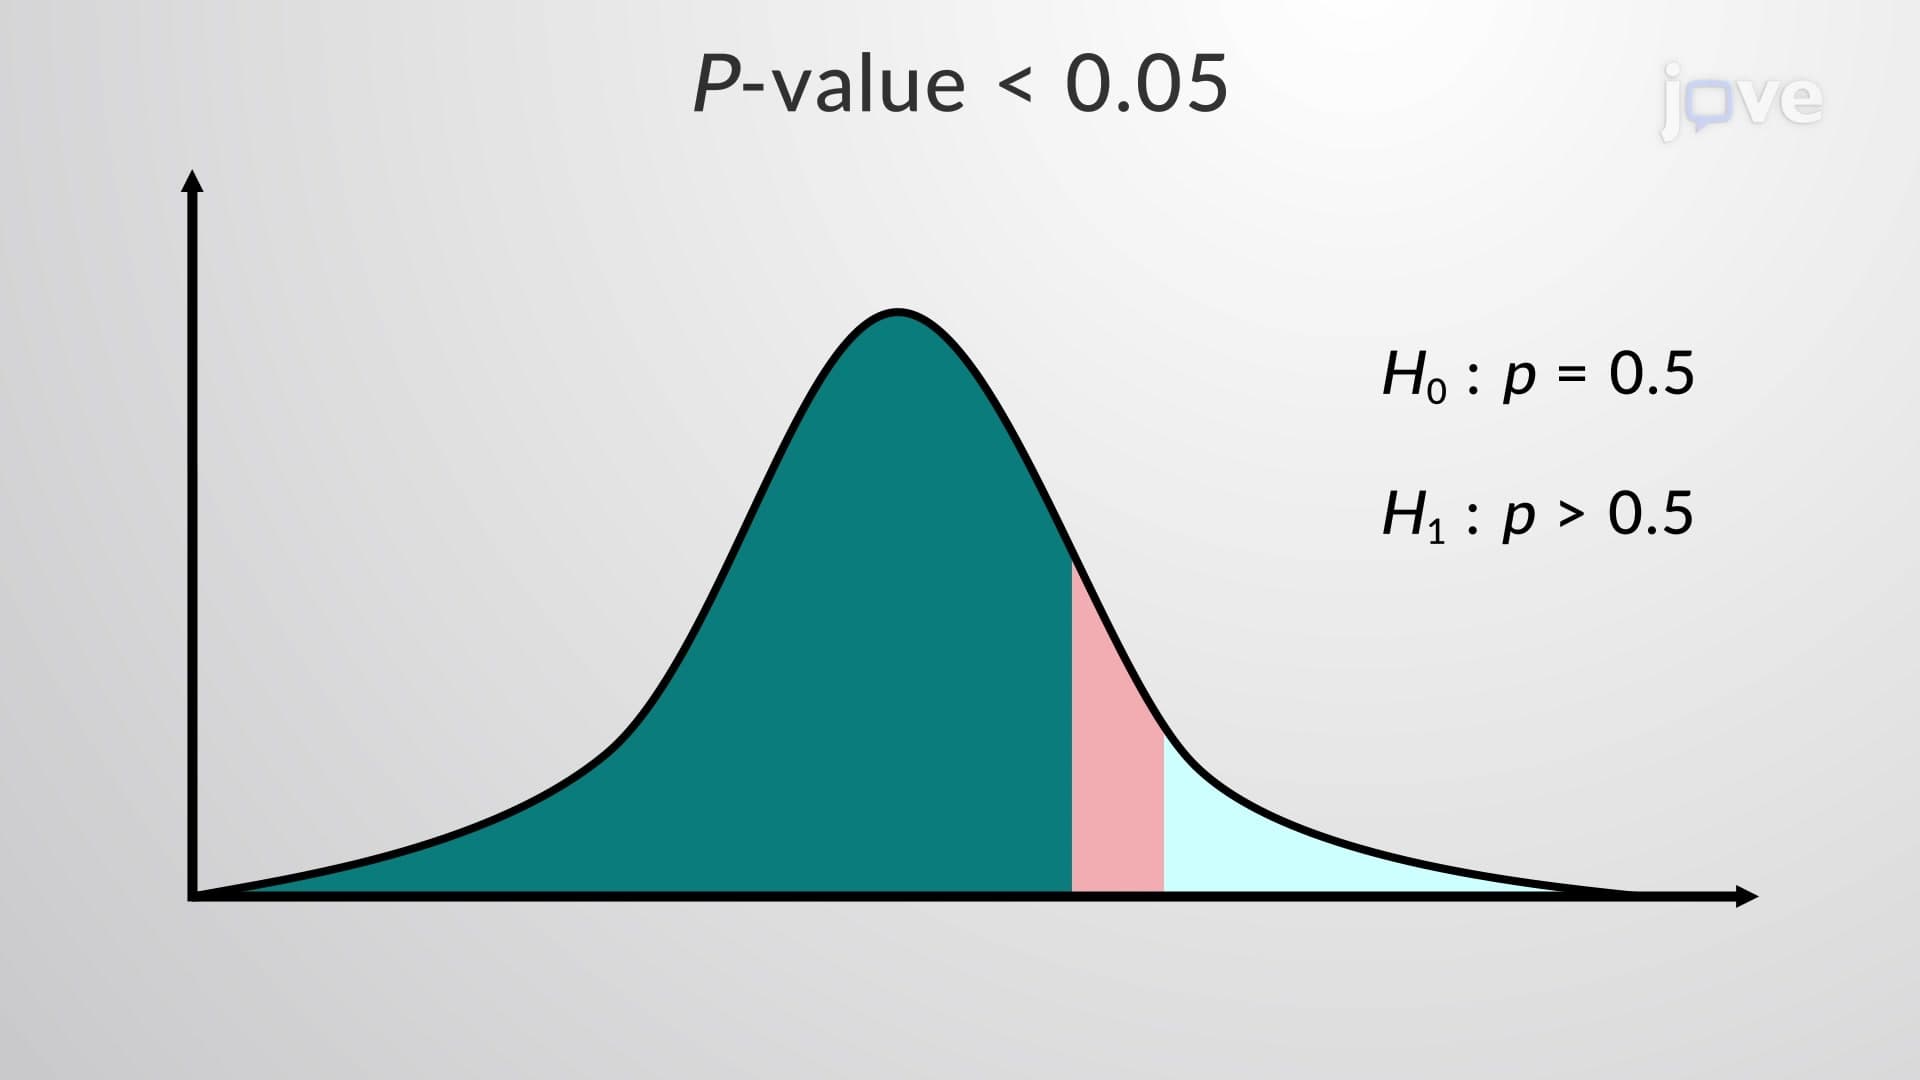
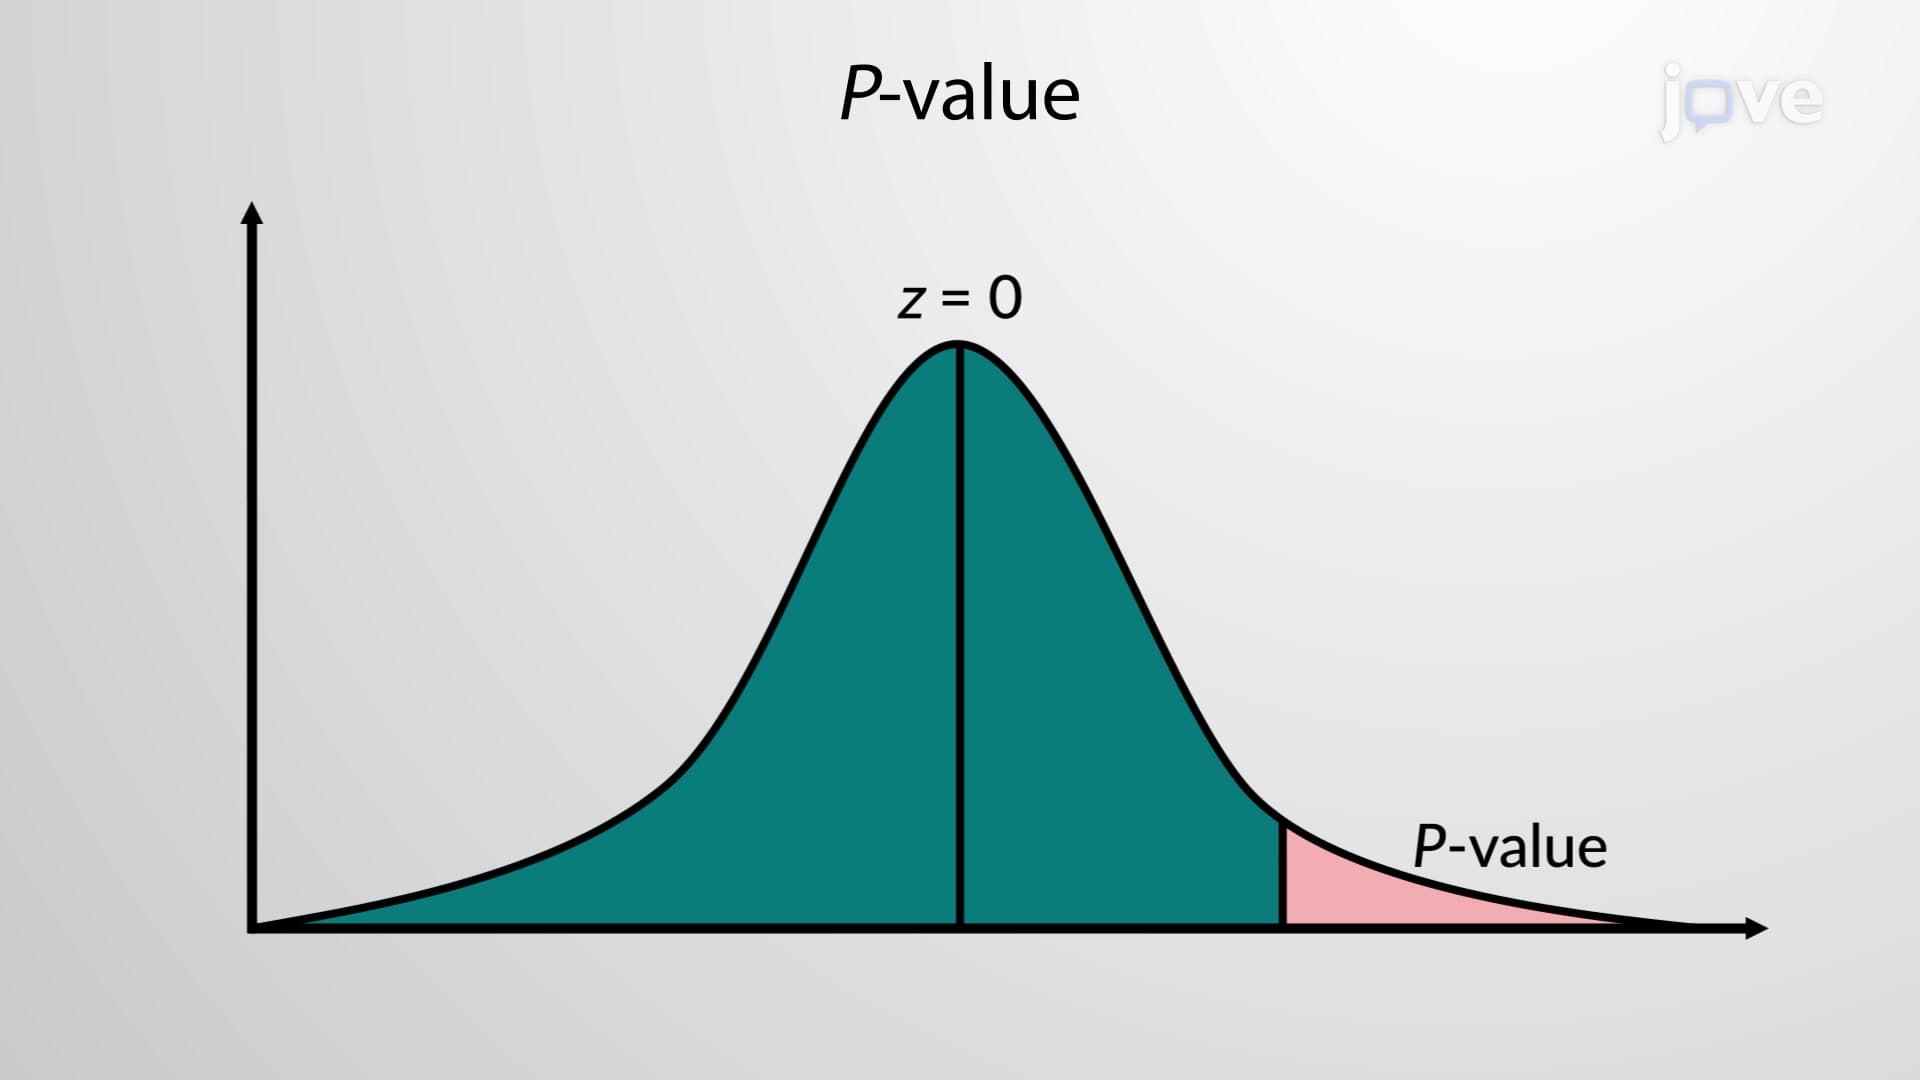
The critical region represents the "danger zone" of your statistical test-the area under the probability distribution where your test statistic values would be so extreme that you must reject the null hypothesis. Think of it as the threshold beyond which your sample data becomes too unlikely to have occurred by chance alone.
For example, when the CDC analyzes vaccination effectiveness rates, they establish critical regions based on expected population parameters. If sample data falls within this critical region, researchers conclude that the observed effects are statistically significant rather than random variation. The size and location of this region depend on whether you're conducting a one-tailed or two-tailed test, which directly impacts your conclusions.
Critical Values: The Boundary Lines
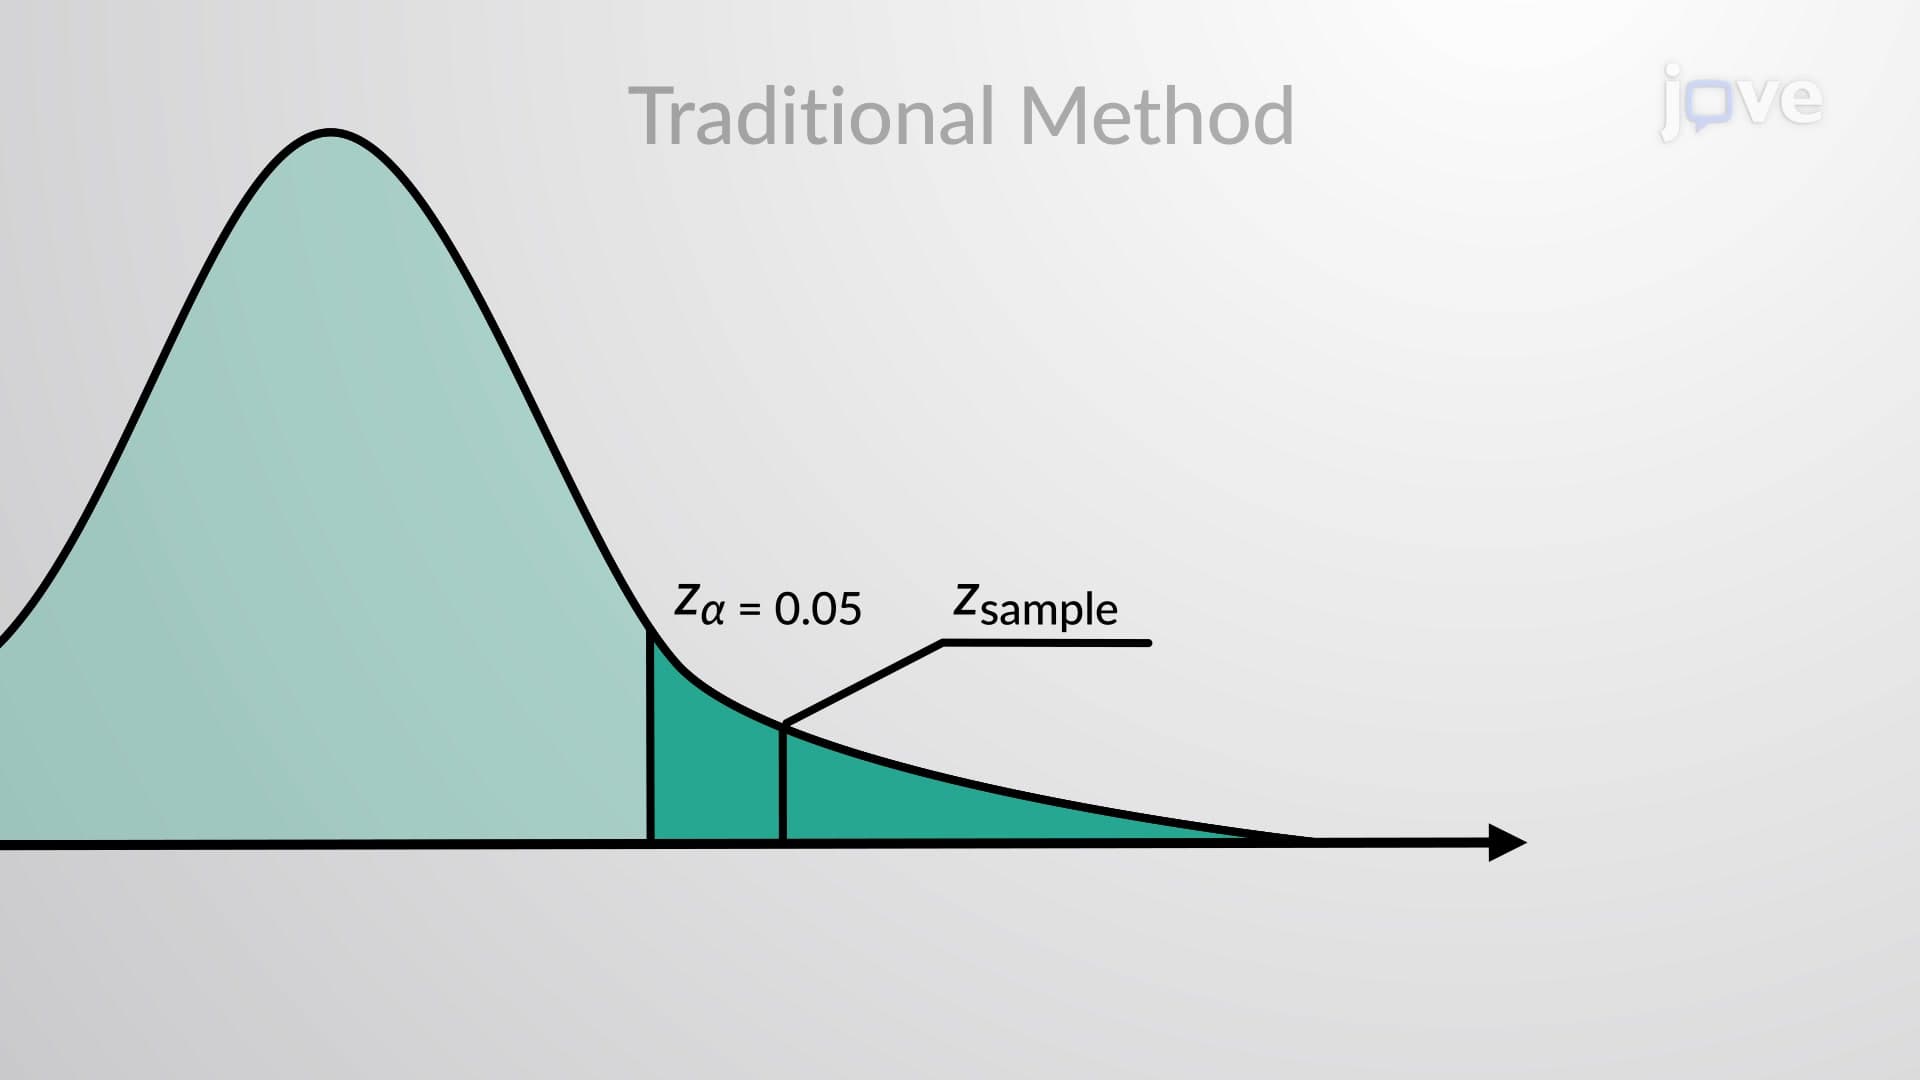
Critical values serve as the precise boundary markers that separate your critical region from the acceptance region. These are specific z-scores, t-values, or chi-square values calculated based on your chosen confidence level and degrees of freedom. When preparing for AP Statistics or college-level courses, you'll frequently reference critical value tables to determine these boundaries.
Consider a pharmaceutical company testing whether a new blood pressure medication reduces systolic pressure by more than 10 mmHg. The critical value might be z = 1.645 for a one-tailed test at α = 0.05, meaning any test statistic exceeding this value would lead to rejecting the null hypothesis of no significant reduction.
Significance Level: Controlling Your Error Risk
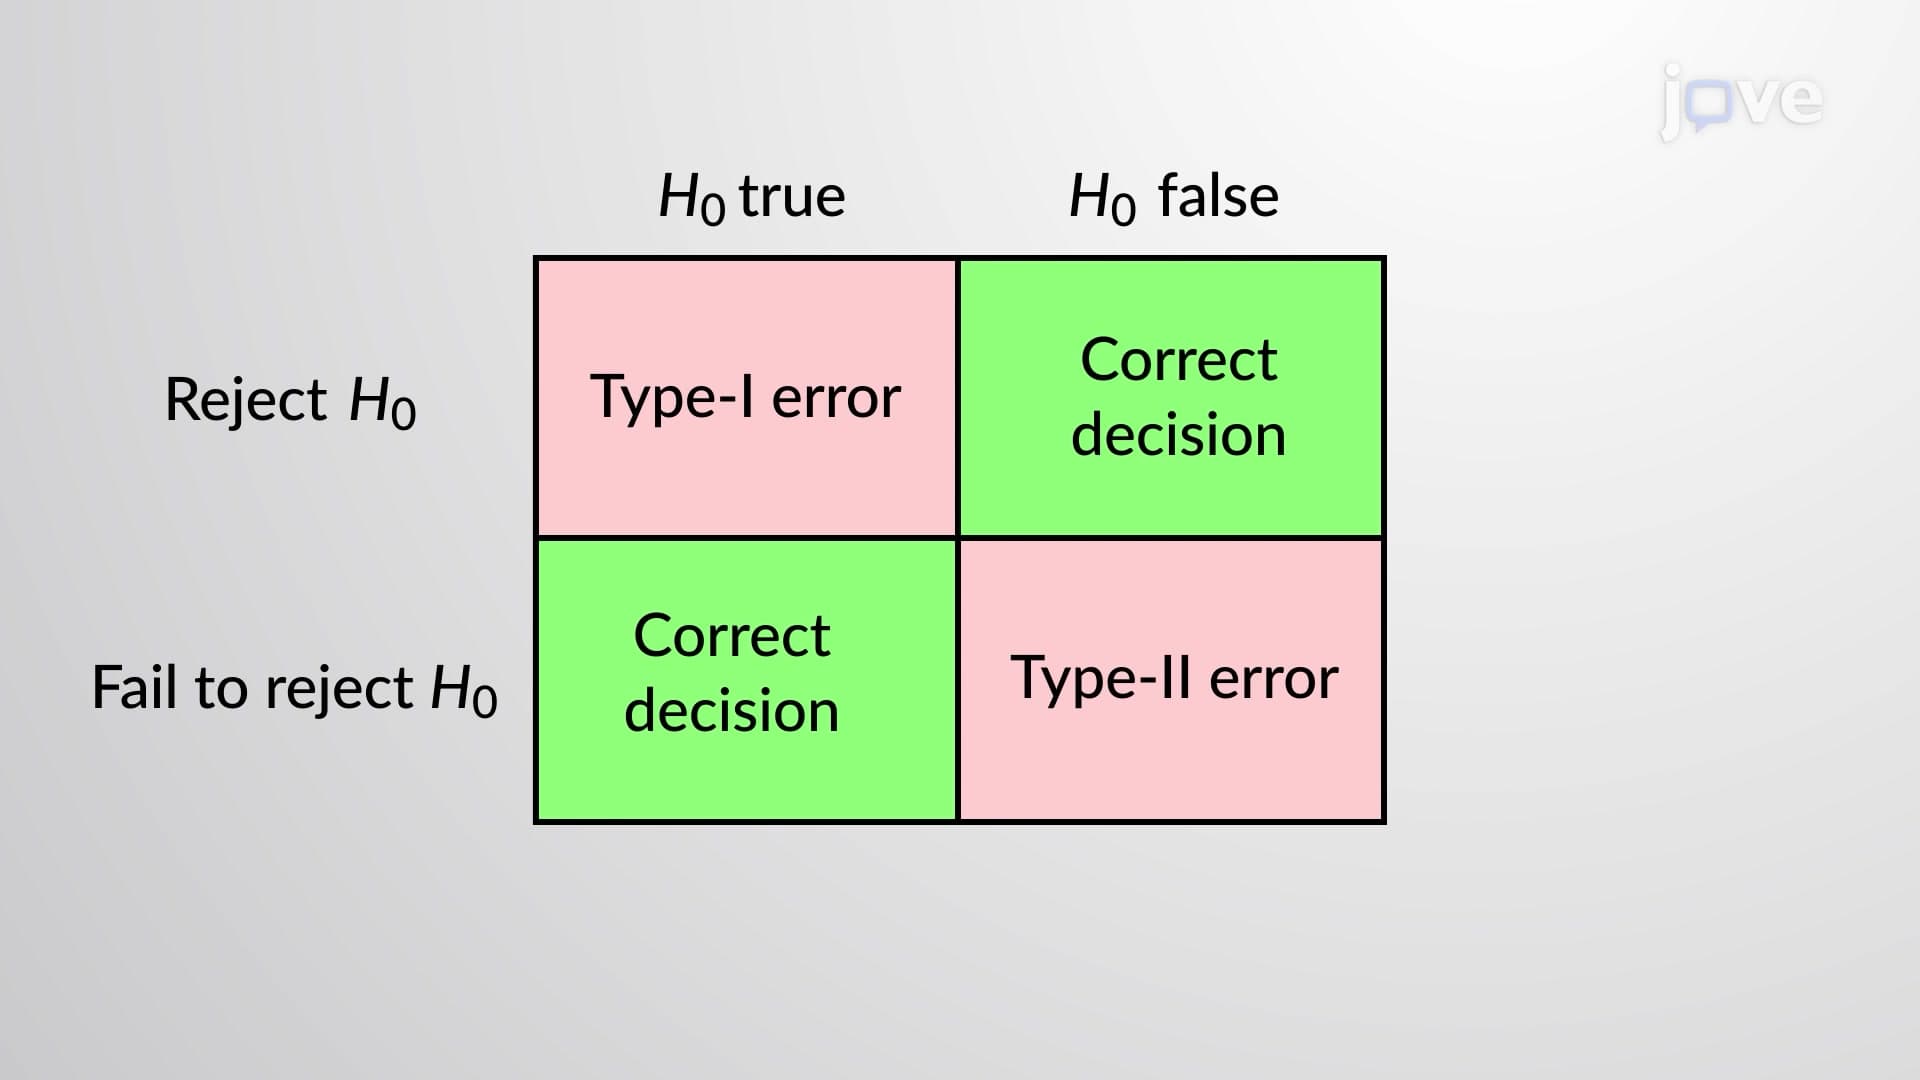
The significance level (α) represents your tolerance for making a Type I error-rejecting a true null hypothesis. Most academic and professional research uses α = 0.05, meaning you're willing to accept a 5% chance of incorrectly concluding there's an effect when none actually exists. This choice directly determines the size of your critical region and the stringency of your statistical test.
In medical device testing regulated by the FDA, researchers might choose α = 0.01 for greater stringency, ensuring only the most convincing evidence leads to approval. This conservative approach protects public safety while maintaining scientific rigor in regulatory decisions.
Frequently Asked Questions
Critical regions, critical values, and significance level work together as the decision-making framework in hypothesis testing. The significance level determines how large your critical region will be, while critical values mark the exact boundaries of this region, creating a systematic approach for statistical conclusions.
AP Statistics frequently tests these concepts through z-test and t-test problems where you must identify critical values from tables, sketch critical regions on distribution curves, and interpret significance levels. You'll often encounter questions asking you to determine whether calculated test statistics fall within critical regions for given alpha levels.
The MCAT focuses on conceptual understanding and interpretation of critical values in research contexts, while college biostatistics courses require you to calculate specific critical values using statistical tables and software. Both emphasize real-world applications in medical research and clinical studies.
Hospitals apply critical regions when comparing treatment effectiveness, infection rates, or patient satisfaction scores. For example, when evaluating whether a new surgical technique reduces recovery time, medical researchers establish critical regions to determine if observed improvements are statistically significant or due to random variation.
No advanced calculus is required to master these concepts effectively. Understanding basic probability distributions, reading statistical tables, and interpreting graphs provides sufficient foundation for applying critical regions and critical values in most academic and professional contexts.
Practice identifying critical values from z-tables and t-tables, sketching critical regions for different alpha levels, and interpreting the meaning of significance levels in research scenarios. Focus on connecting these concepts to real-world examples from medicine, psychology, and business research.
Two-tailed tests split the significance level between both tails of the distribution, requiring more extreme test statistics for rejection, while one-tailed tests concentrate the entire alpha level in one tail. This affects both the critical values and the power of your statistical test.
Progress to confidence intervals, effect size calculations, and power analysis to deepen your statistical inference skills. These advanced topics build directly on critical value concepts and enhance your ability to design and interpret research studies effectively.
Related Micro-courses

7 Concepts
10 Concepts

10 Concepts