Loading video…

 13 Concepts
 130.6K views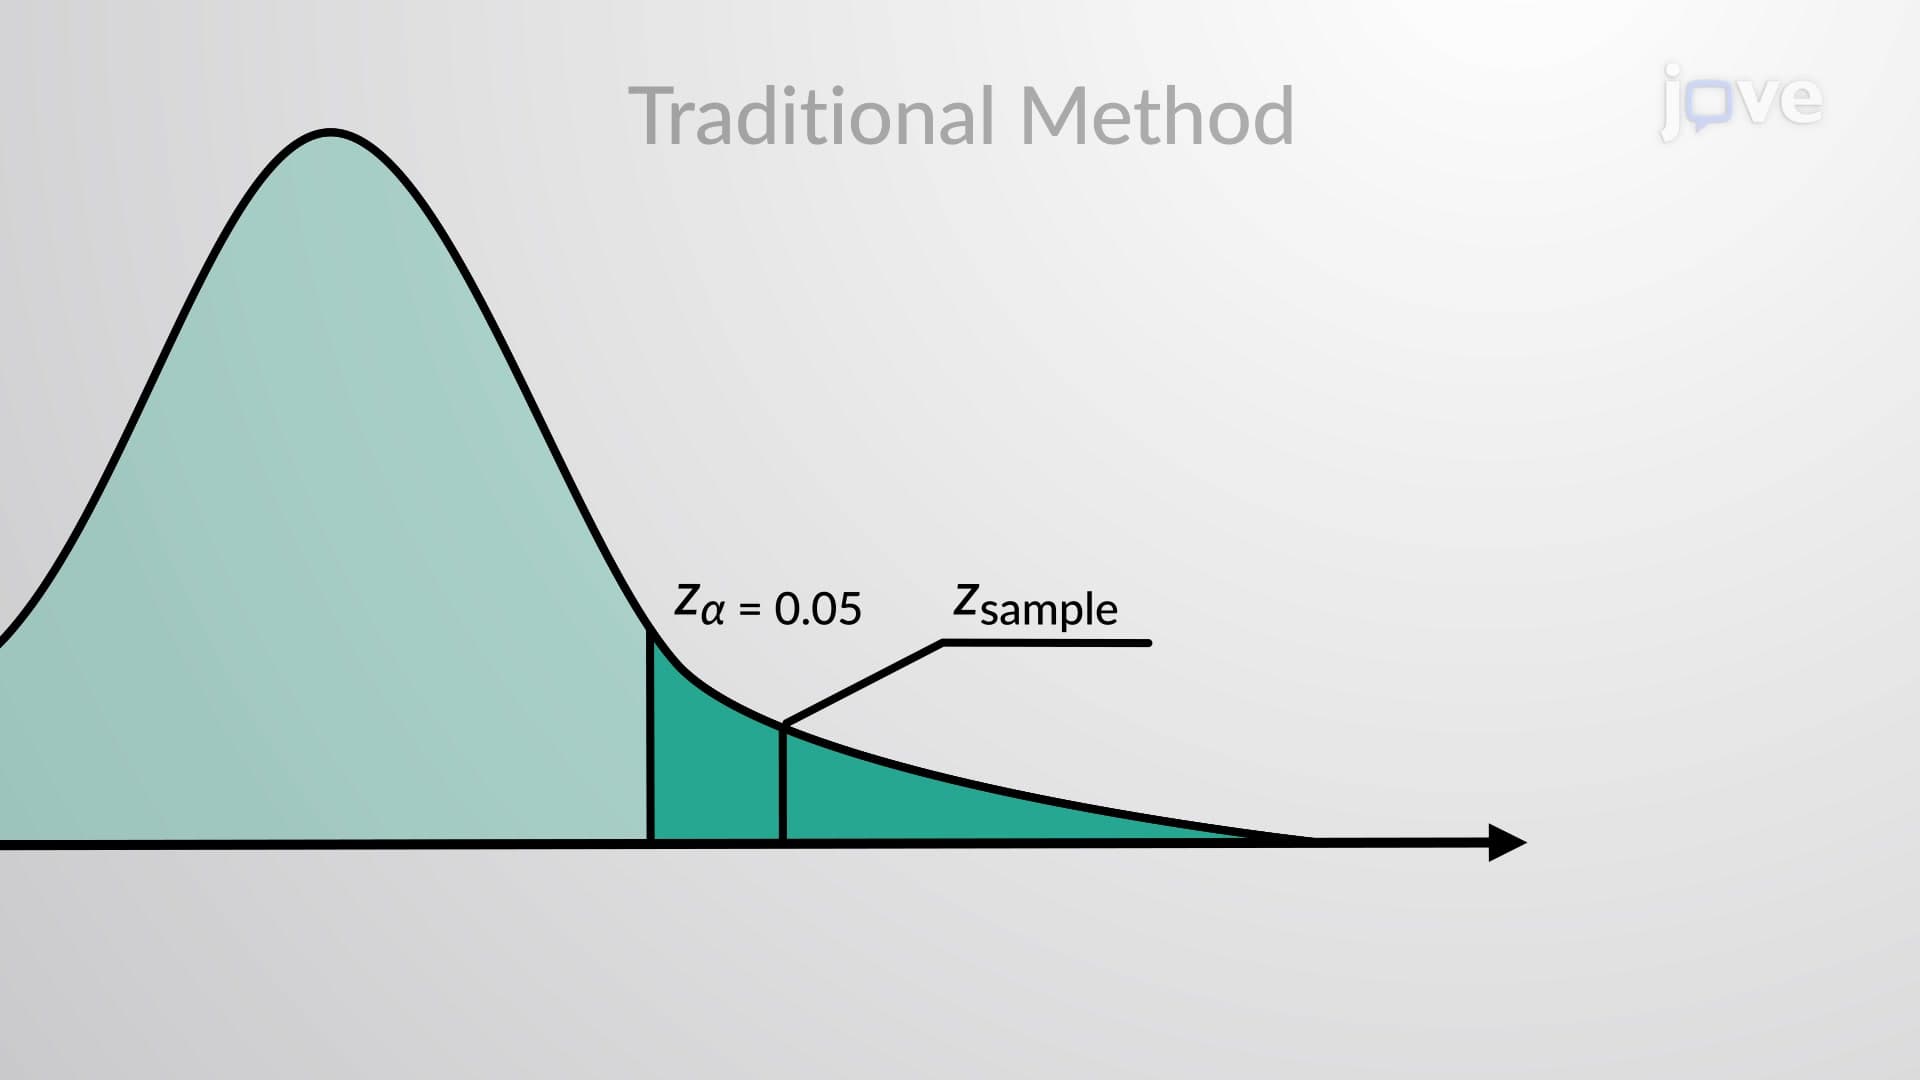

Video Summary: What Is Decision Making Traditional Method
When the FDA evaluates whether a new medication is safe for public use, they don't just guess-they follow a rigorous decision making traditional method that relies on critical values and statistical evidence. This classical approach to hypothesis testing forms the backbone of scientific decision-making across industries, from pharmaceutical trials at companies like Pfizer to quality control at manufacturing giants like General Electric. The decision making traditional method uses predetermined critical values to create clear boundaries for accepting or rejecting research hypotheses. Watch the full video on JoVE Coach to master this concept with expert-led visuals and step-by-step explanations.
The decision making traditional method represents a cornerstone of statistical inference that has guided scientific research for over a century. This classical approach provides a systematic framework for making objective decisions about population parameters based on sample data. Unlike subjective decision-making processes, this method establishes clear, mathematically-defined boundaries that eliminate personal bias from statistical conclusions.
At its core, the traditional method operates through a structured sequence: formulating hypotheses, determining critical values, calculating test statistics, and making decisions based on predetermined criteria. This methodical approach ensures reproducibility and consistency across different researchers and institutions.
The process begins with establishing two competing hypotheses about a population parameter. The null hypothesis (H₀) typically represents the status quo or a claim of no effect, while the alternative hypothesis (H₁ or Hₐ) represents what researchers seek to prove. For instance, when testing a new SAT prep program, the null hypothesis might state that the program produces no improvement in average scores (μ = 1050), while the alternative suggests scores increase (μ > 1050).
This hypothesis structure creates a legal-system-like approach where the null hypothesis is presumed true until evidence proves otherwise. This presumption of innocence protects against false discoveries and maintains scientific rigor-a principle that appears frequently on AP Statistics exams and college-level research methods courses.
Critical values serve as the mathematical gatekeepers of the decision making traditional method. These values, derived from probability distributions, create regions that determine whether observed data is sufficiently unusual to warrant rejecting the null hypothesis. The choice of distribution depends on the parameter being tested and sample characteristics:
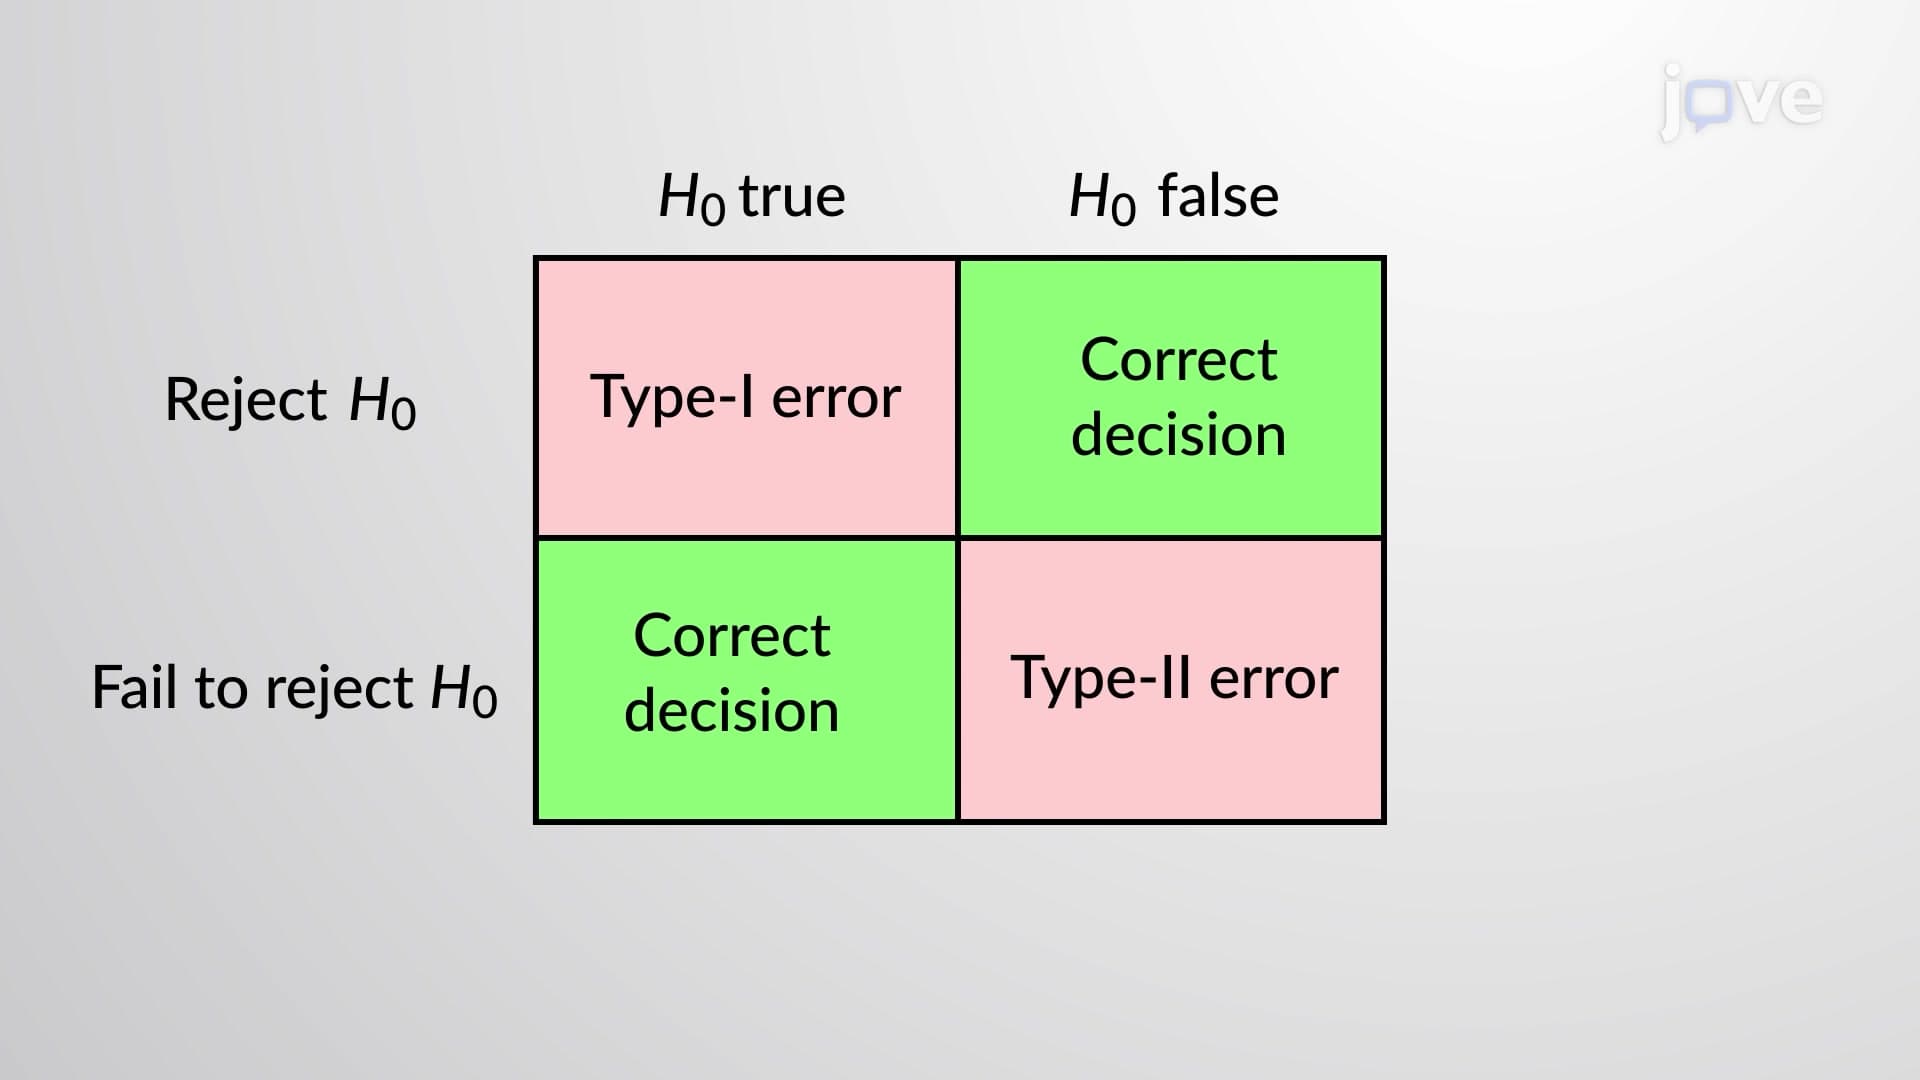
The significance level (α), typically set at 0.05 in most academic and industry applications, determines how extreme the evidence must be. This 5% threshold means researchers accept a 5% chance of incorrectly rejecting a true null hypothesis-a concept that frequently appears on MCAT and college statistics exams.
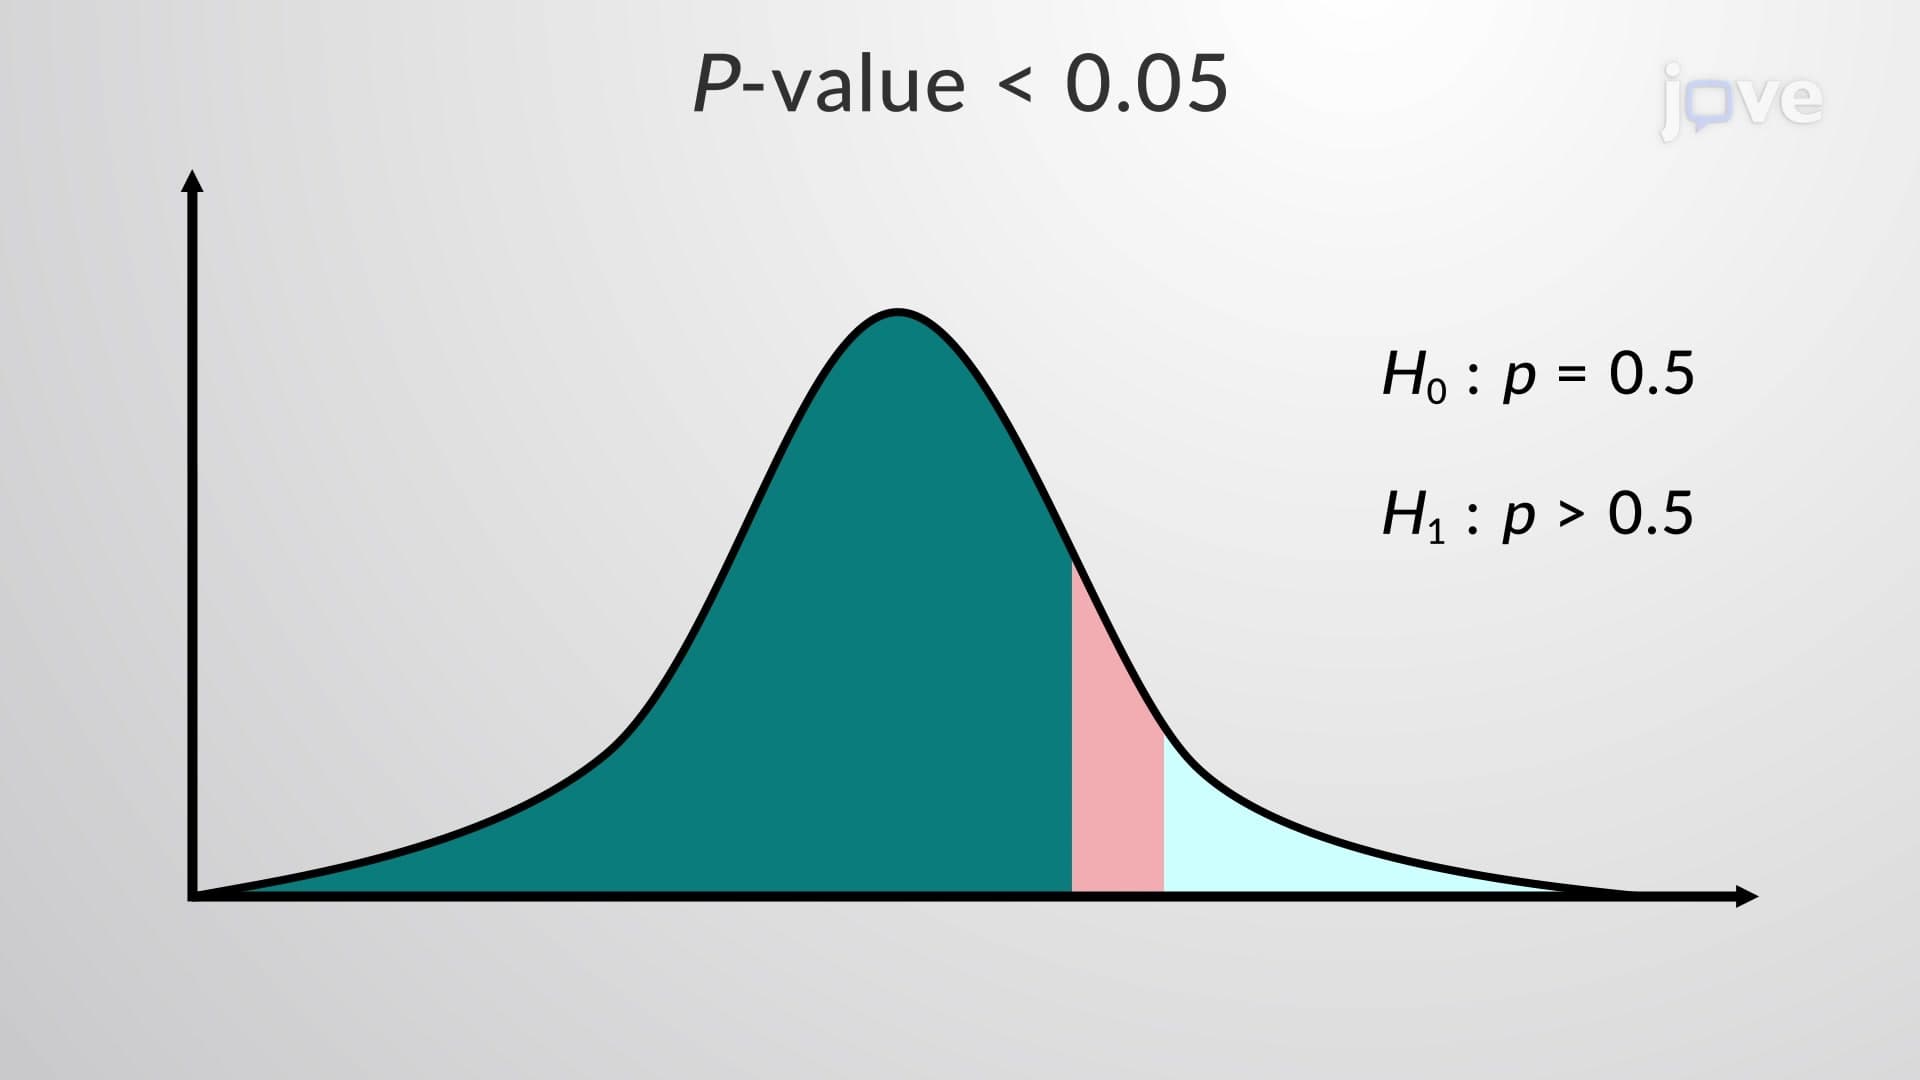
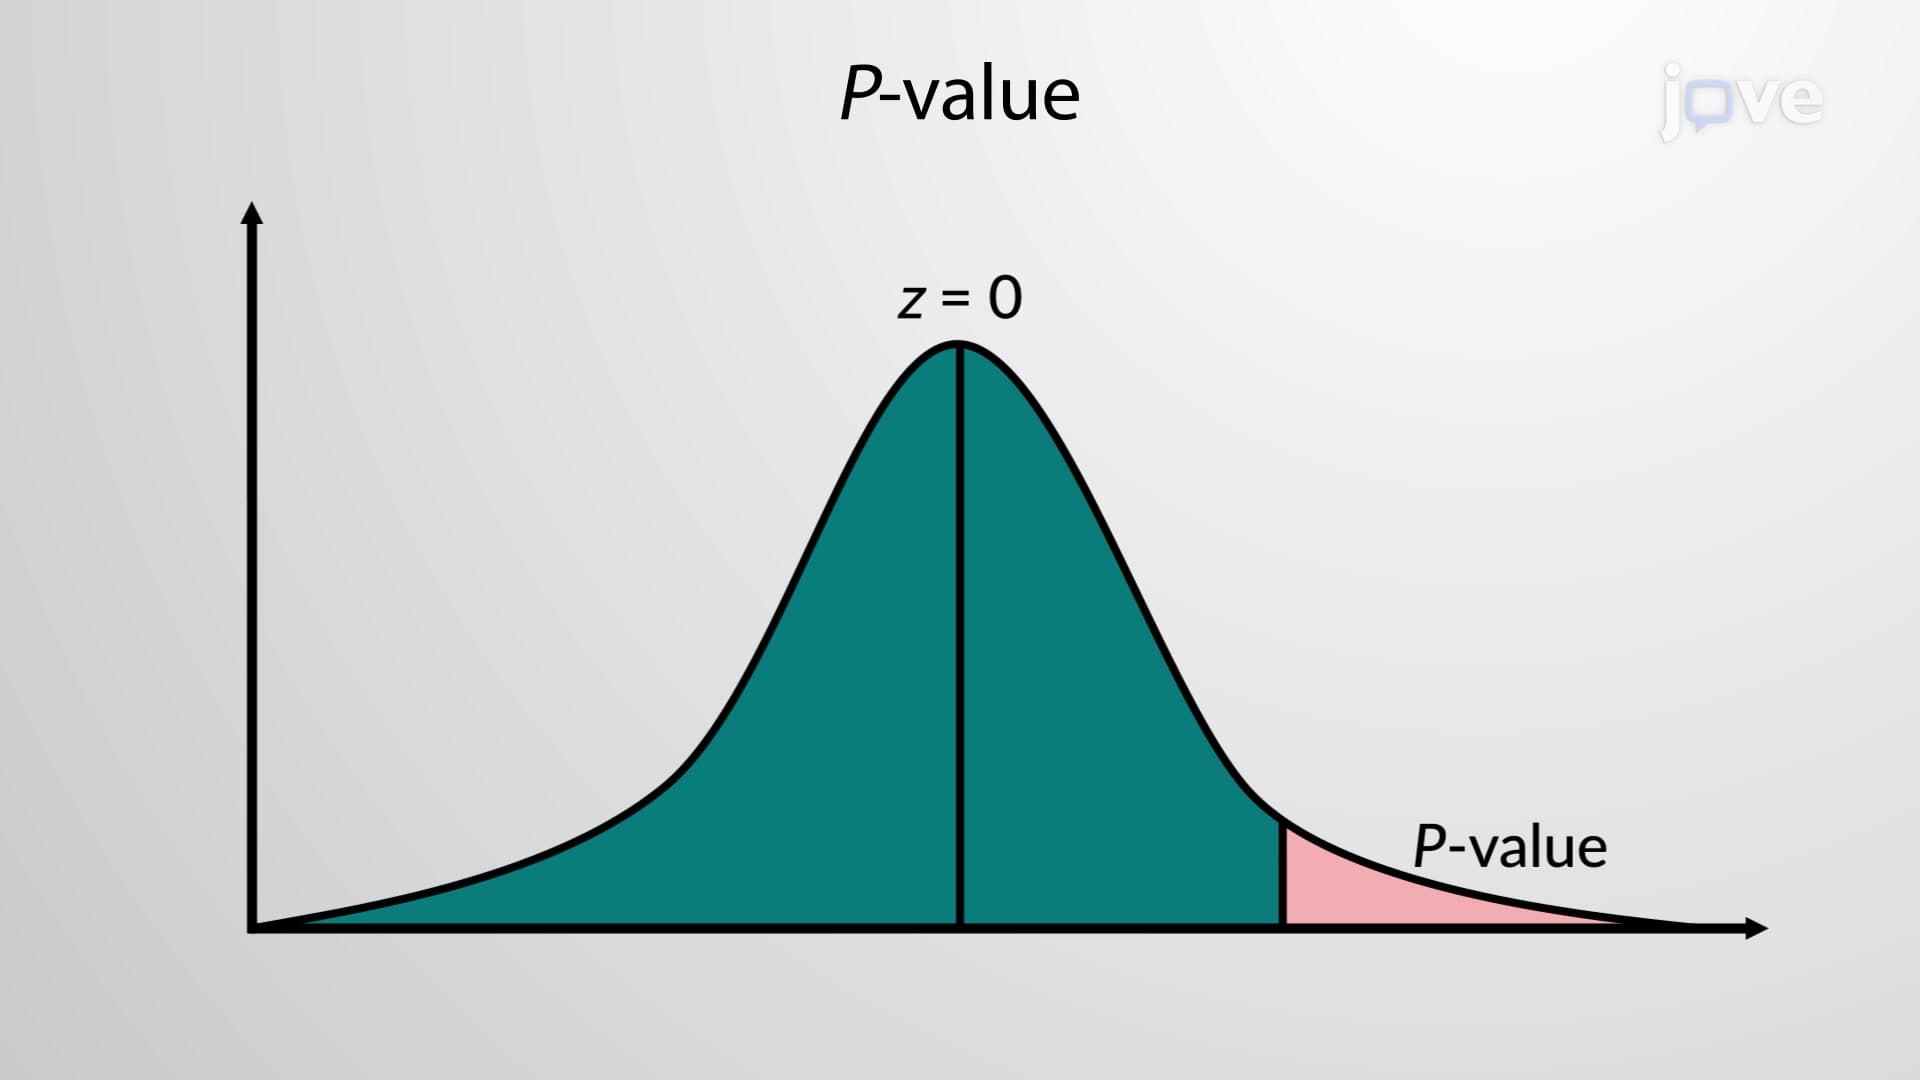
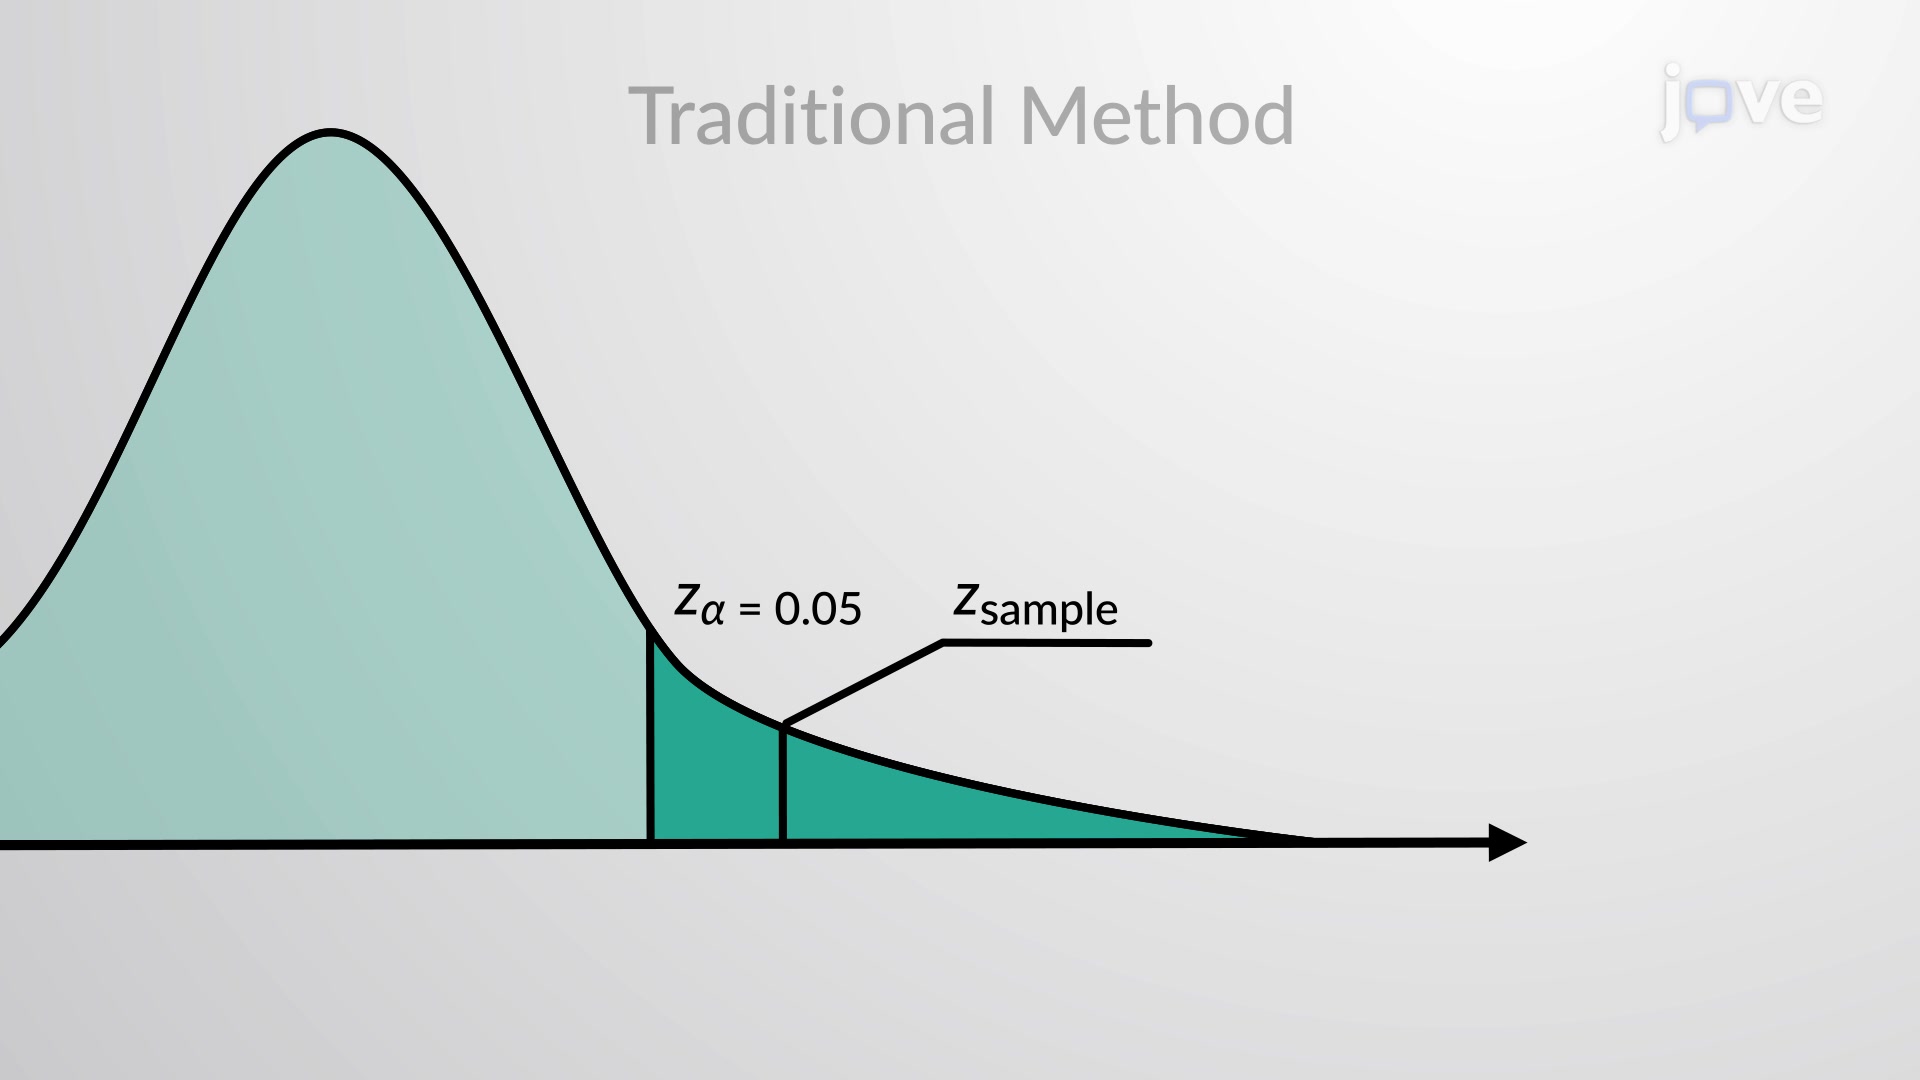
In practice, the decision making traditional method involves plotting critical values on probability distribution curves to create visual decision regions. Test statistics calculated from sample data are then compared to these boundaries. When a test statistic falls in the critical region (the tail areas beyond critical values), it indicates the observed data is sufficiently unlikely under the null hypothesis to warrant rejection.
Modern statistical software like R, SPSS, and Excel automate these calculations, but understanding the underlying traditional method remains crucial for proper interpretation. This knowledge proves invaluable for students preparing for standardized tests and professionals in fields ranging from quality control engineering to clinical research.
Related Micro-courses