Loading video…

 13 Concepts
 130.6K views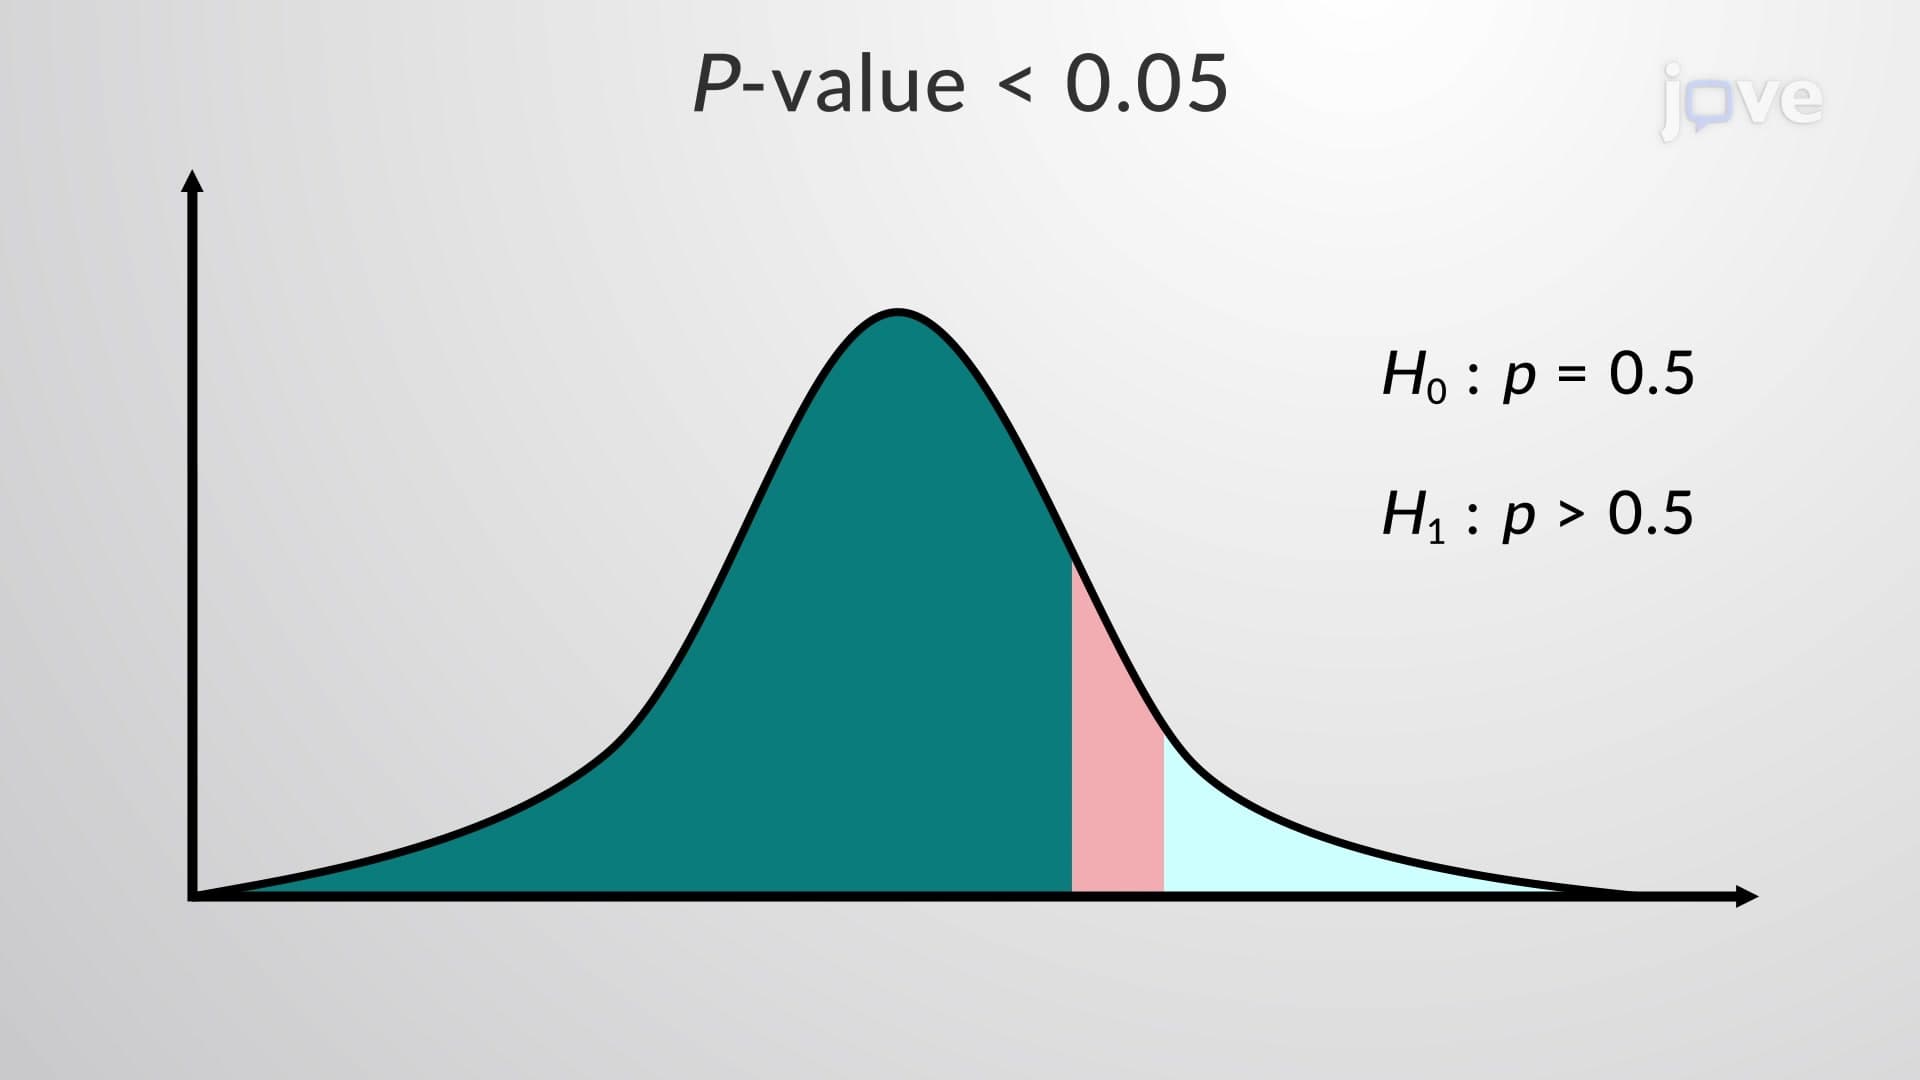

Video Summary: What Is P Value
Ever wonder how medical researchers determine if a new drug actually works, or how pollsters know their election predictions are reliable? The p value serves as the statistical gateway that helps scientists and researchers make these critical decisions with confidence. When the FDA evaluates clinical trial data for new medications, p values help determine whether observed results represent real effects or mere coincidence. Understanding what is p value empowers students to interpret research findings, analyze data validity, and make evidence-based conclusions across multiple disciplines. Watch the full video on JoVE Coach to master this concept with expert-led visuals and step-by-step explanations.
The p value represents one of the most crucial concepts in inferential statistics, serving as the bridge between sample data and population-level conclusions. At its core, a p value quantifies the probability of observing your actual test results-or something even more extreme-assuming the null hypothesis is completely true. This seemingly simple definition carries profound implications for how we interpret research findings across disciplines from clinical medicine to educational psychology.
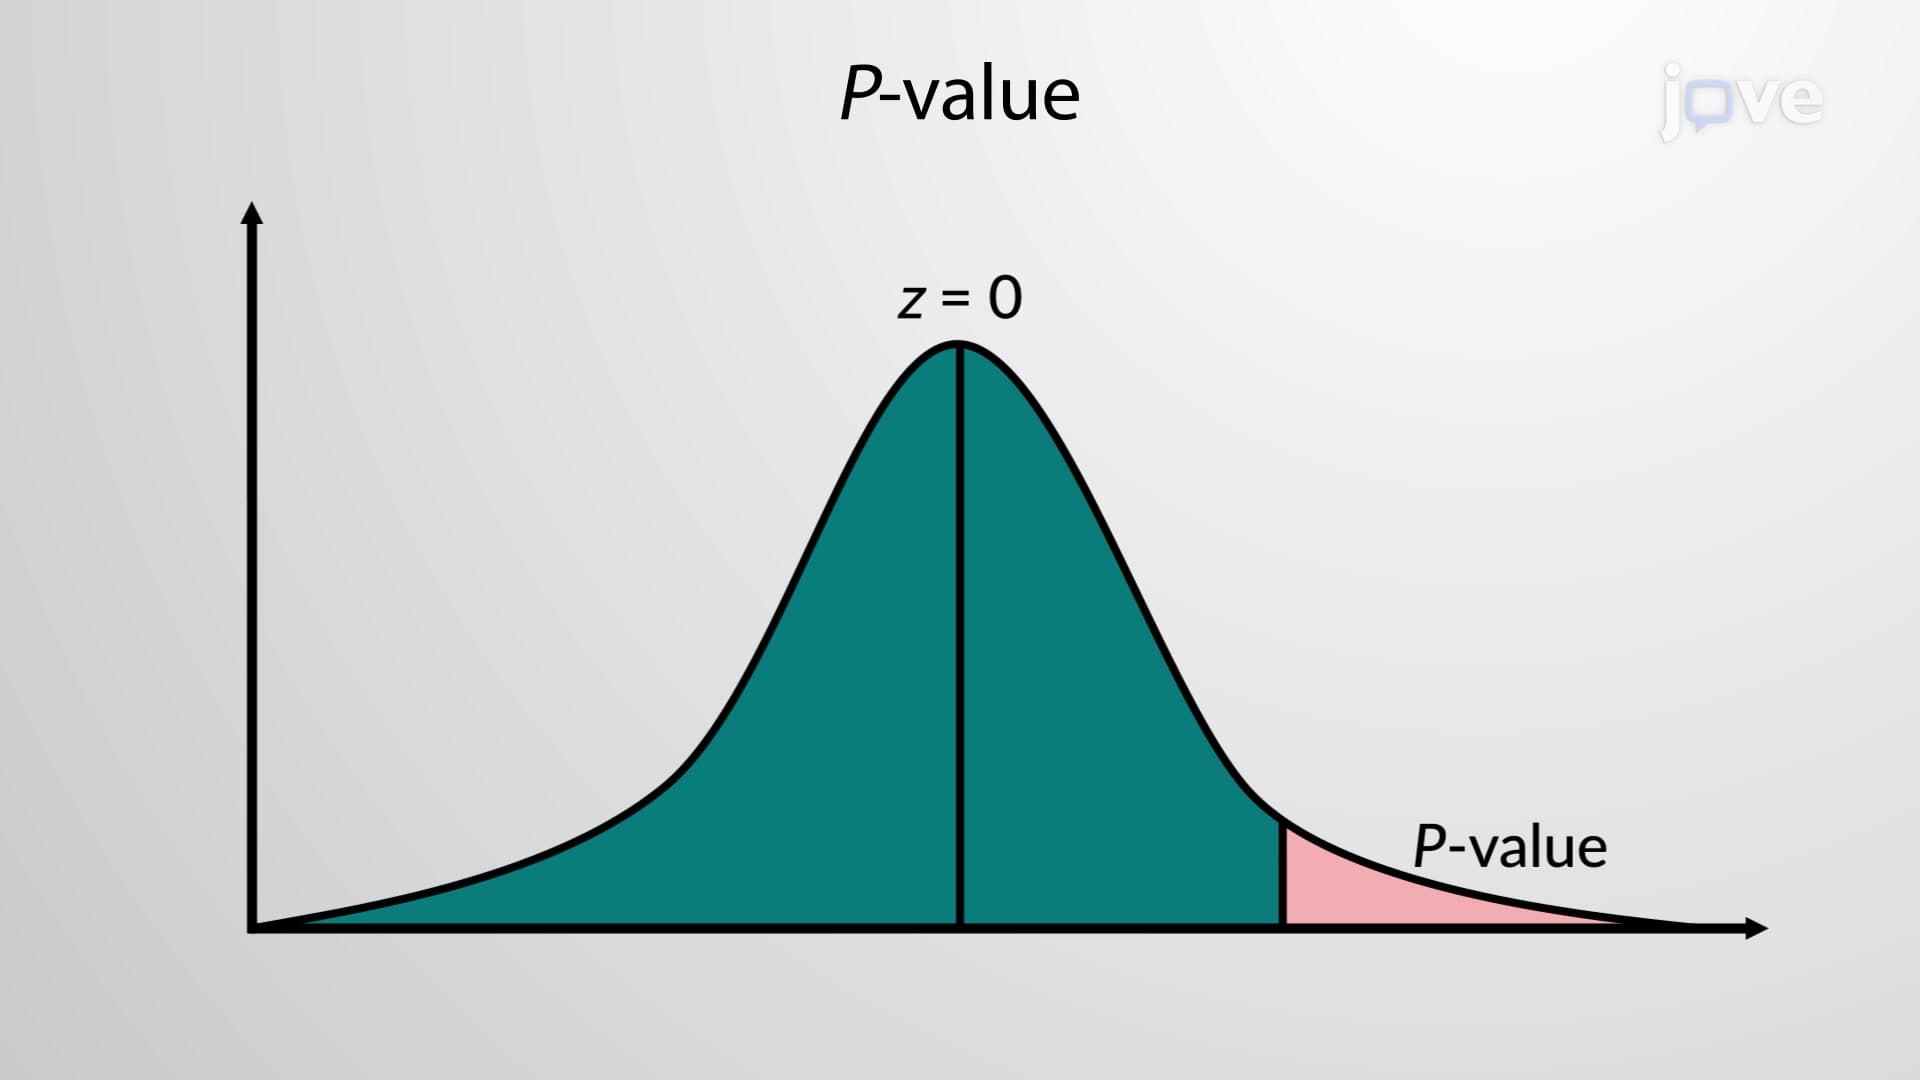
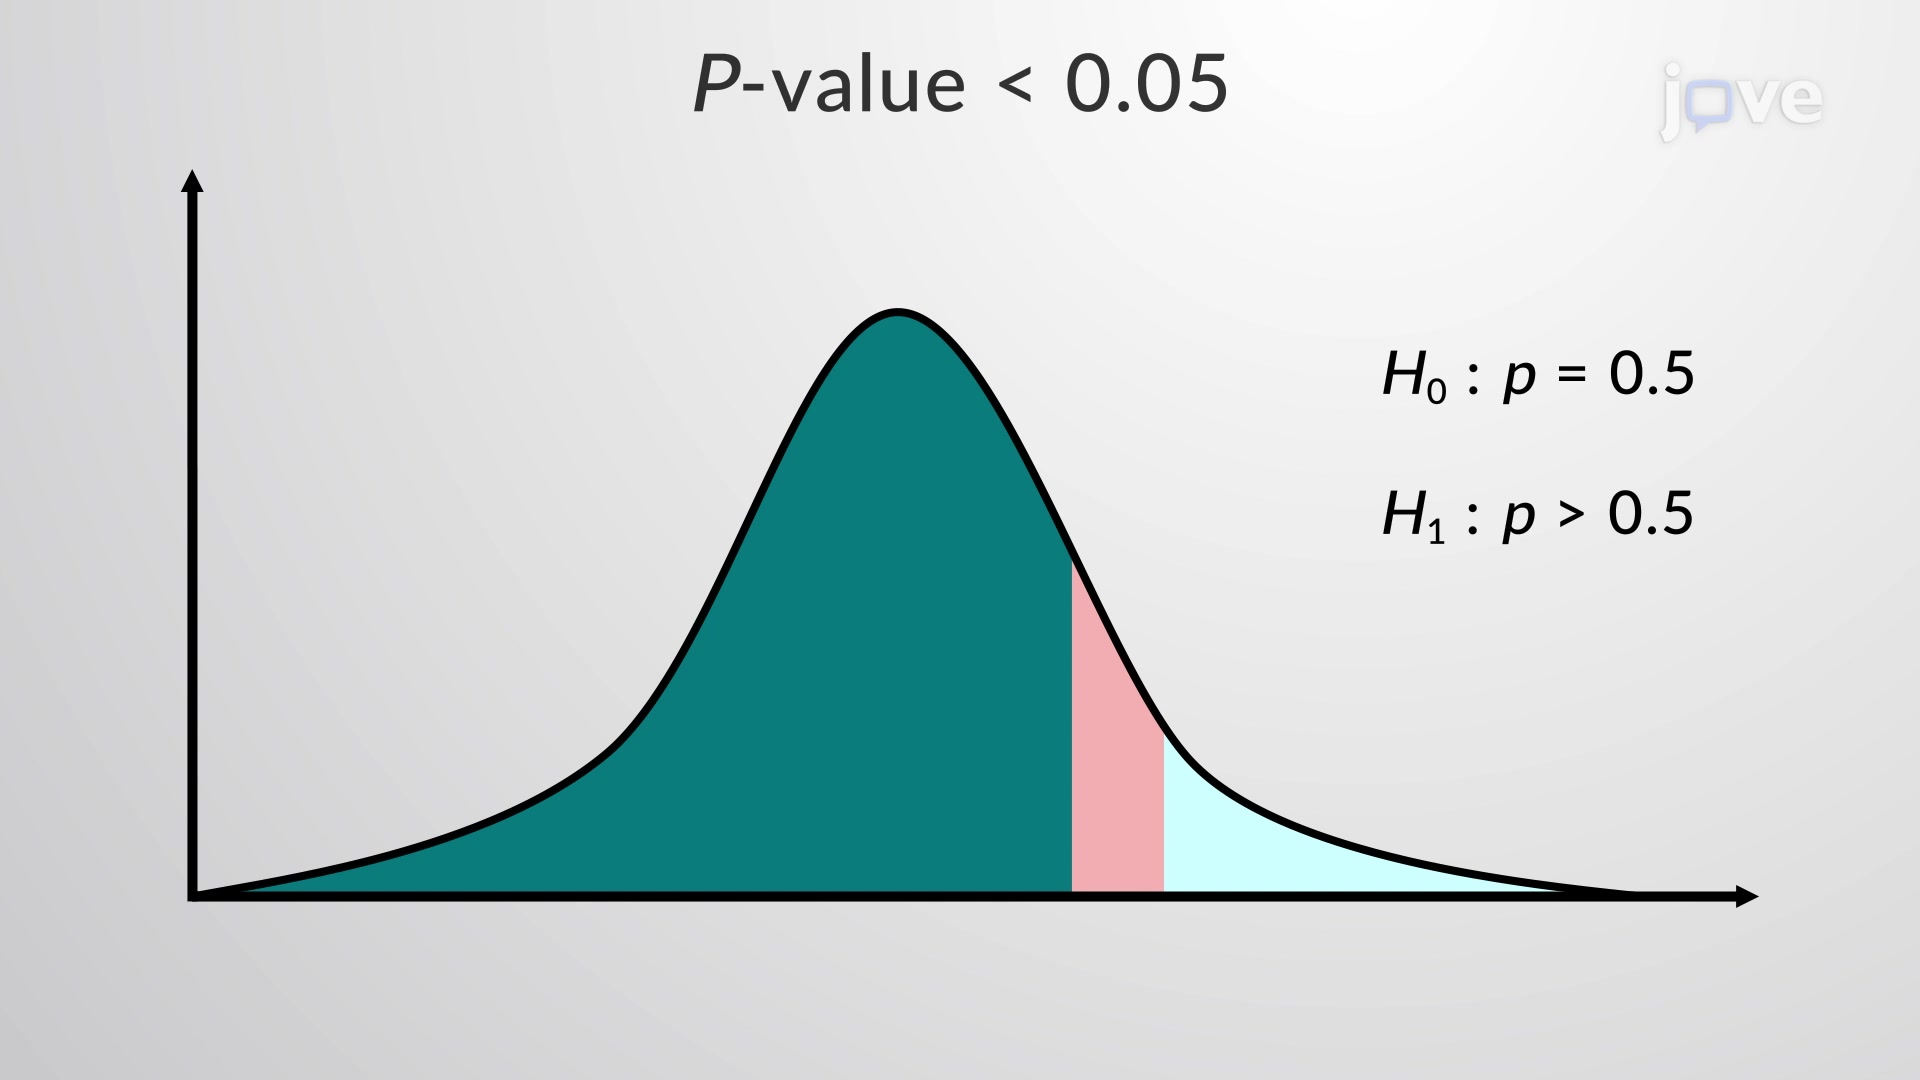
When researchers conduct hypothesis tests, they calculate a test statistic from sample data that follows a known probability distribution. The p value emerges as the area under this distribution curve, extending from the test statistic value toward the tail(s) of the distribution. For instance, if a pharmaceutical company tests whether their new cholesterol medication reduces LDL levels more effectively than existing treatments, they might observe a test statistic of 2.3 in a normal distribution. The p value would represent the probability of getting a test statistic of 2.3 or higher purely by random chance, assuming the new drug has no real effect.
This interpretation directly connects to the p value definition that students encounter in AP Statistics, college-level biostatistics courses, and standardized exams like the MCAT. The smaller the p value, the stronger the evidence against the null hypothesis, because it suggests that observing such extreme results by chance alone would be highly unlikely.
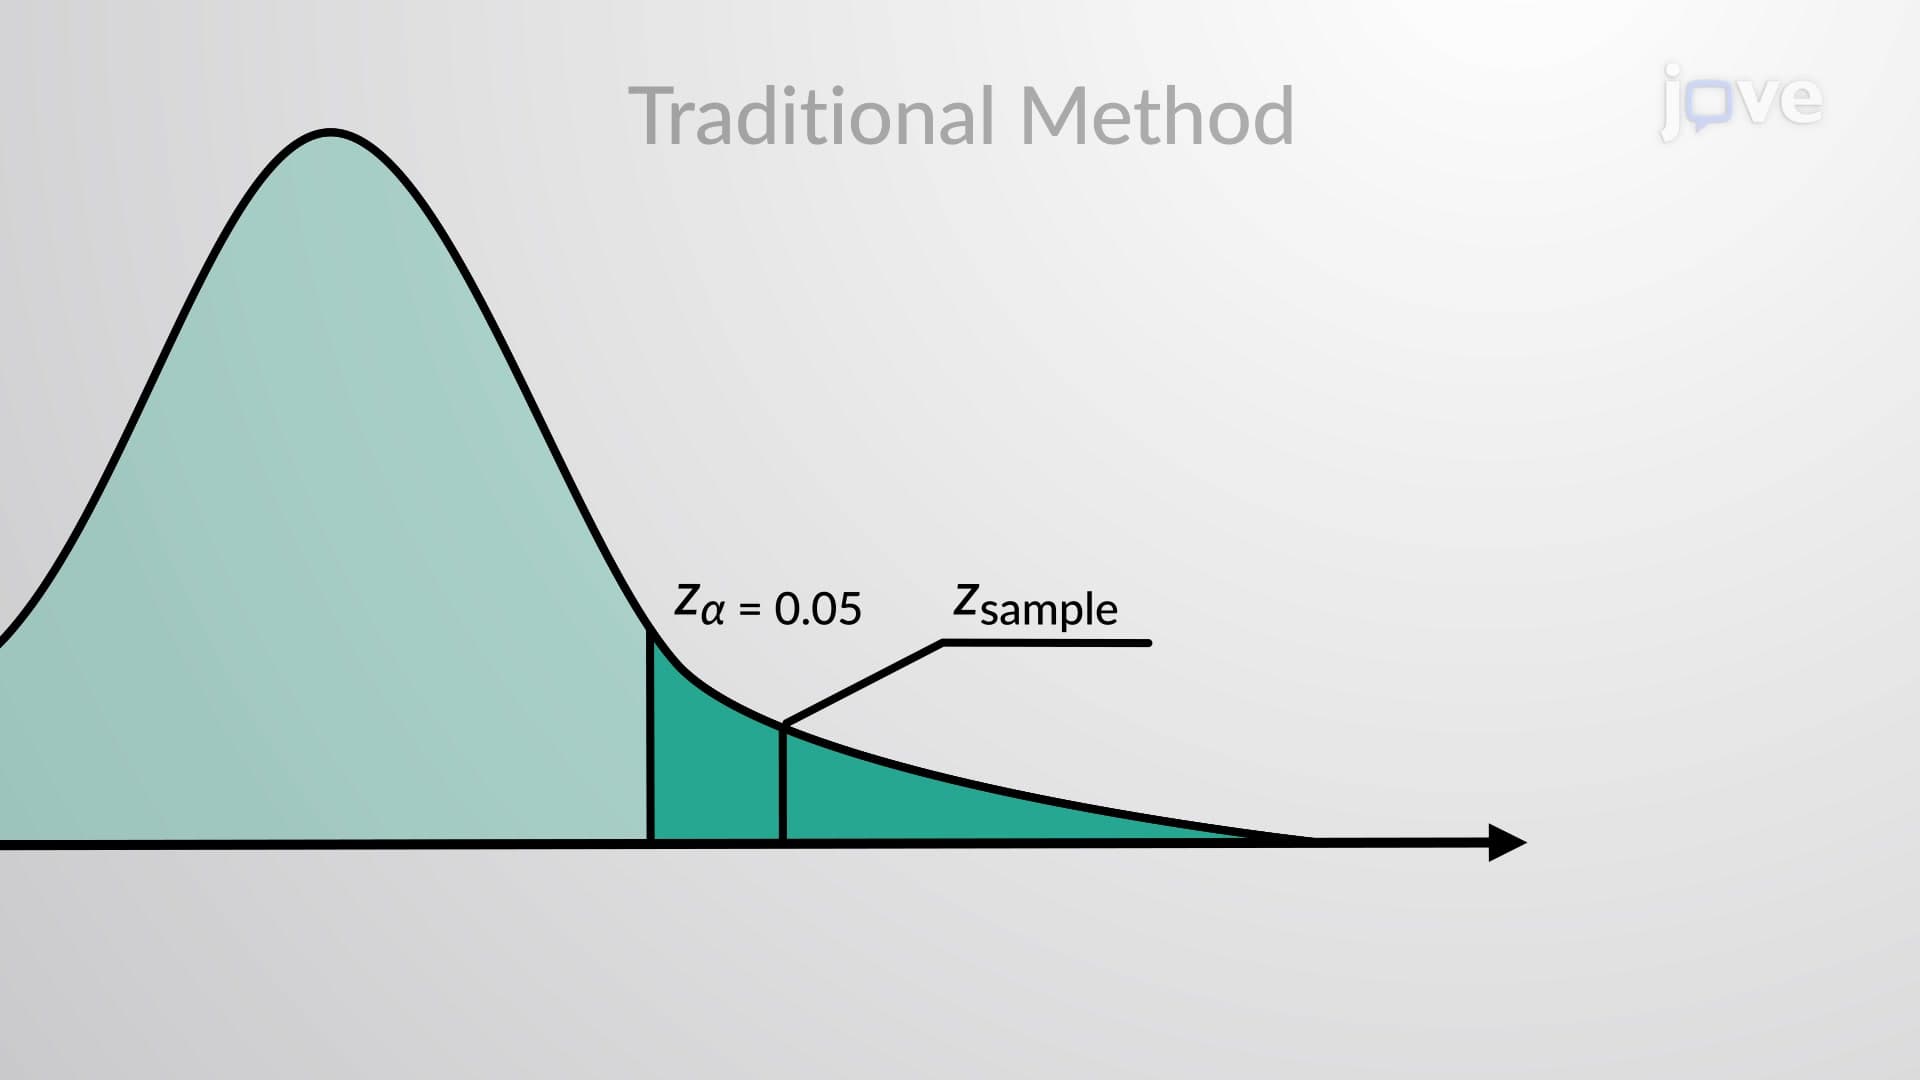
The conventional significance level of 0.05 serves as a widely accepted threshold in academic research and clinical trials. When a p value falls below this benchmark, researchers typically reject the null hypothesis and conclude that their findings are "statistically significant." However, this binary approach requires careful interpretation. A p value of 0.049 doesn't represent dramatically stronger evidence than 0.051-the difference lies in crossing an arbitrary but useful decision boundary.
Consider how the Centers for Disease Control and Prevention (CDC) evaluates vaccine effectiveness studies. Researchers might compare infection rates between vaccinated and unvaccinated groups, calculating p values to determine whether observed differences exceed what random variation could reasonably explain. These statistical decisions directly influence public health policy and medical recommendations affecting millions of Americans.
P value calculations vary depending on whether researchers conduct one-tailed or two-tailed tests. In one-tailed tests, researchers predict the direction of their effect and calculate p values using either the left or right tail of the distribution. Two-tailed tests, more conservative by nature, split the significance level across both tails and are particularly common in exploratory research where the direction of effects remains uncertain.
Students preparing for college statistics courses or the AP Statistics exam should understand these distinctions, as test questions frequently require identifying appropriate tail configurations based on research scenarios and alternative hypotheses.
Related Micro-courses