Loading video…


 13 Concepts
 130.6K views

Video Summary: Hypothesis Testing for a Mean with Known Population Standard Deviation
Did you know that researchers at Duke University discovered blue light can increase zebrafish spawning rates by over 120%? Hypothesis testing for a mean with known population standard deviation allows scientists to determine if such experimental results are statistically significant or just random chance. This powerful statistical method compares sample means against population parameters when the population standard deviation is already established from prior research. The FDA uses similar testing protocols when evaluating new medications' effectiveness compared to existing treatments. Watch the full video on JoVE Coach to master this concept with expert-led visuals and step-by-step explanations.
Hypothesis testing for a mean with known population standard deviation serves as a cornerstone statistical method in scientific research and quality control processes. This approach becomes particularly valuable when researchers have access to established population parameters from extensive prior studies or industry standards. Unlike scenarios where population standard deviation must be estimated from sample data, having this known value allows for more precise statistical analysis using the standard normal (z) distribution.
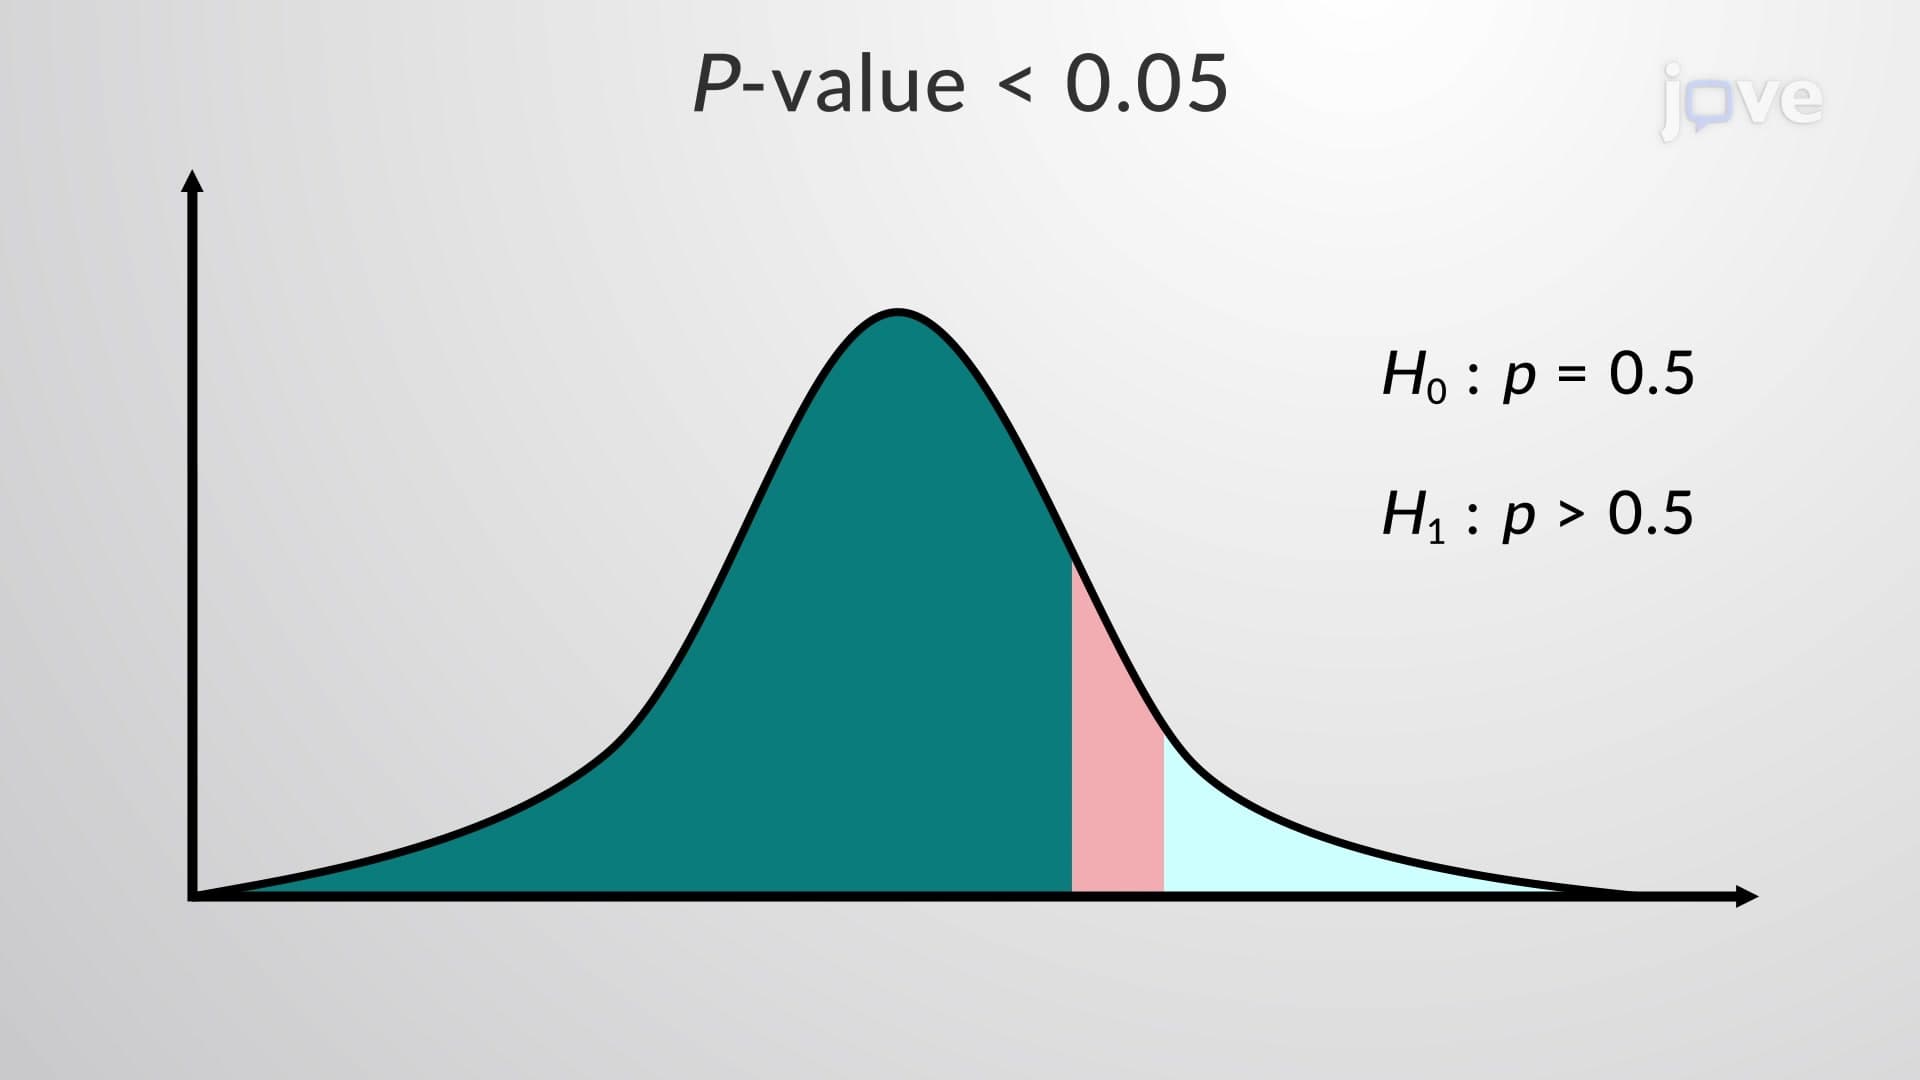
The z-test methodology forms the foundation of this hypothesis testing approach. Researchers establish a null hypothesis (H₀) stating no significant difference exists between the sample mean and hypothesized population mean, while the alternative hypothesis (H₁) proposes a specific directional or non-directional change. The test statistic calculation follows the formula: z = (sample mean - hypothesized mean) / (population standard deviation / √sample size).
Consider pharmaceutical research at Johns Hopkins, where scientists test whether a new cholesterol medication reduces LDL levels more effectively than existing treatments. With established population standard deviation from decades of cardiovascular research, investigators can precisely determine if observed reductions represent genuine therapeutic effects or random variation.
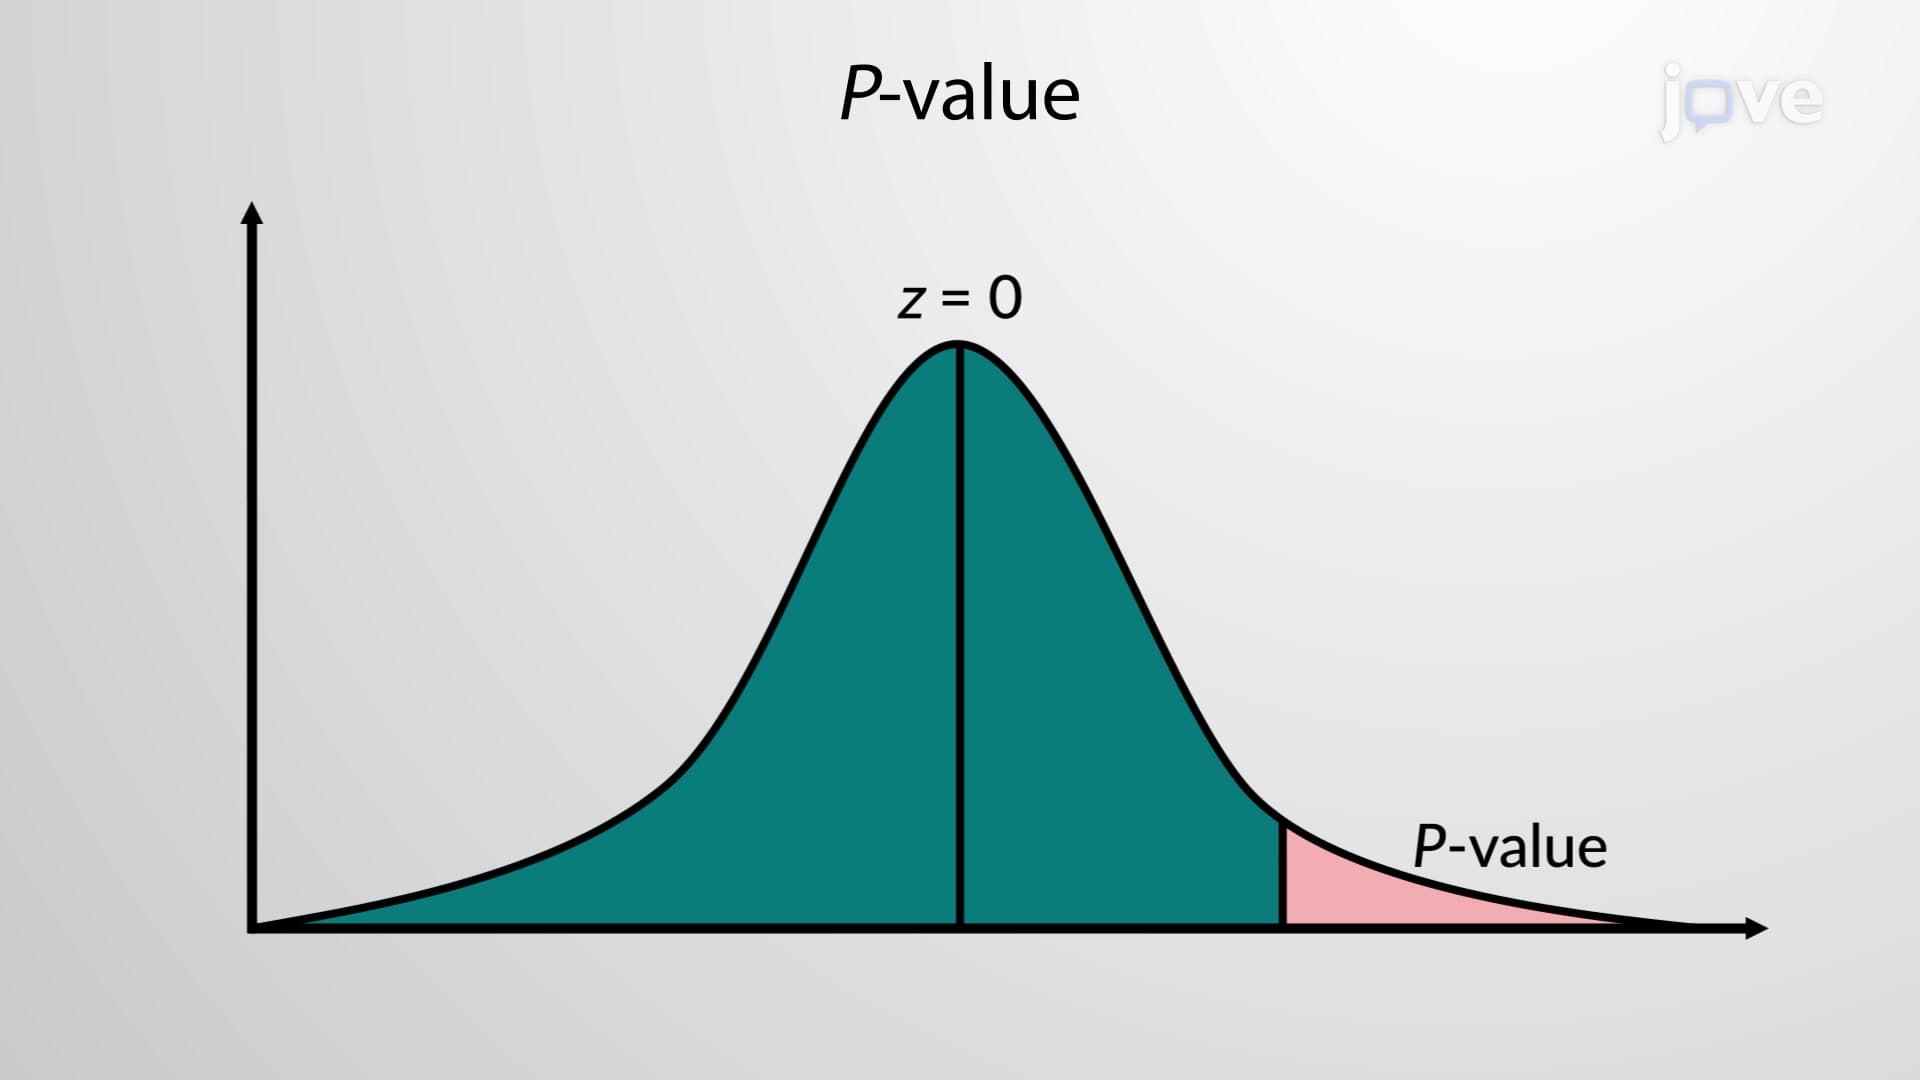
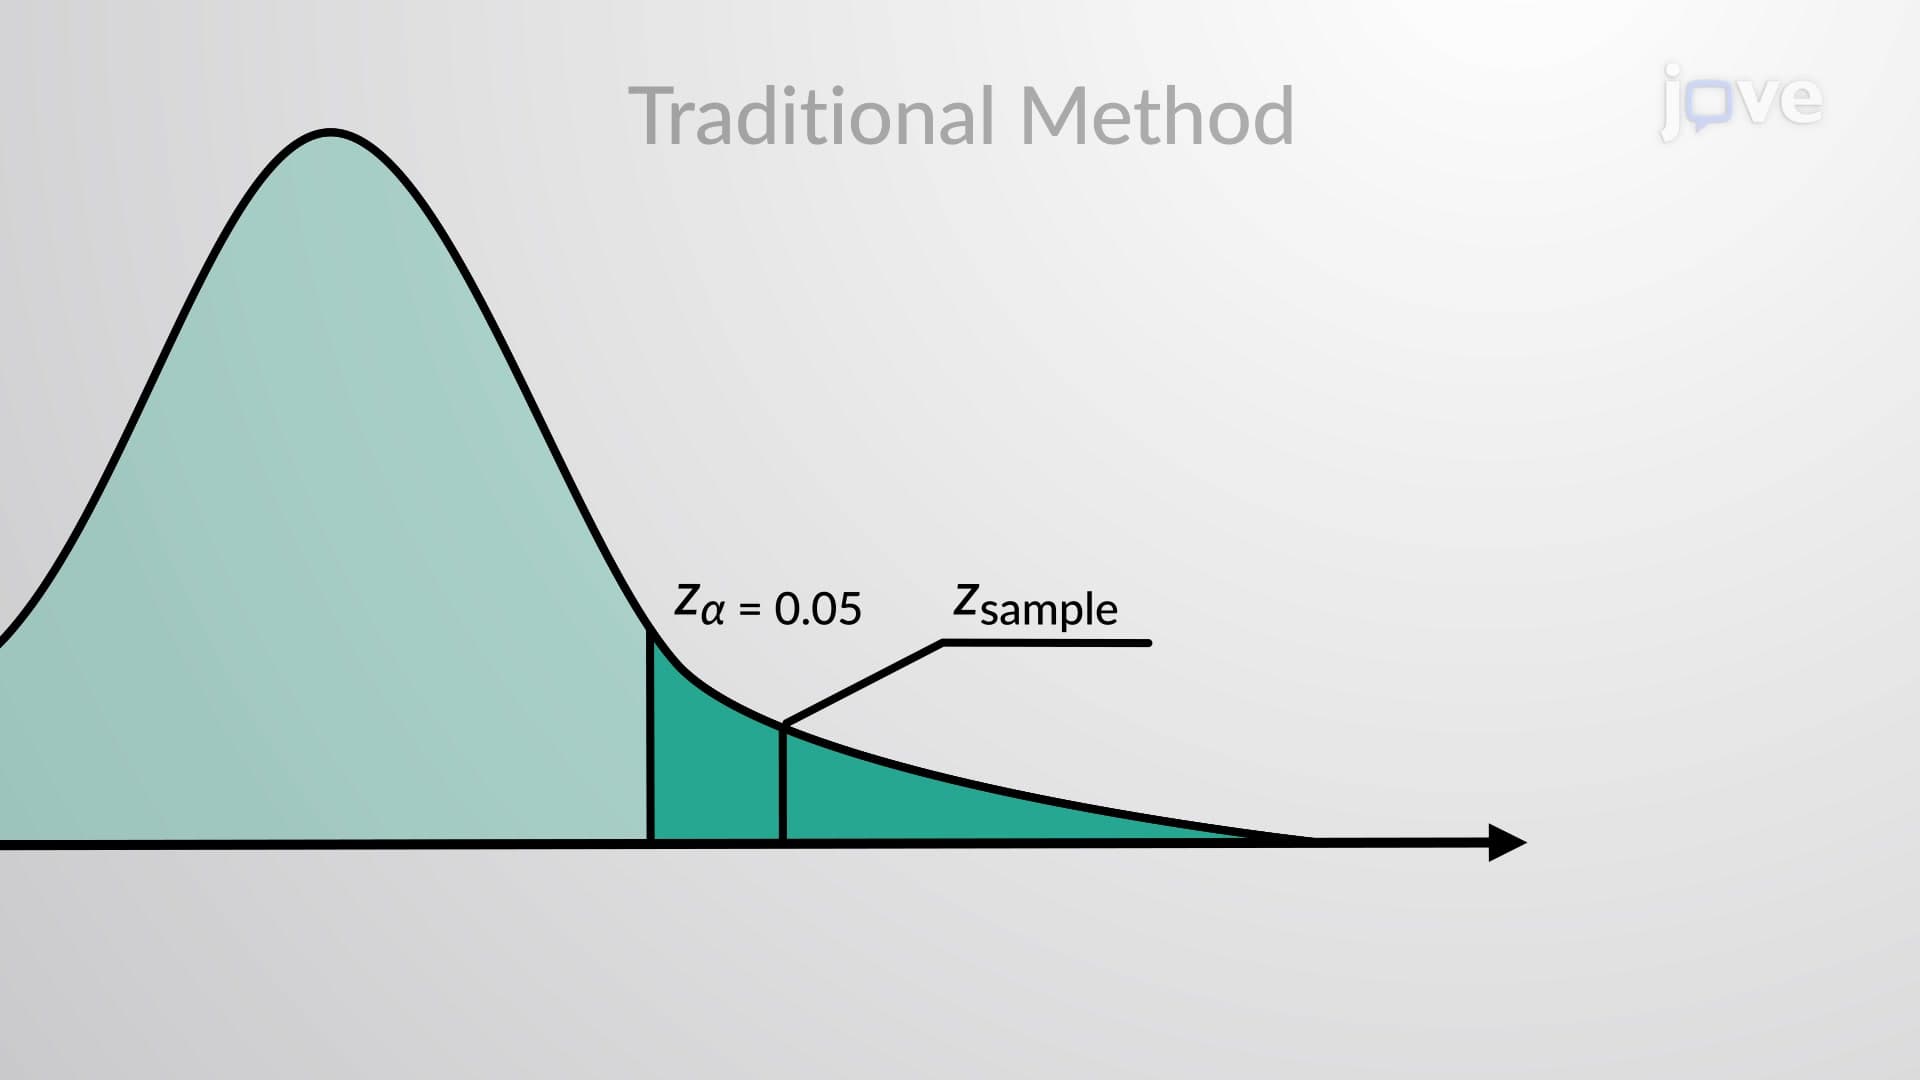
The concept of critical regions determines where calculated z-statistics must fall to justify rejecting the null hypothesis. At the conventional 0.05 significance level, critical values of ±1.96 define these boundaries for two-tailed tests, while one-tailed tests use ±1.645. When calculated z-statistics exceed these thresholds, researchers conclude that observed differences are statistically significant rather than due to sampling variability.
This methodology proves essential for AP Statistics students and college undergraduates preparing for standardized assessments. The College Board's AP Statistics exam frequently features hypothesis testing scenarios requiring students to identify appropriate test types, calculate test statistics, and interpret results within scientific contexts.
Quality control departments at major manufacturers like Boeing or General Electric routinely employ this testing method to ensure component specifications meet safety standards. Environmental scientists use similar approaches when evaluating pollution intervention effectiveness, comparing post-treatment measurements against established baseline values. Medical researchers conducting FDA-approved clinical trials rely on these statistical frameworks to demonstrate treatment efficacy with appropriate confidence levels, ensuring patient safety while advancing therapeutic knowledge.
Related Micro-courses