Loading video…

 13 Concepts
 130.6K views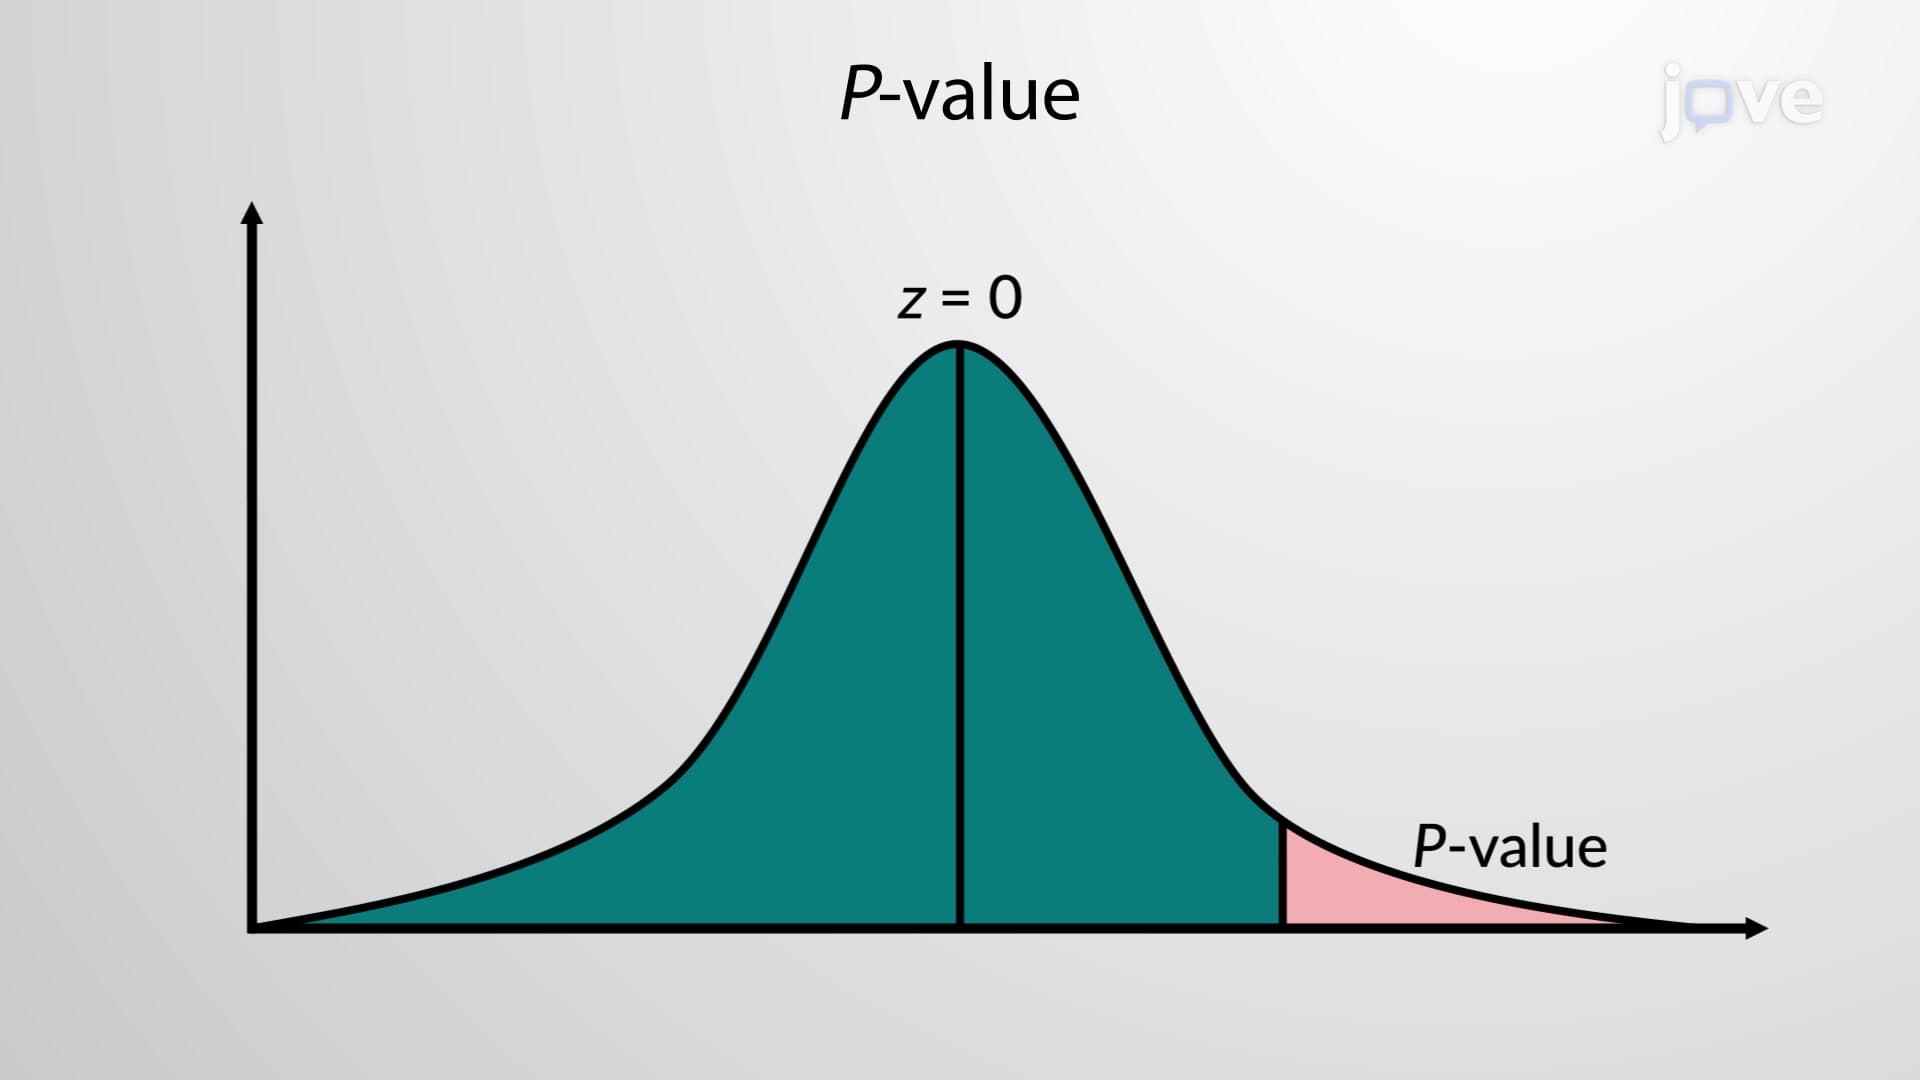

Video Summary: Decision Making P Value Method Guide
Did you know that pharmaceutical companies use statistical methods to determine if new medications are truly effective before FDA approval? The decision making p value method provides a systematic approach to hypothesis testing by comparing calculated probabilities against predetermined significance levels. For instance, when Pfizer tested their COVID-19 vaccine efficacy, researchers used p-value calculations to demonstrate statistical significance. This Decision Making P Value Method Guide breaks down the step-by-step process from hypothesis formation through final statistical conclusions. Watch the full video on JoVE Coach to master this concept with expert-led visuals and step-by-step explanations.
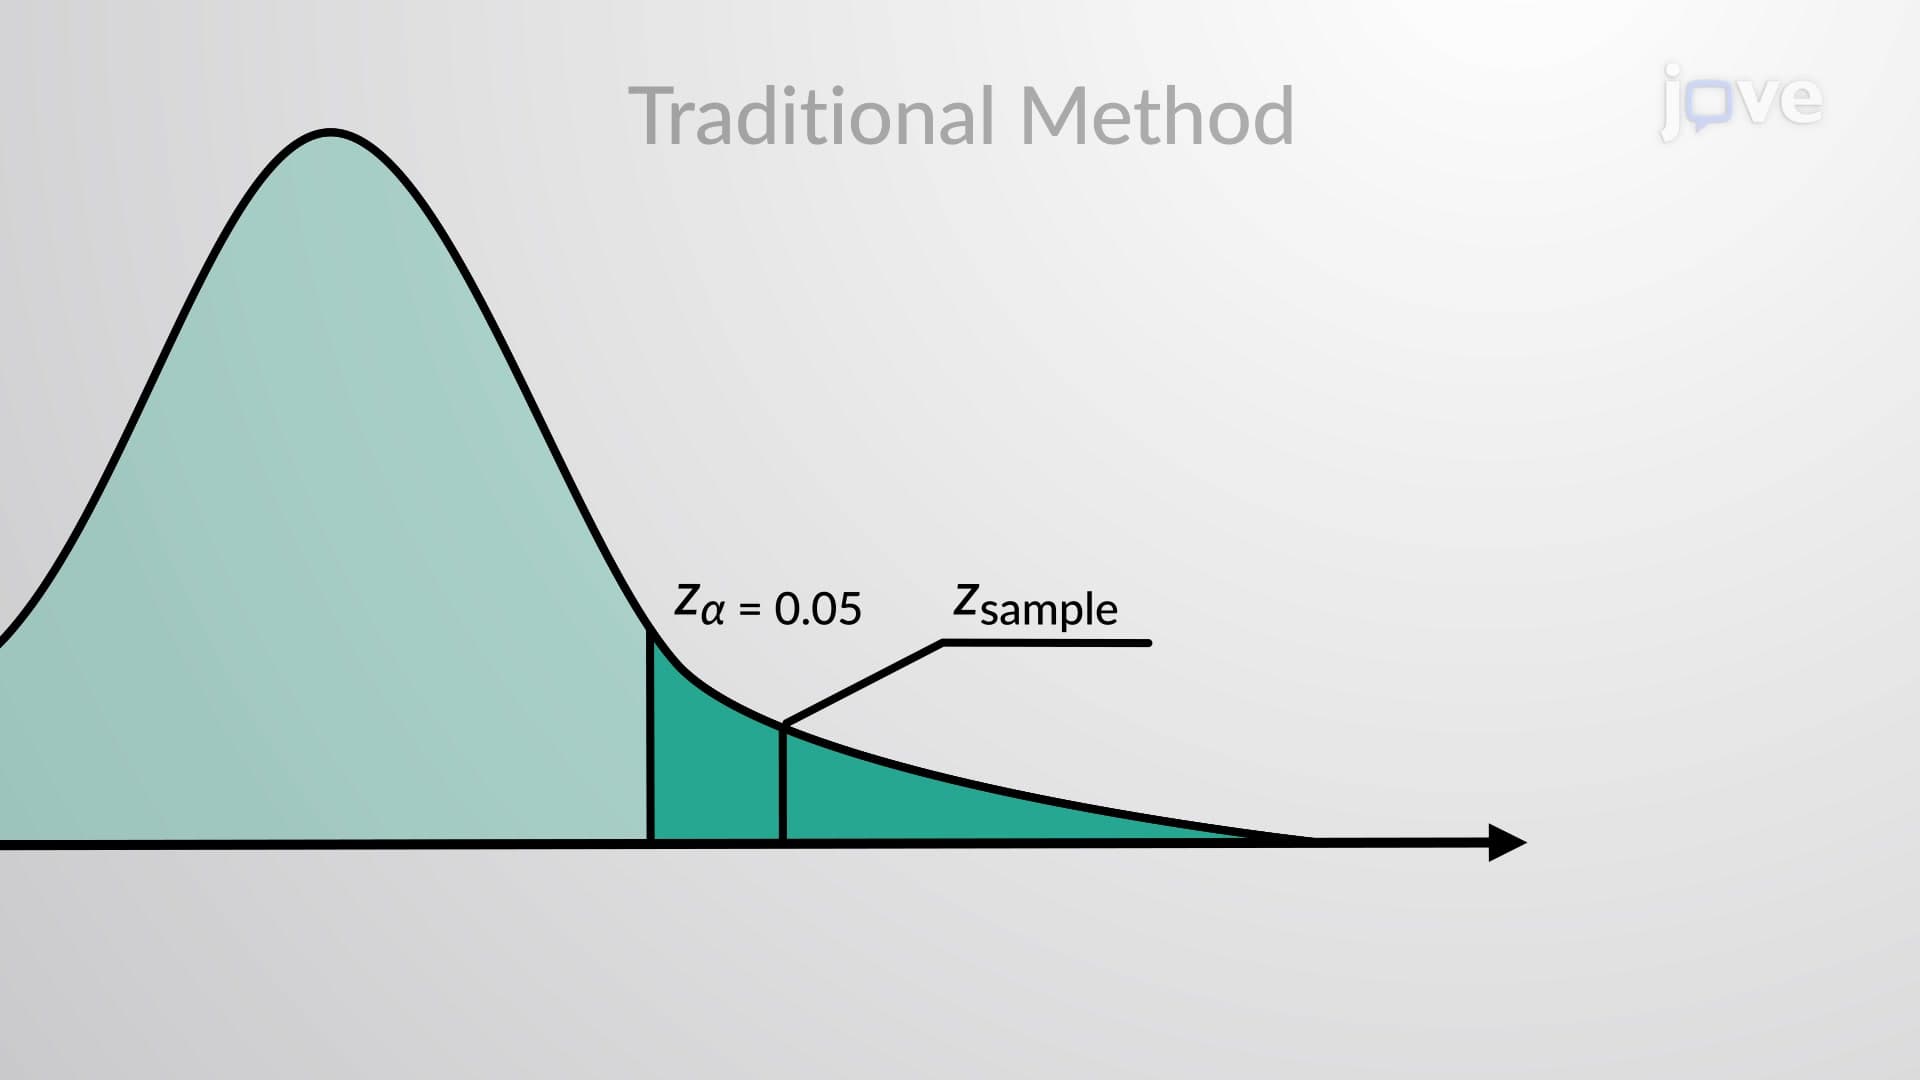
The decision making p value method represents a cornerstone of statistical inference, offering researchers and analysts a quantitative approach to hypothesis testing. Unlike traditional critical value methods, this approach directly calculates the probability of observing test results at least as extreme as those obtained, assuming the null hypothesis is true. This methodology has become the gold standard in fields ranging from medical research at institutions like Johns Hopkins University to quality control processes at major US corporations like General Electric.
The systematic approach begins with hypothesis formulation, where researchers establish both null (H₀) and alternative (H₁) hypotheses. For population parameters, these might take forms such as H₀: μ = μ₀ versus H₁: μ ≠ μ₀ for two-tailed tests. The significance level selection follows, with α = 0.05 representing the standard in most social sciences, while α = 0.01 provides more stringent criteria for medical and pharmaceutical research. Test statistic calculation depends on the parameter being tested-z-tests for large samples, t-tests for small samples with unknown population standard deviation, or chi-square tests for categorical data.
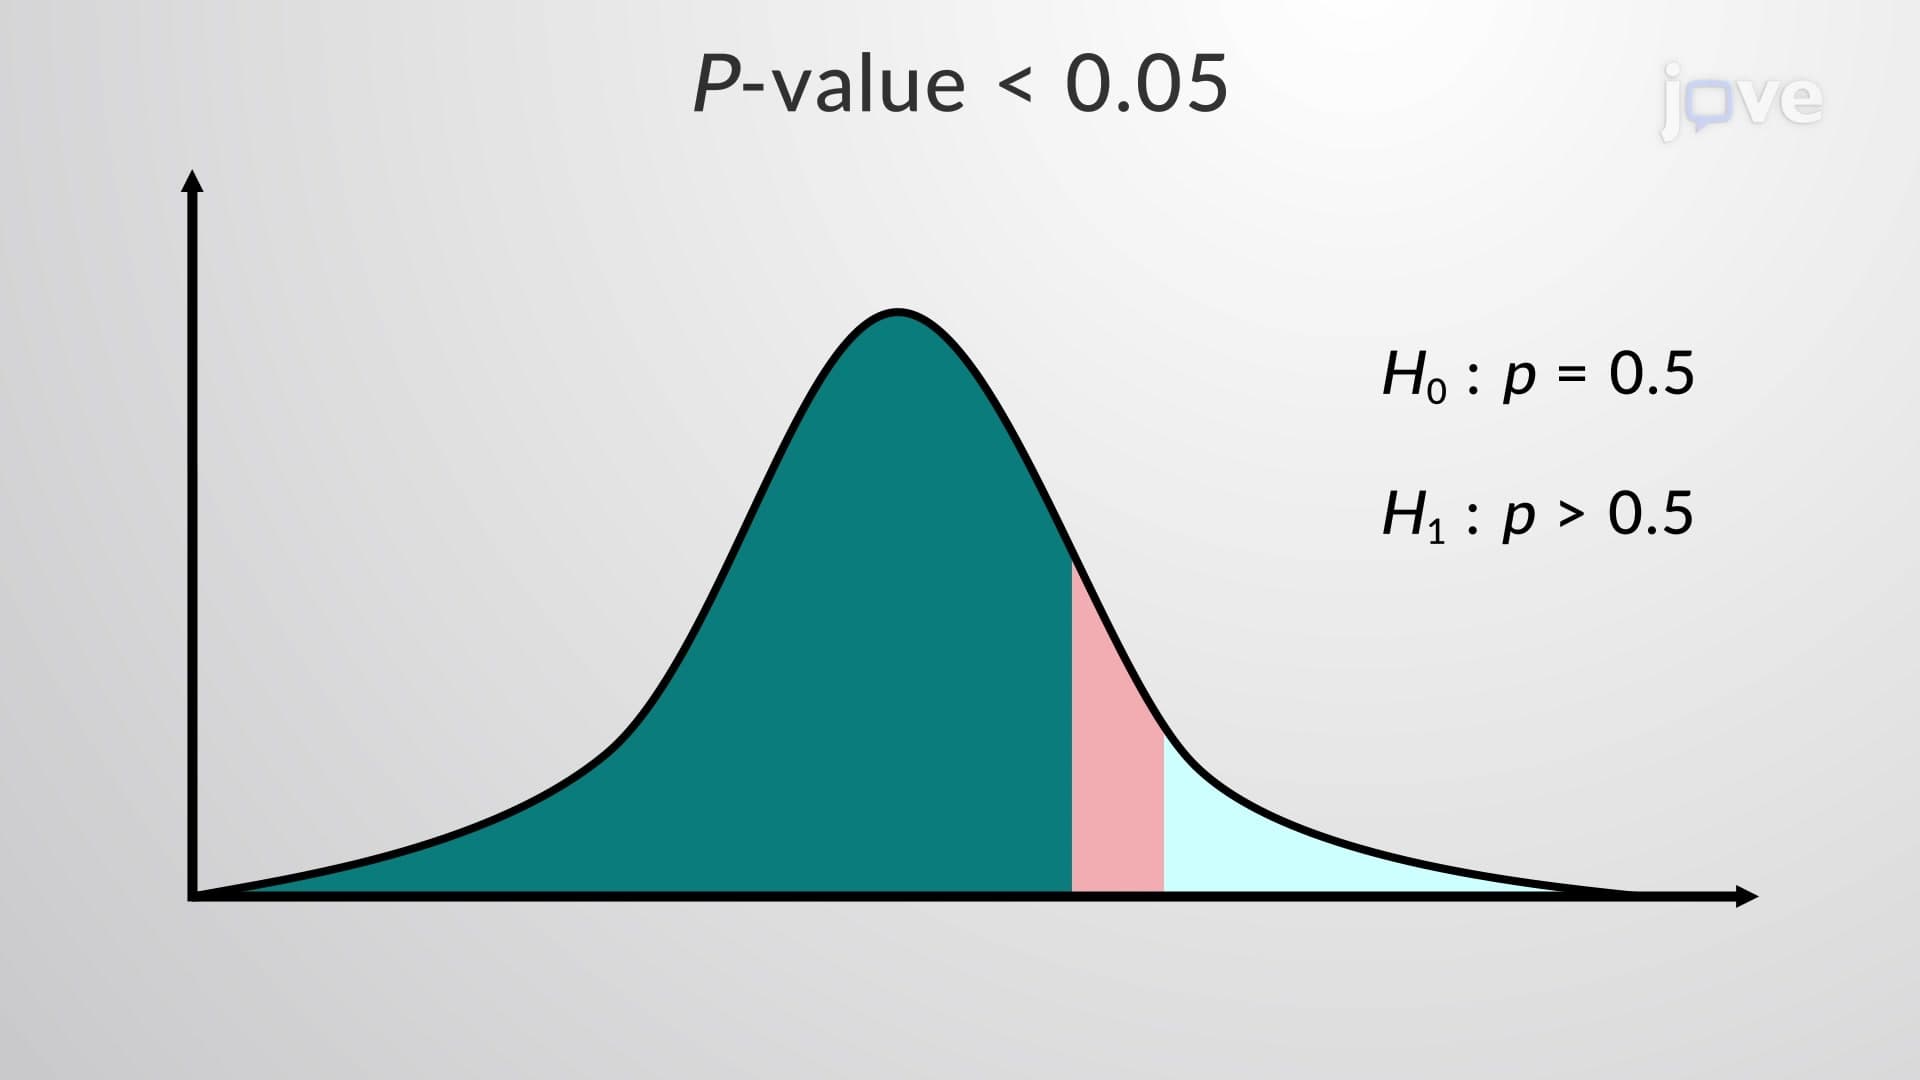
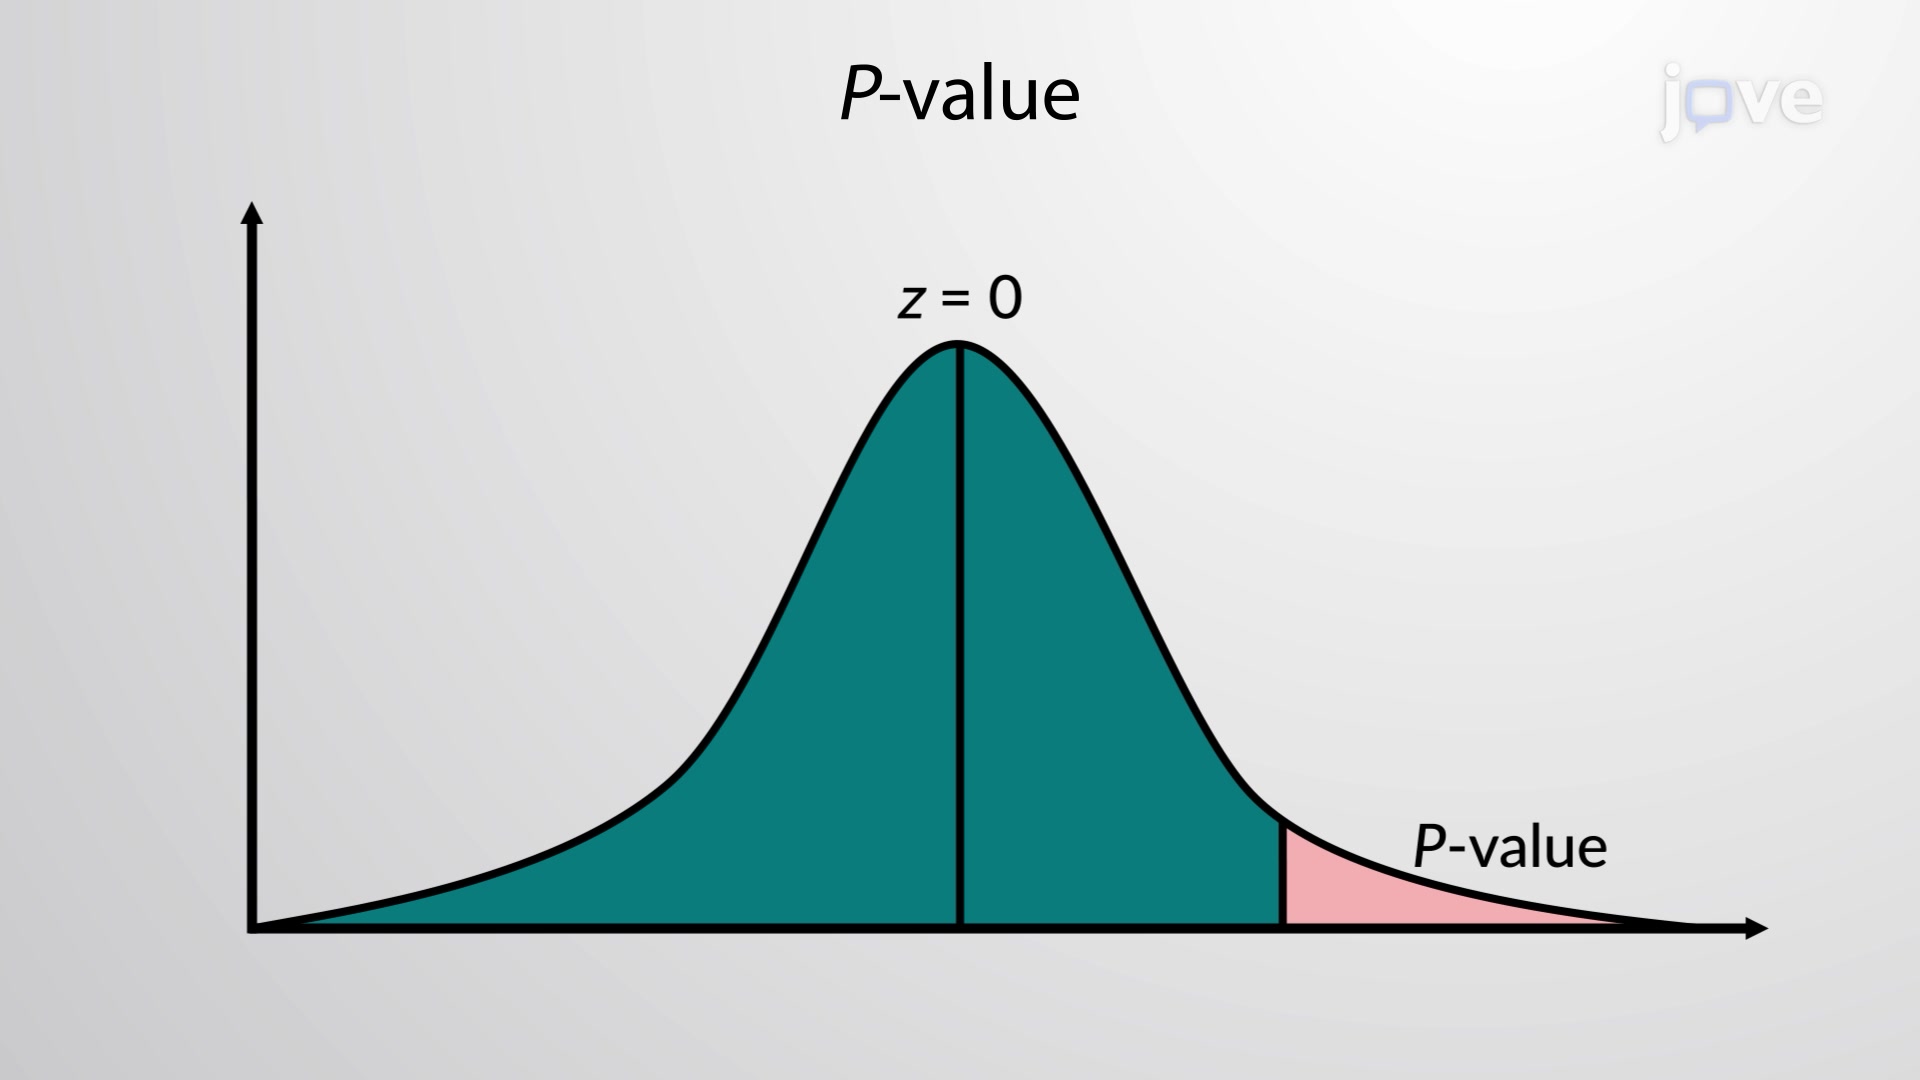
The p-value represents the probability of obtaining results at least as extreme as observed, given that the null hypothesis is true. For example, if testing whether a new teaching method improves standardized test scores, a p-value of 0.03 indicates a 3% chance of observing such improvement (or greater) purely by random variation. This interpretation becomes crucial for AP Statistics students and college undergraduates preparing for comprehensive exams, as understanding p-values directly impacts performance on standardized assessments.
Students encounter p-value methodology extensively in AP Statistics curricula and college-level courses at universities like UCLA and University of Michigan. The method appears frequently on standardized exams, including AP Statistics free-response questions and college statistics midterms. Professional applications span quality control in manufacturing, clinical trial analysis in pharmaceutical development, and A/B testing in technology companies like Google and Facebook. Understanding when p-values indicate statistical significance versus practical significance helps students develop critical thinking skills essential for STEM careers and graduate school preparation.
Related Micro-courses