Loading video…


 13 Concepts
 130.6K views

Video Summary: Testing a Claim About Population Proportion Explained
Did you know that 83% of female guppies chose orange males over blue ones in a controlled aquarium study? Testing a claim about population proportion helps researchers determine whether this observed preference truly reflects the population's behavior or just random chance. In US pharmaceutical trials, scientists use identical statistical methods to validate drug effectiveness claims, comparing observed patient outcomes against expected baseline rates. Watch the full video on JoVE Coach to master this concept with expert-led visuals and step-by-step explanations.
Testing a claim about population proportion is a fundamental statistical procedure that allows researchers to validate or refute assertions about what percentage of a population possesses a specific characteristic. This method forms the backbone of evidence-based decision-making across multiple disciplines, from medical research validating treatment effectiveness to quality control in manufacturing processes.
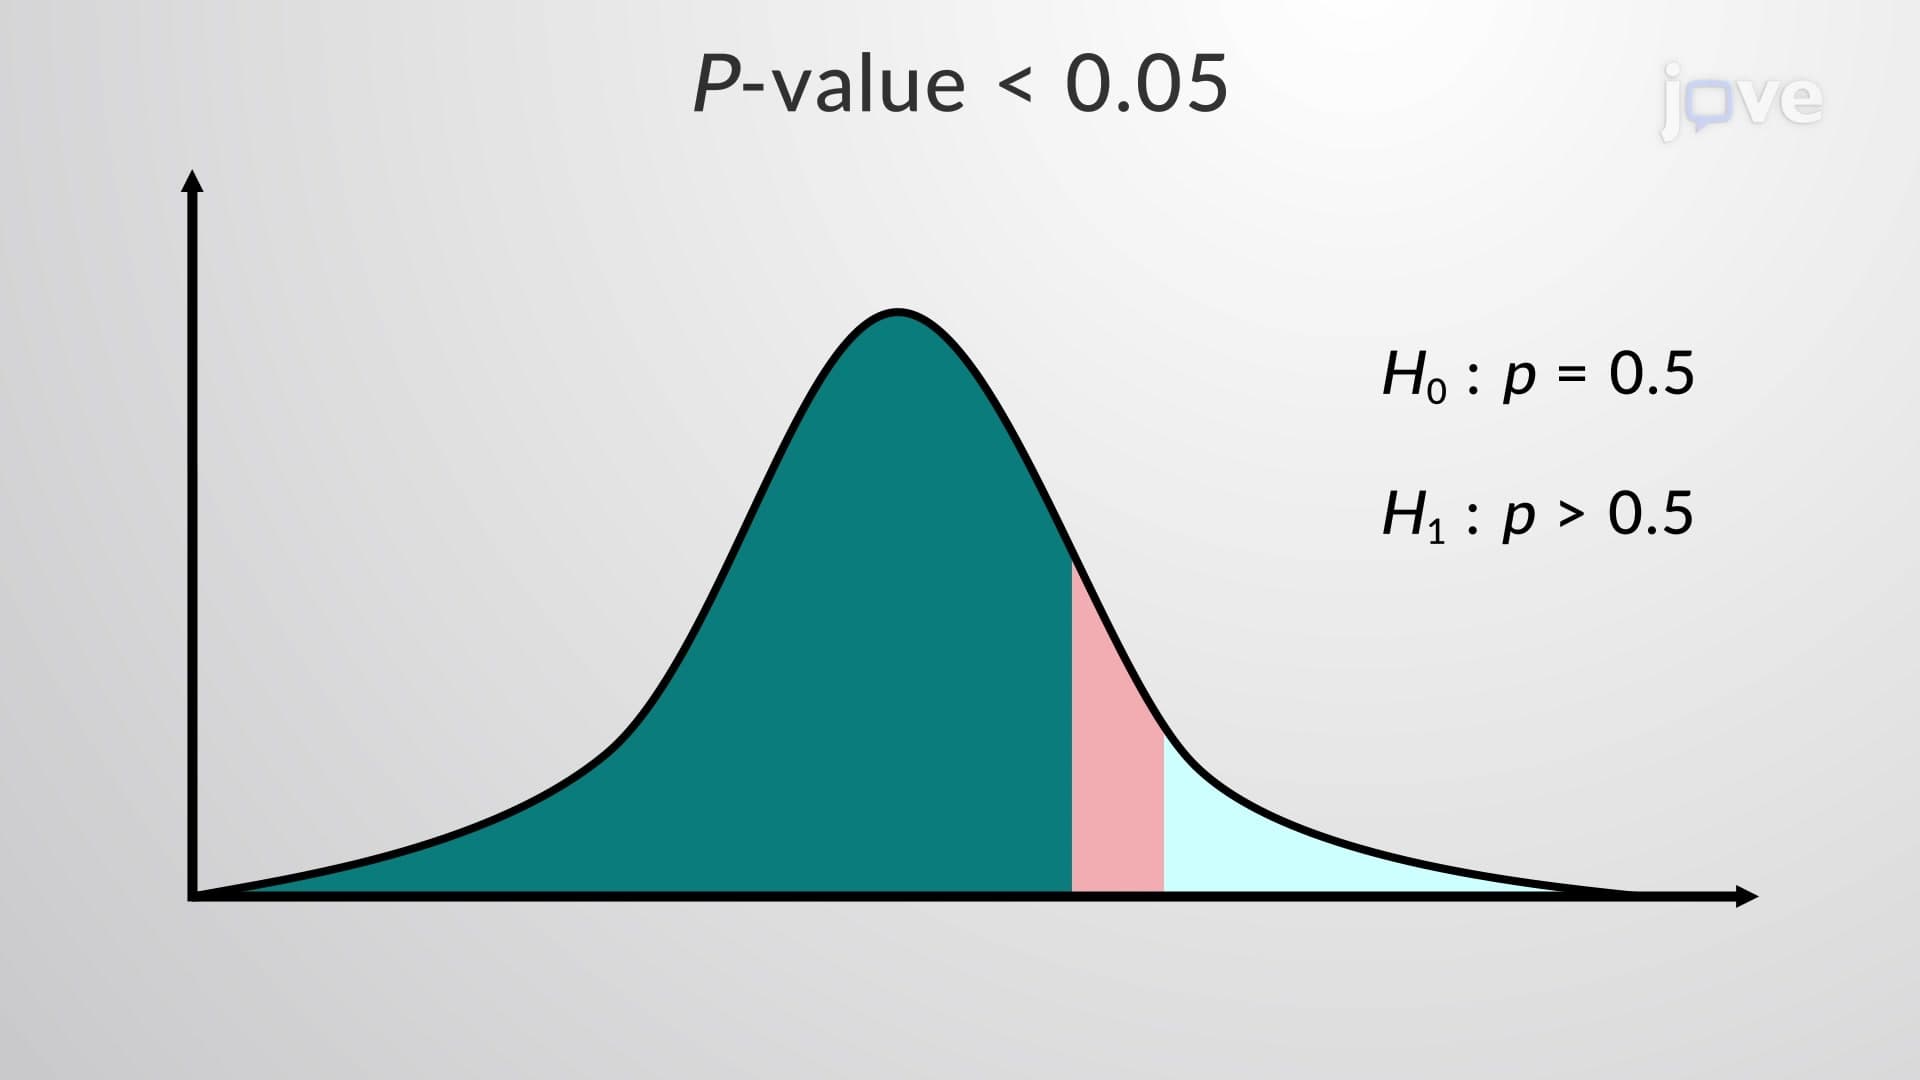
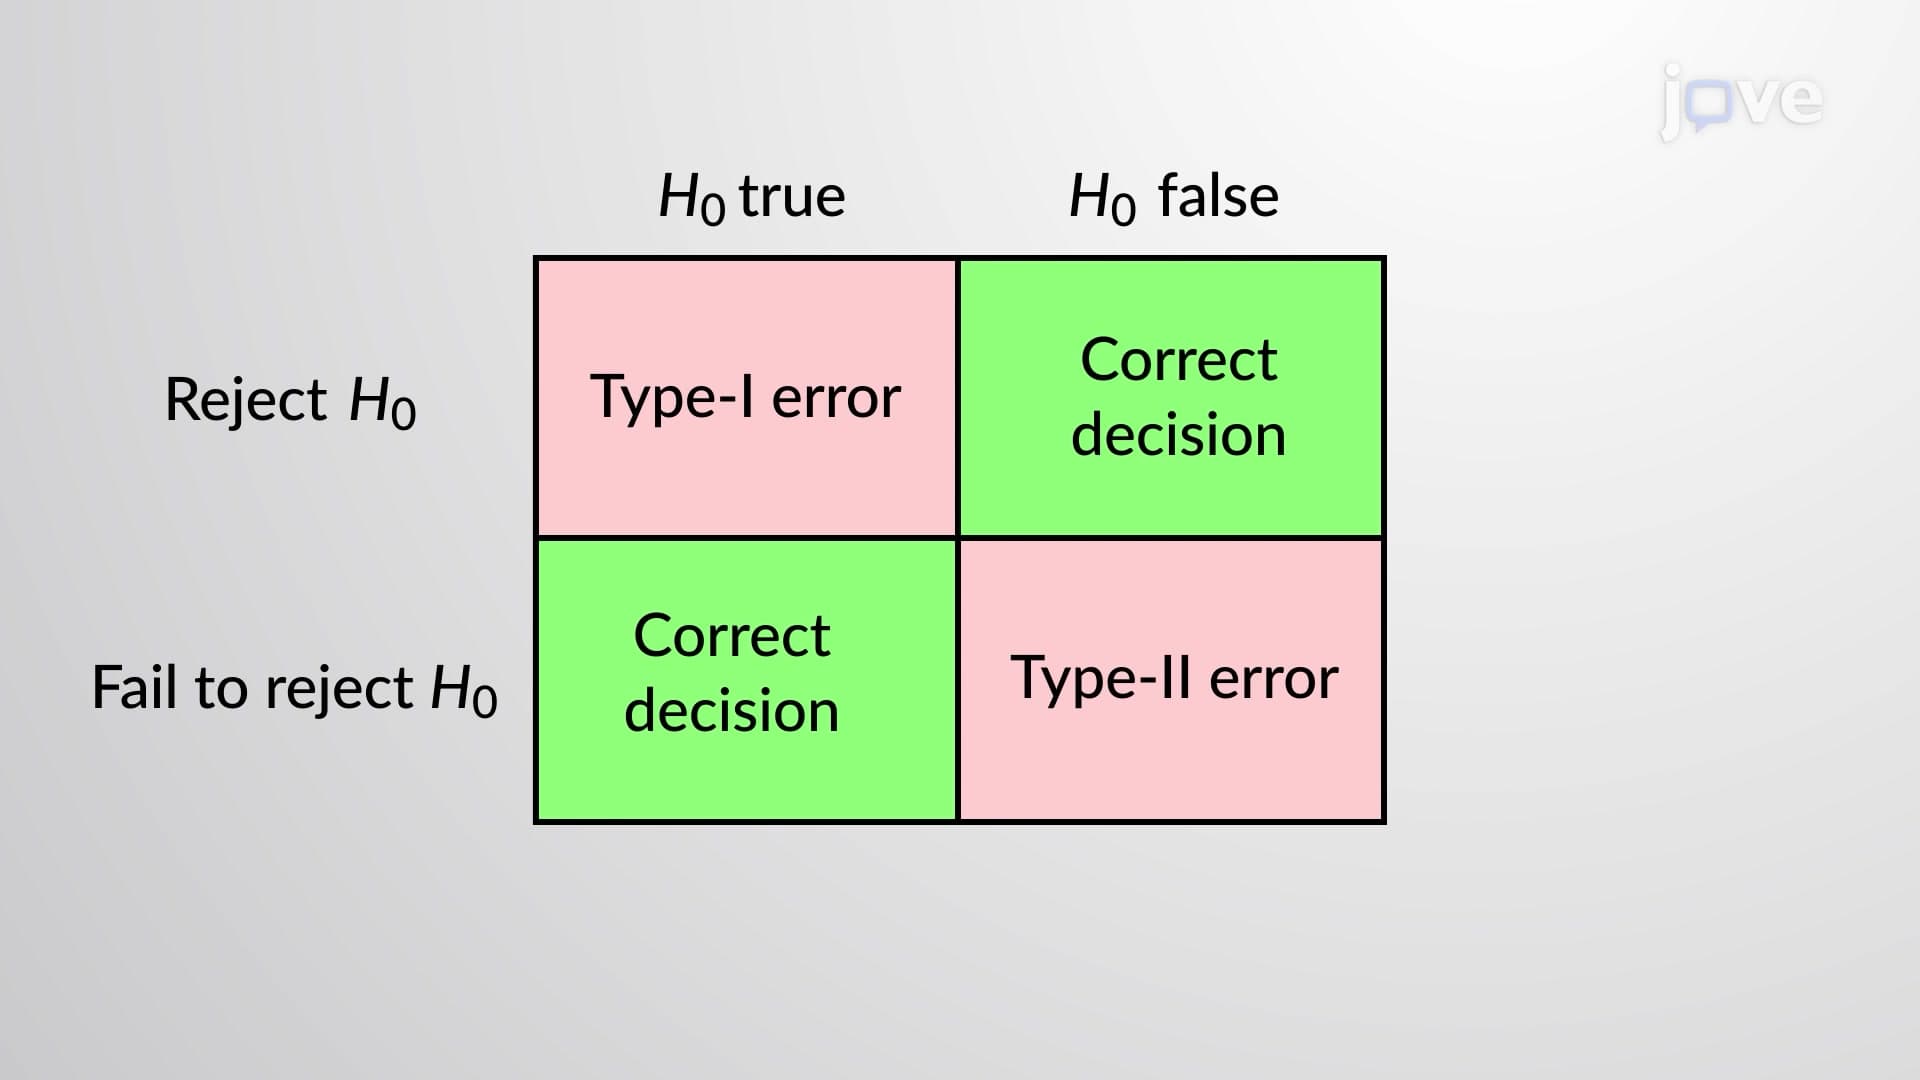
The process begins with establishing two competing hypotheses. The null hypothesis (H₀) typically represents the status quo or a claim of no effect, while the alternative hypothesis (H₁ or Hₐ) represents the researcher's theory or the claim being tested. In the guppy example, the null hypothesis stated that females show no preference (50% choose orange, 50% choose blue), while the alternative claimed that more than 50% prefer orange males.
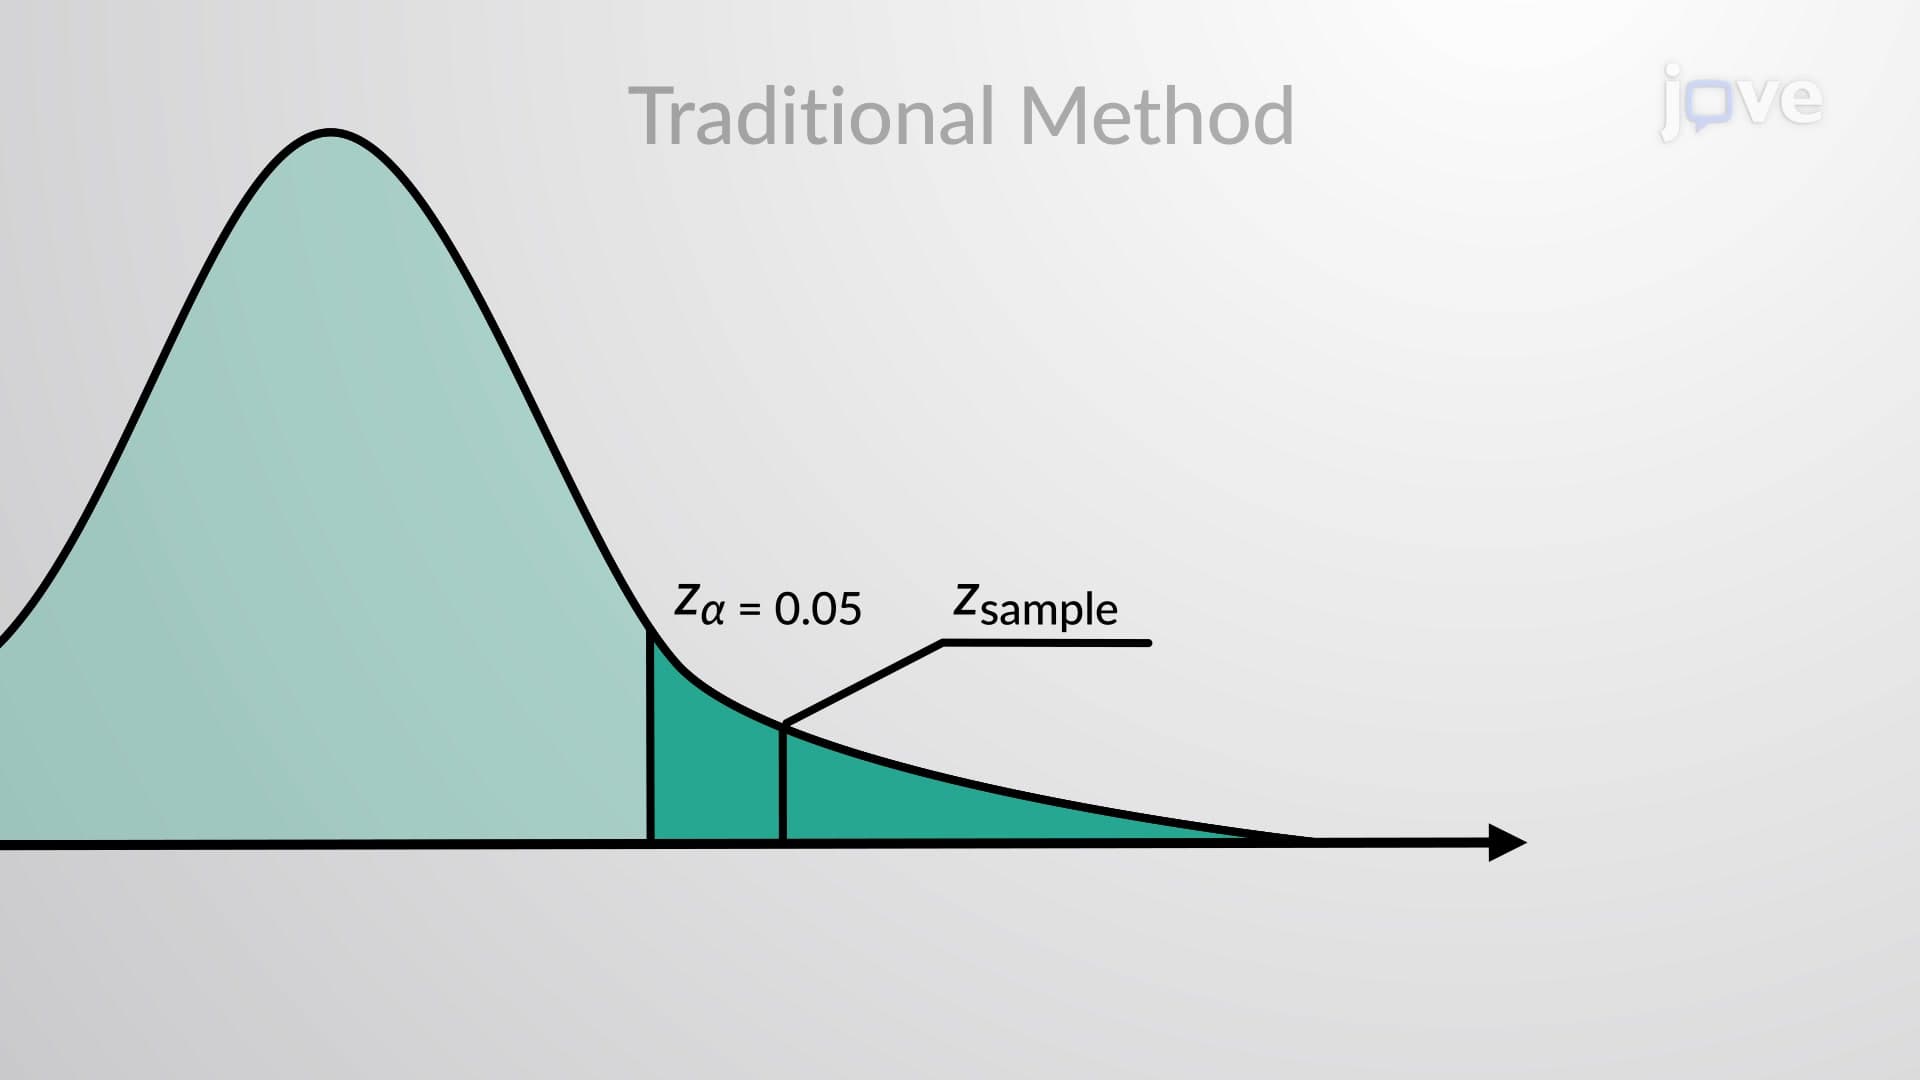
The mathematical foundation involves converting sample proportions into standardized test statistics, typically using the z-statistic formula. When the sample proportion significantly differs from the hypothesized population proportion, the calculated z-value will fall outside the acceptance region, leading to rejection of the null hypothesis.
For proportion testing, the test statistic follows the formula: z = (p̂ - p₀) / √(p₀(1-p₀)/n), where p̂ represents the sample proportion, p₀ is the hypothesized proportion, and n is the sample size. In the guppy study, with 10 out of 12 females choosing orange males, p̂ = 0.83, creating a z-statistic that fell within the critical region at α = 0.05.
This statistical technique appears frequently on AP Statistics exams, college statistics courses, and standardized tests like the MCAT. US pharmaceutical companies use proportion testing to demonstrate drug efficacy-for instance, testing whether a new vaccine prevents infection in more than 90% of recipients, compared to existing treatments.
In quality control scenarios, manufacturers might test claims about defect rates. If a company claims their product has a defect rate below 2%, statisticians can collect samples and use proportion testing to verify this assertion. The FDA regularly employs these methods when evaluating safety claims for medical devices and medications.
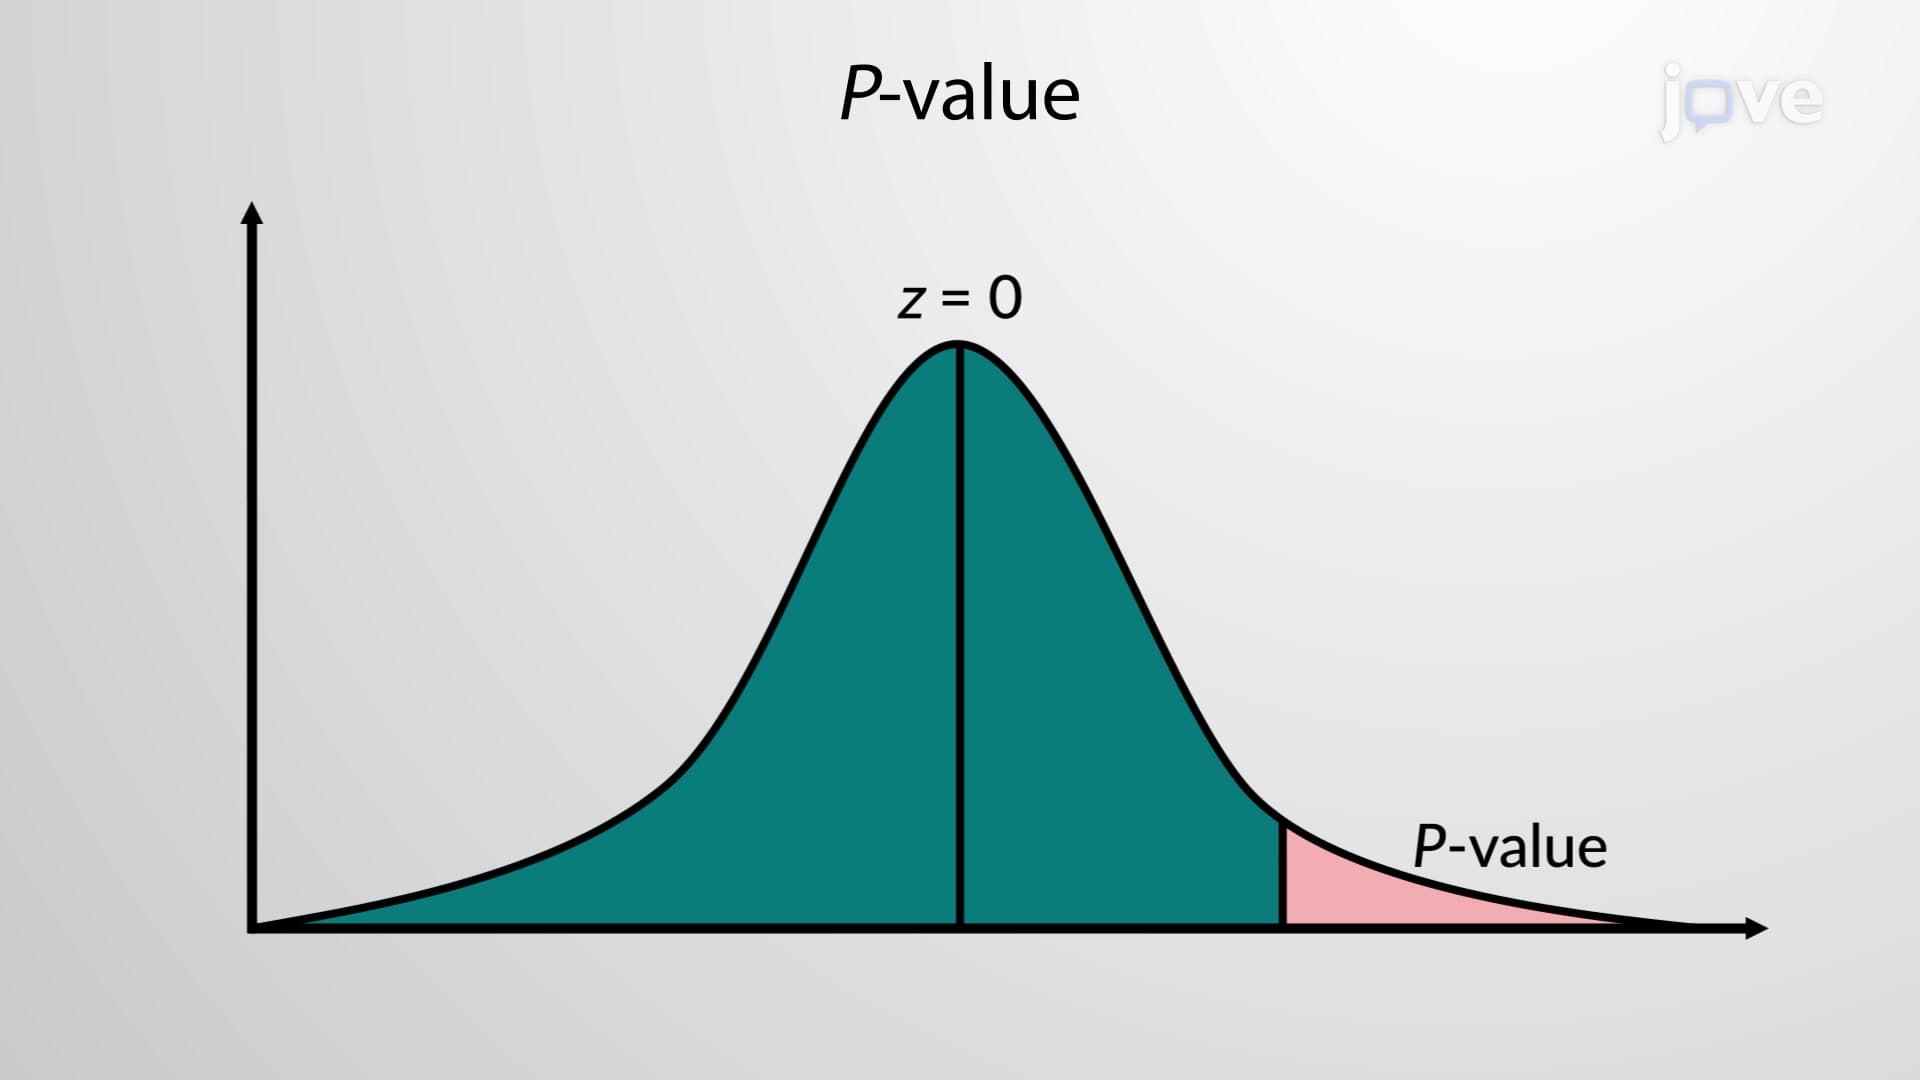
The p-value represents the probability of observing the sample result (or something more extreme) if the null hypothesis were true. A p-value of 0.011, as found in the guppy experiment, indicates strong evidence against the null hypothesis, suggesting the observed preference didn't occur by random chance. This statistical significance provides confidence that the aquarium guppies genuinely exhibit the same mating preferences as their wild counterparts.
Related Micro-courses