Loading video…


 13 Concepts
 130.6K views

Video Summary: Hypothesis Testing for a Mean with Unknown Population Standard Deviation
Did you know that biologists studying lizard behavior face the same statistical challenge as pharmaceutical researchers testing new drugs? Hypothesis testing for a mean with unknown population standard deviation becomes essential when we can't measure every individual in a population. Consider how the FDA evaluates medication effectiveness using small patient samples without knowing the entire population's response variability. This statistical method uses the t-distribution to make reliable conclusions from limited data, whether analyzing animal behavior patterns or clinical trial results. Watch the full video on JoVE Coach to master this concept with expert-led visuals and step-by-step explanations.
When researchers cannot access entire populations or determine true population standard deviations, hypothesis testing for a mean with unknown population standard deviation becomes the statistical method of choice. This approach differs fundamentally from z-tests because it acknowledges the uncertainty inherent in estimating population parameters from sample data.
The t-distribution, developed by William Sealy Gosset in 1908, accounts for the additional variability introduced when using sample standard deviation as an estimate for the unknown population standard deviation. As sample sizes increase, the t-distribution approaches the standard normal distribution, but with smaller samples, it exhibits heavier tails, reflecting greater uncertainty.
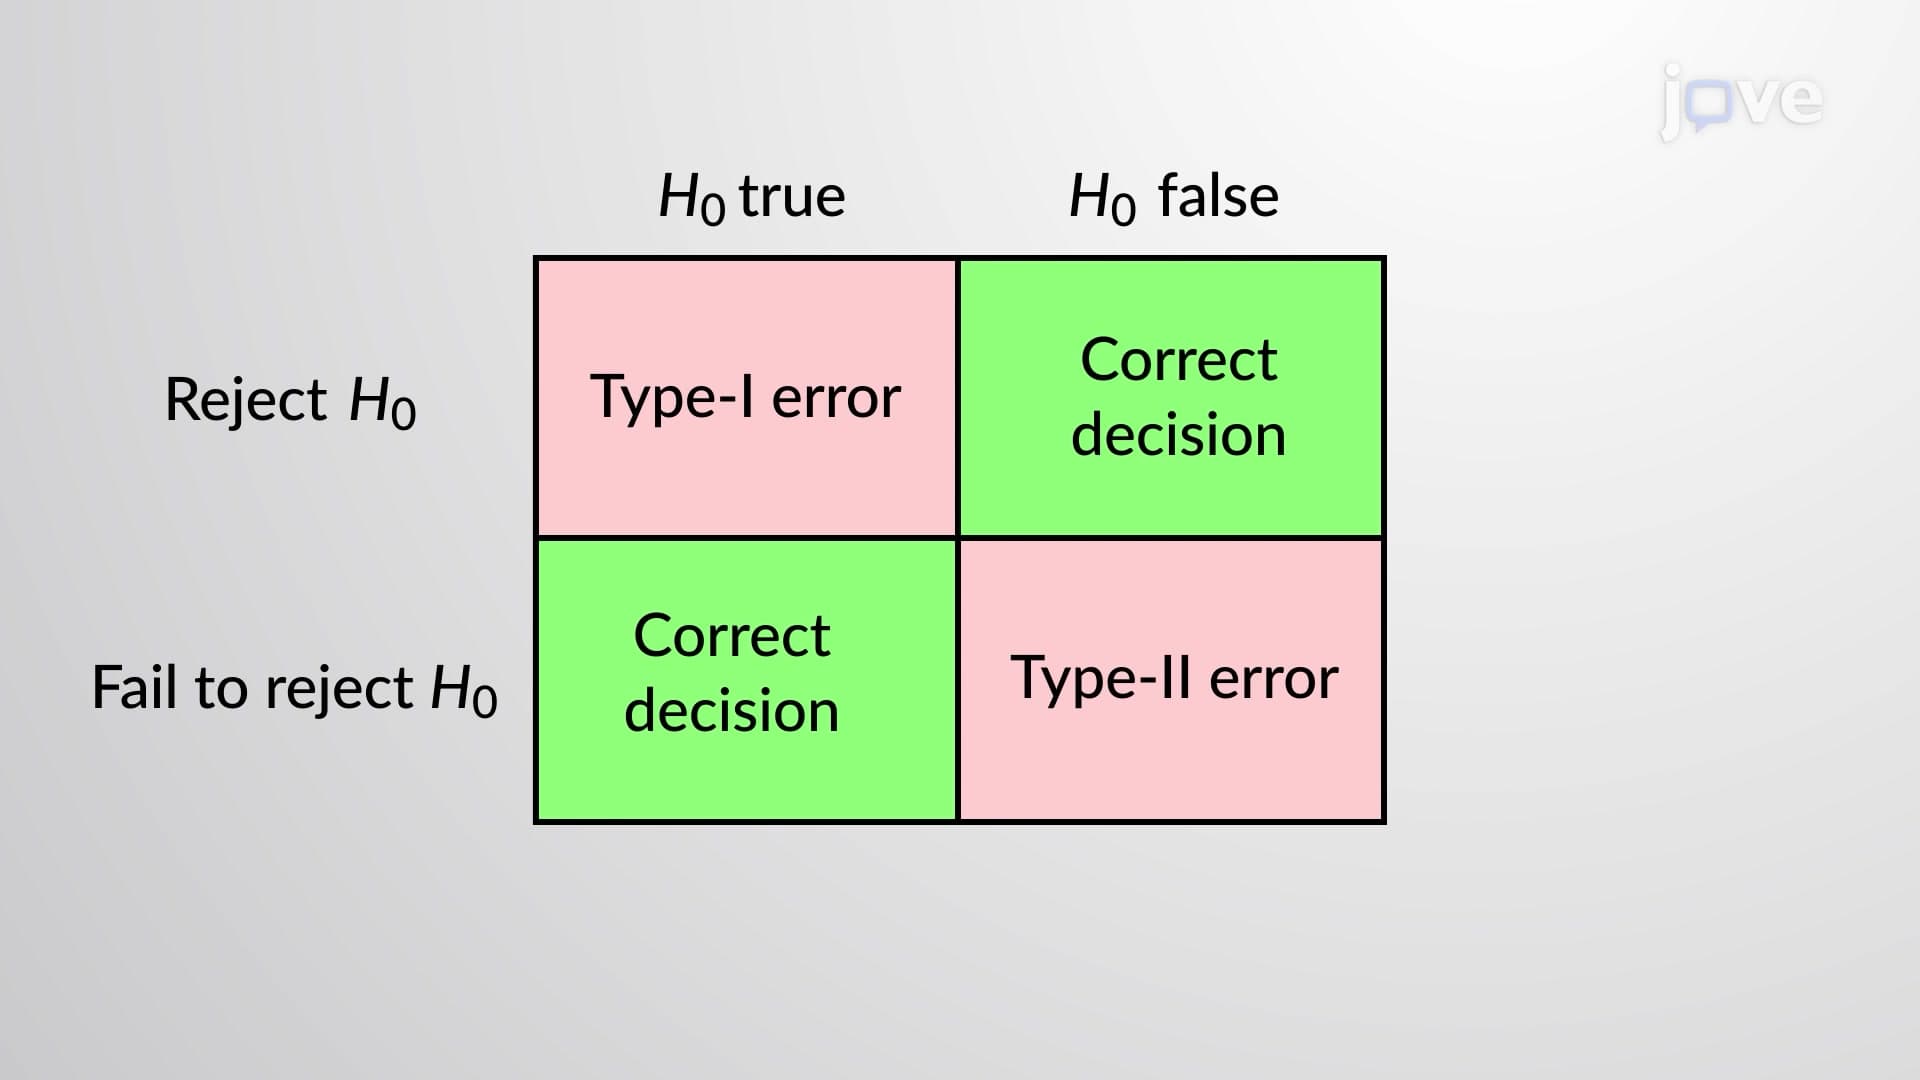
The hypothesis testing process begins with establishing null and alternative hypotheses. The null hypothesis (H₀) typically states no difference or effect, while the alternative hypothesis (H₁) represents the research claim. For instance, when testing whether a new teaching method improves standardized test scores, H₀ might state the mean score equals the historical average, while H₁ claims the mean exceeds this value.
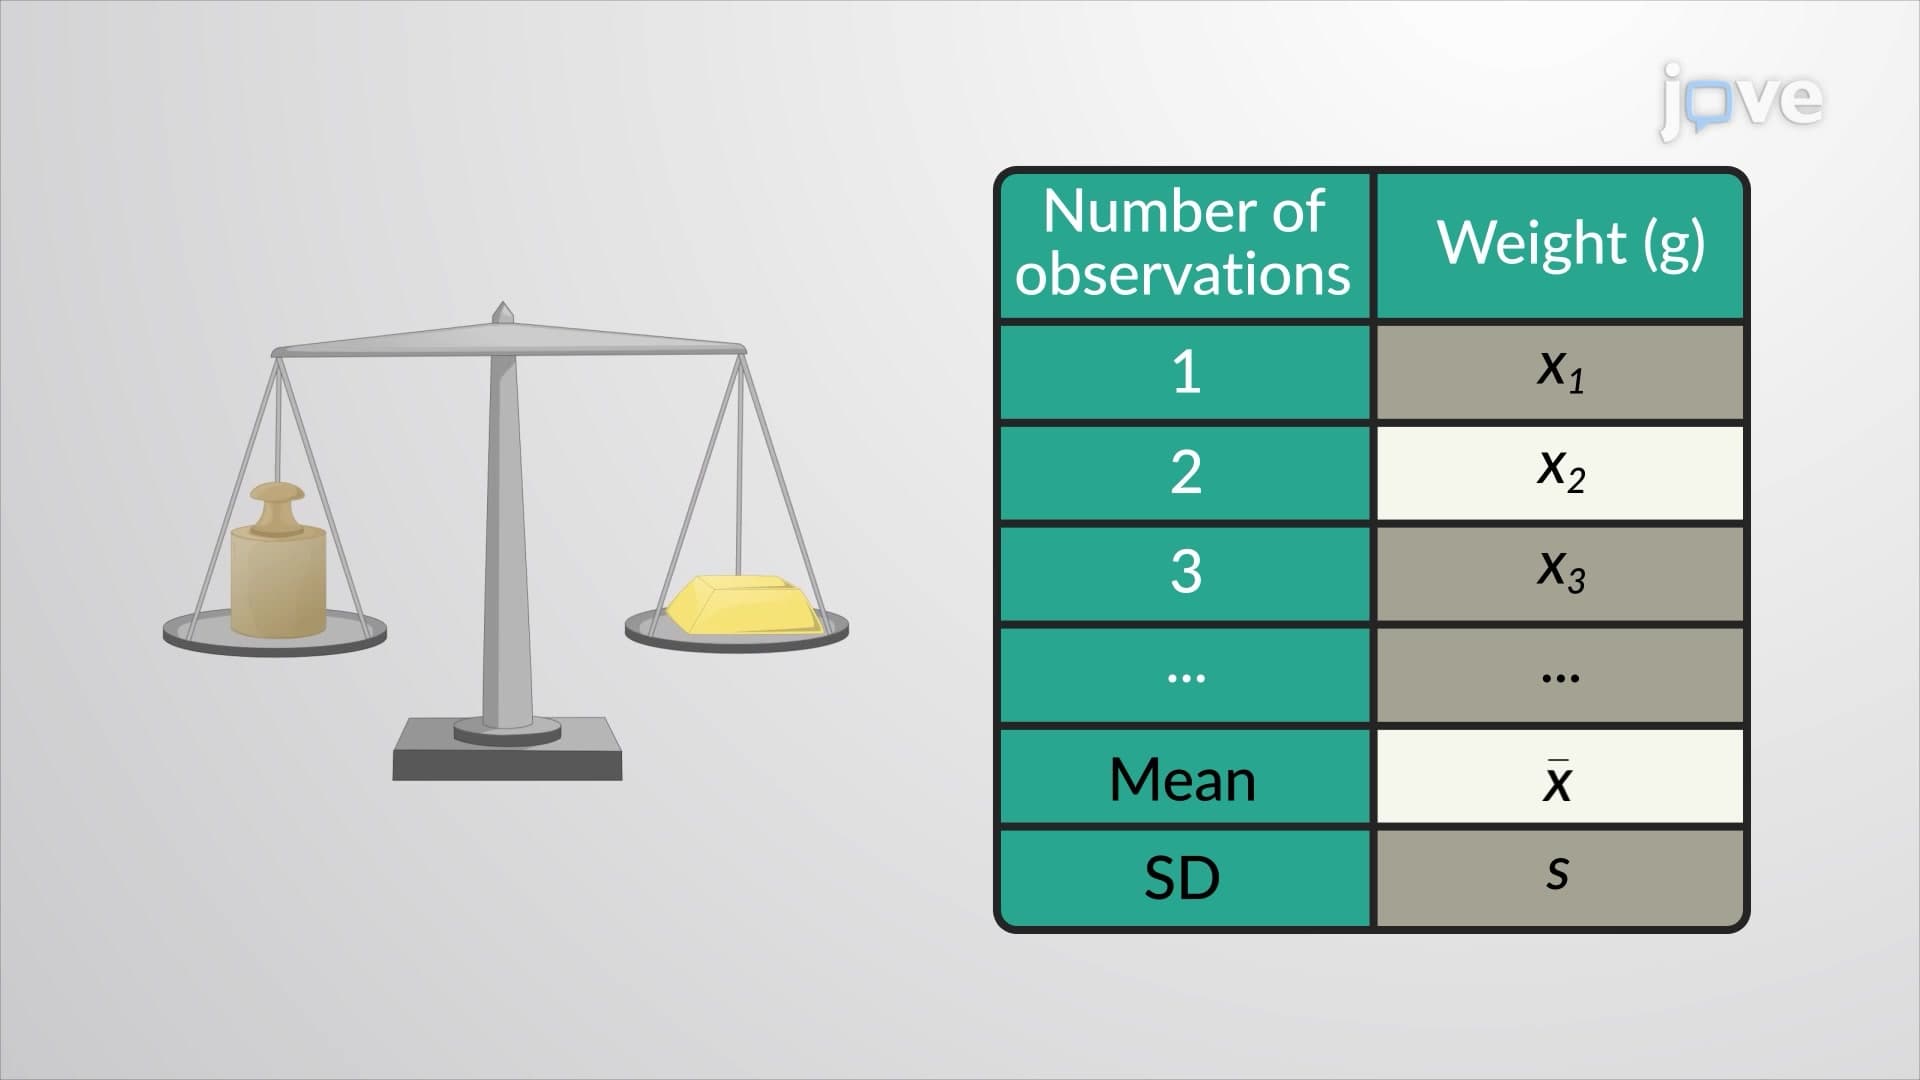
The test statistic follows the formula: t = (x̄ - μ₀) / (s / √n), where x̄ represents the sample mean, μ₀ is the hypothesized population mean, s is the sample standard deviation, and n is the sample size. This statistic follows a t-distribution with (n-1) degrees of freedom.
This statistical method appears frequently in AP Statistics courses, college-level statistics classes, and professional research. Medical researchers use t-tests when evaluating treatment effectiveness with limited patient samples. For example, pharmaceutical companies testing a new blood pressure medication might collect data from 50 patients, compare their average blood pressure reduction to a hypothesized value, and use t-testing to determine statistical significance.
In educational research, administrators might test whether a new curriculum affects student performance by comparing sample means to established benchmarks. Environmental scientists studying pollution levels, psychologists examining therapy effectiveness, and economists analyzing market trends all rely on this method when population parameters remain unknown.
Students preparing for AP Statistics, college statistics courses, or graduate school entrance exams should master several key concepts. Understanding when to use t-tests versus z-tests is crucial-t-tests apply when population standard deviation is unknown, regardless of sample size. However, the Central Limit Theorem ensures that with large samples (typically n ≥ 30), results approximate those from z-tests.
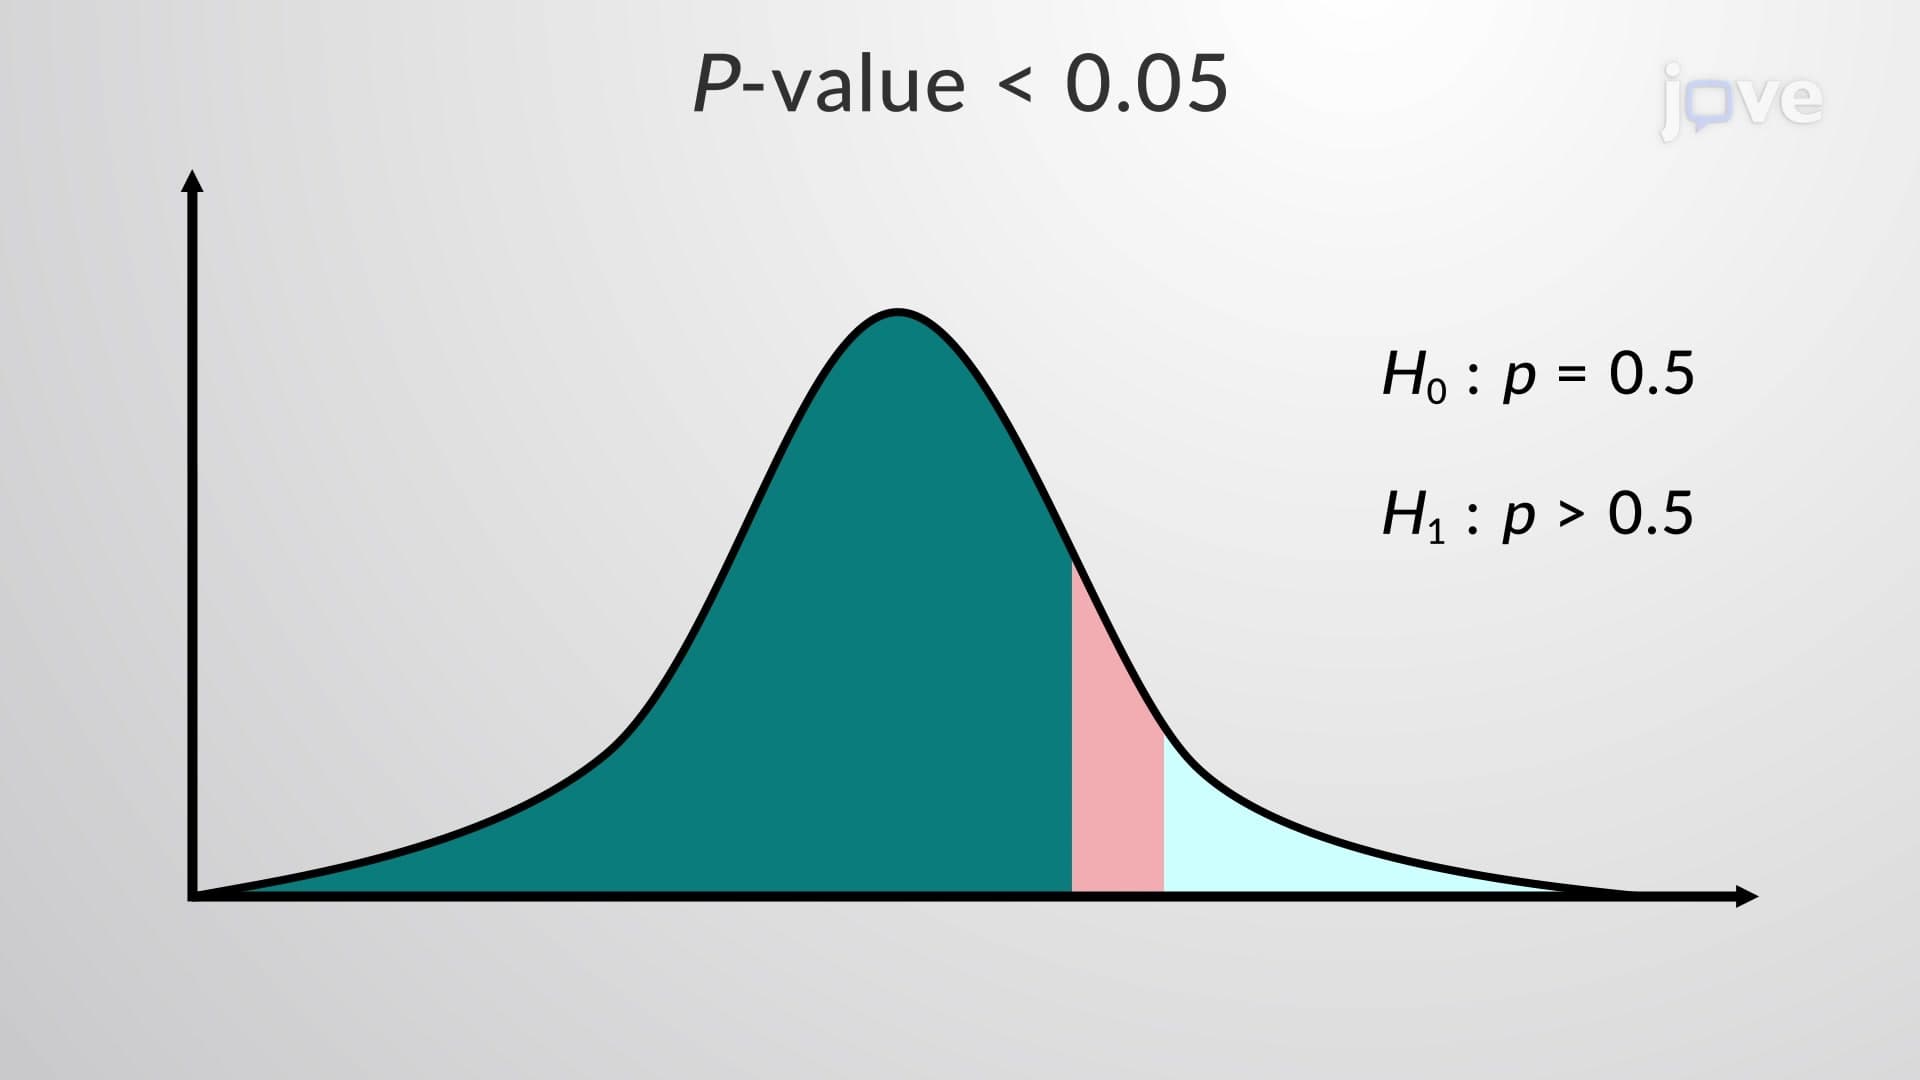
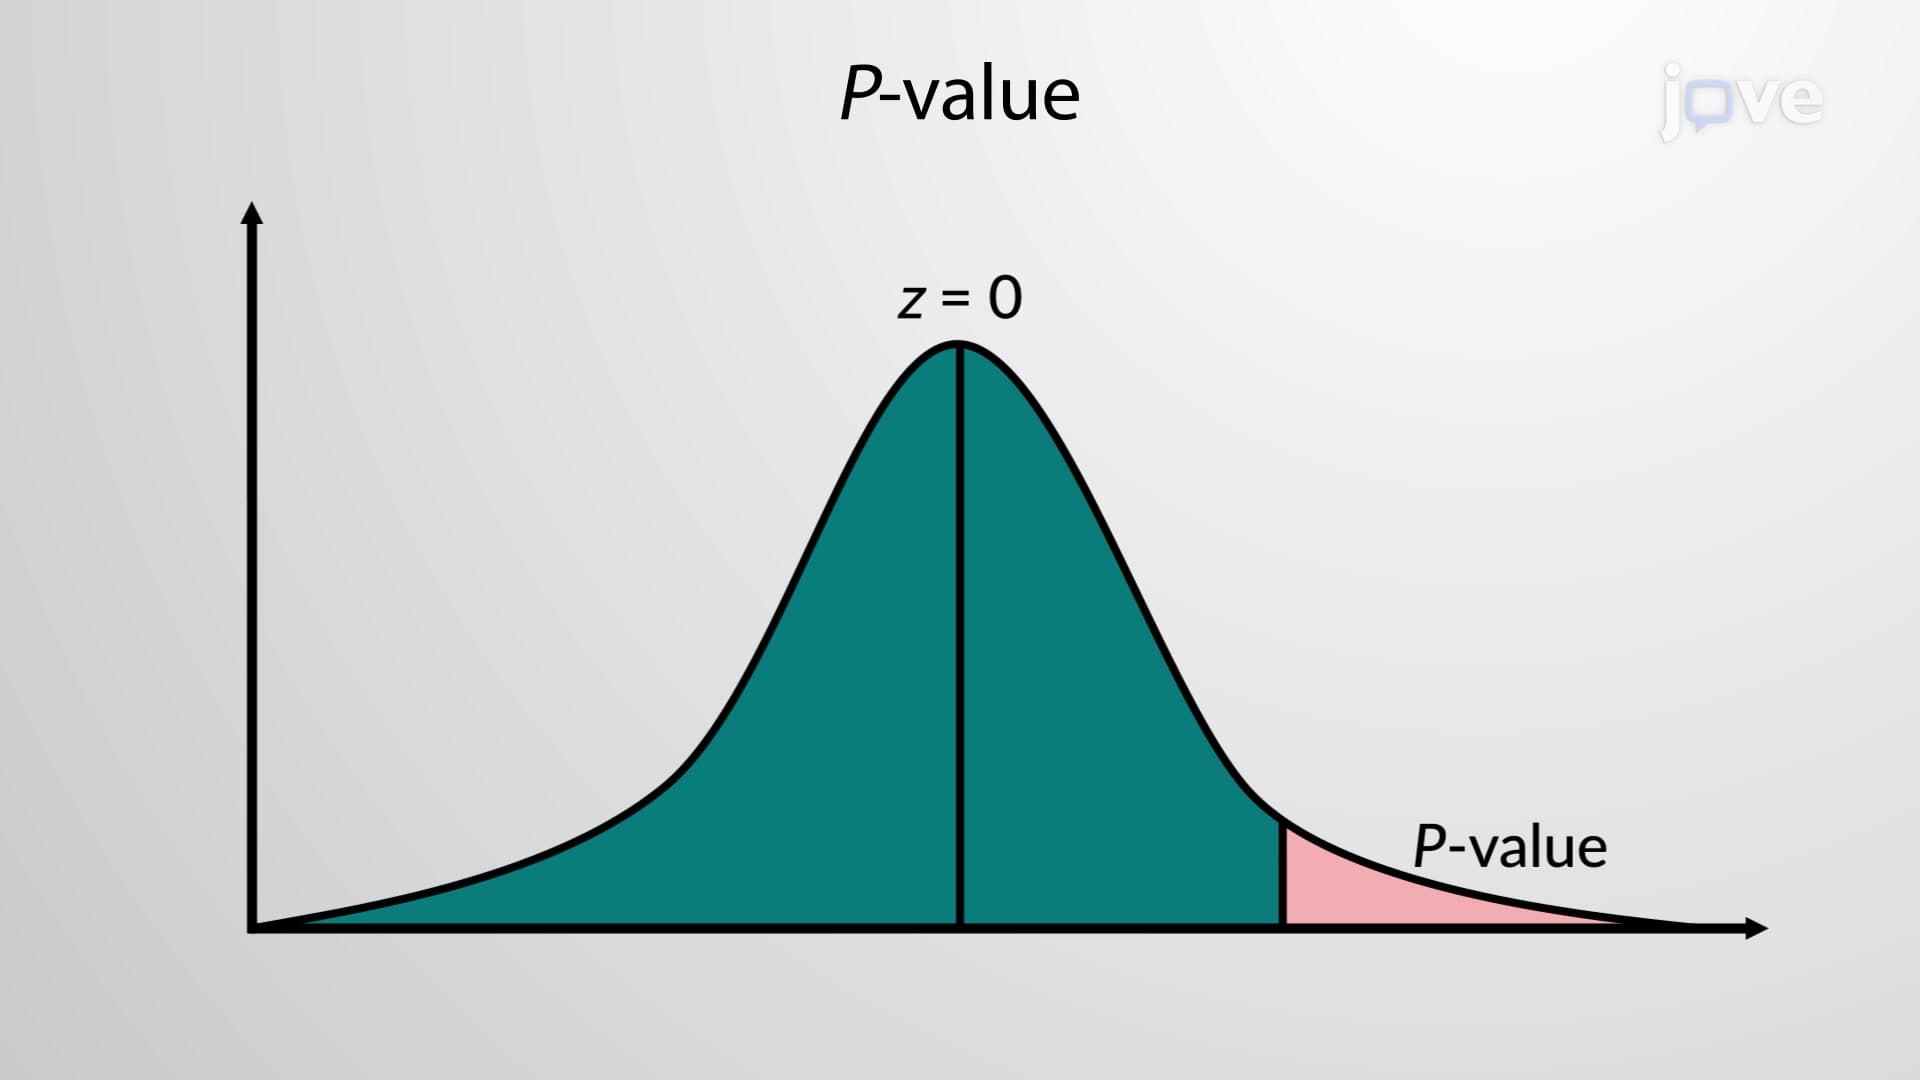
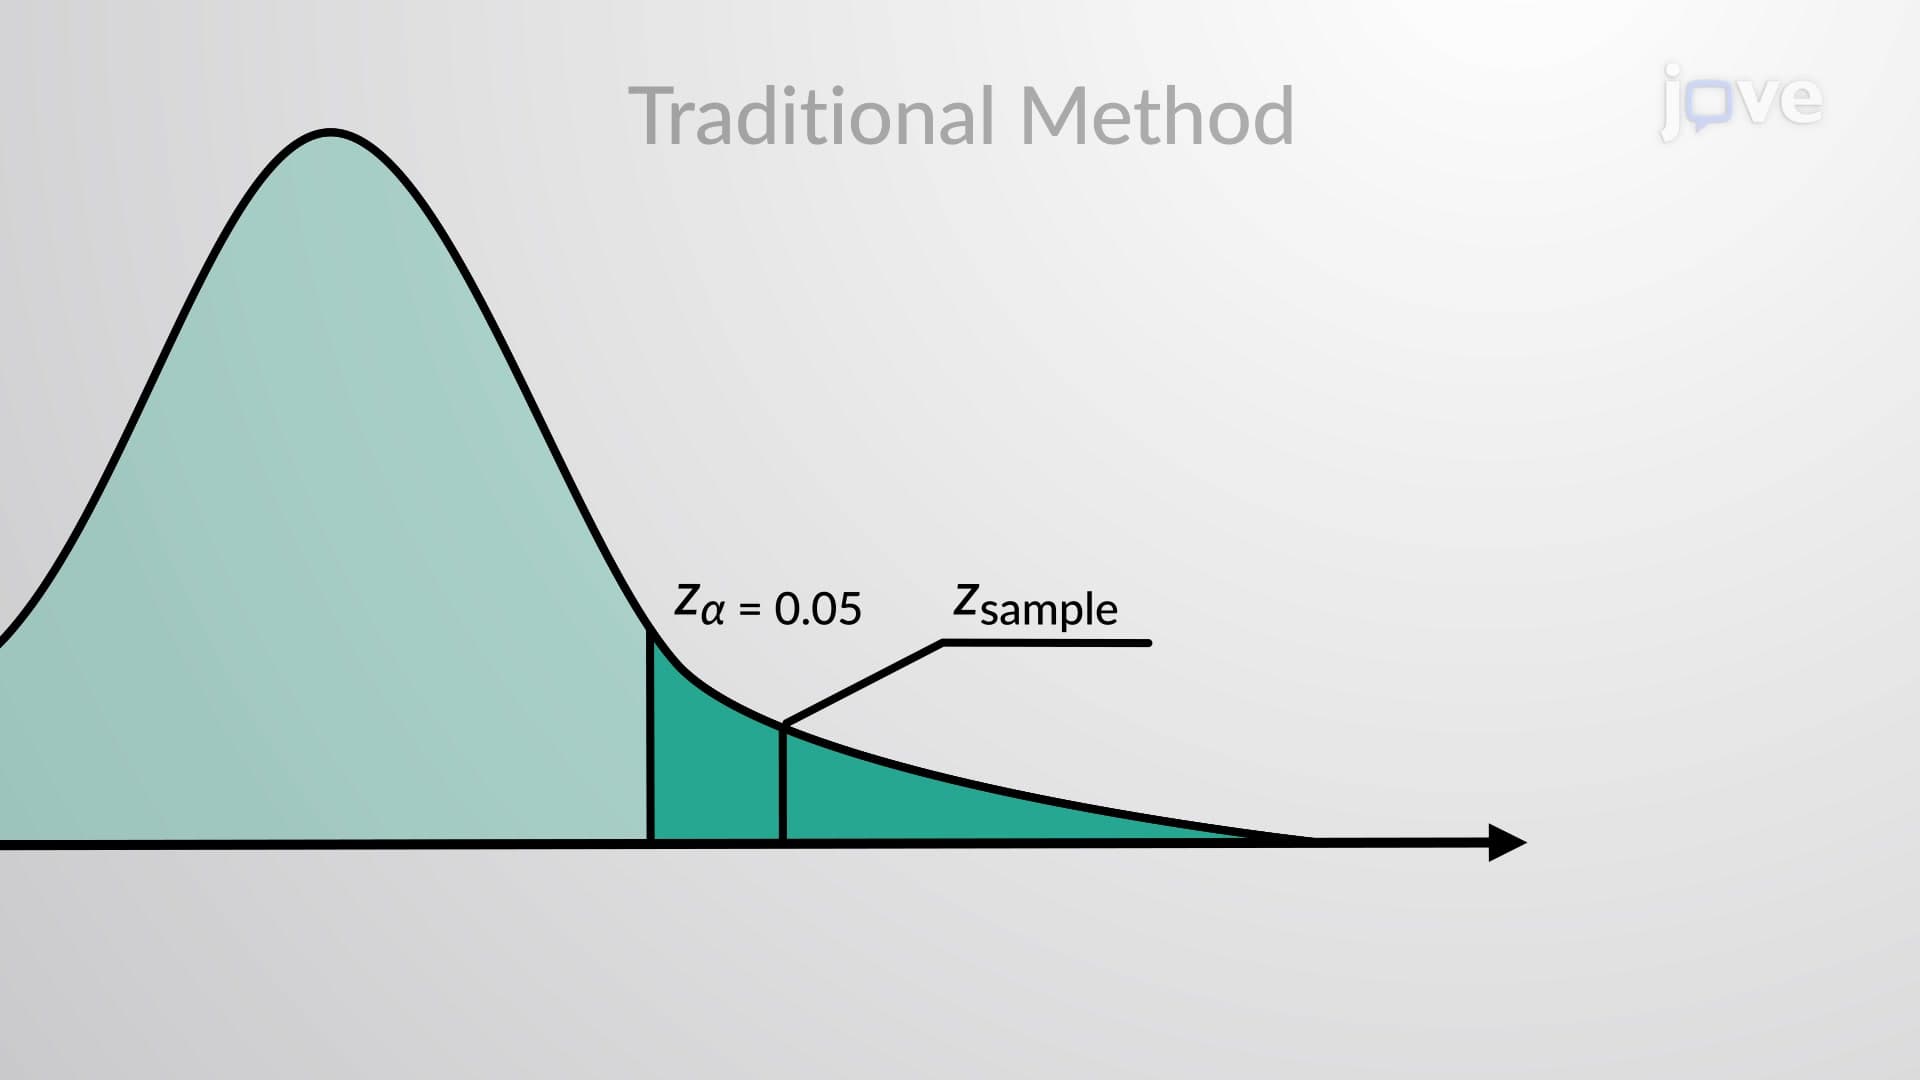
Critical value determination depends on significance level (α), degrees of freedom, and whether conducting one-tailed or two-tailed tests. P-value interpretation remains consistent across statistical tests: values below the significance level support rejecting the null hypothesis.
Related Micro-courses