Loading video…

 13 Concepts
 130.6K views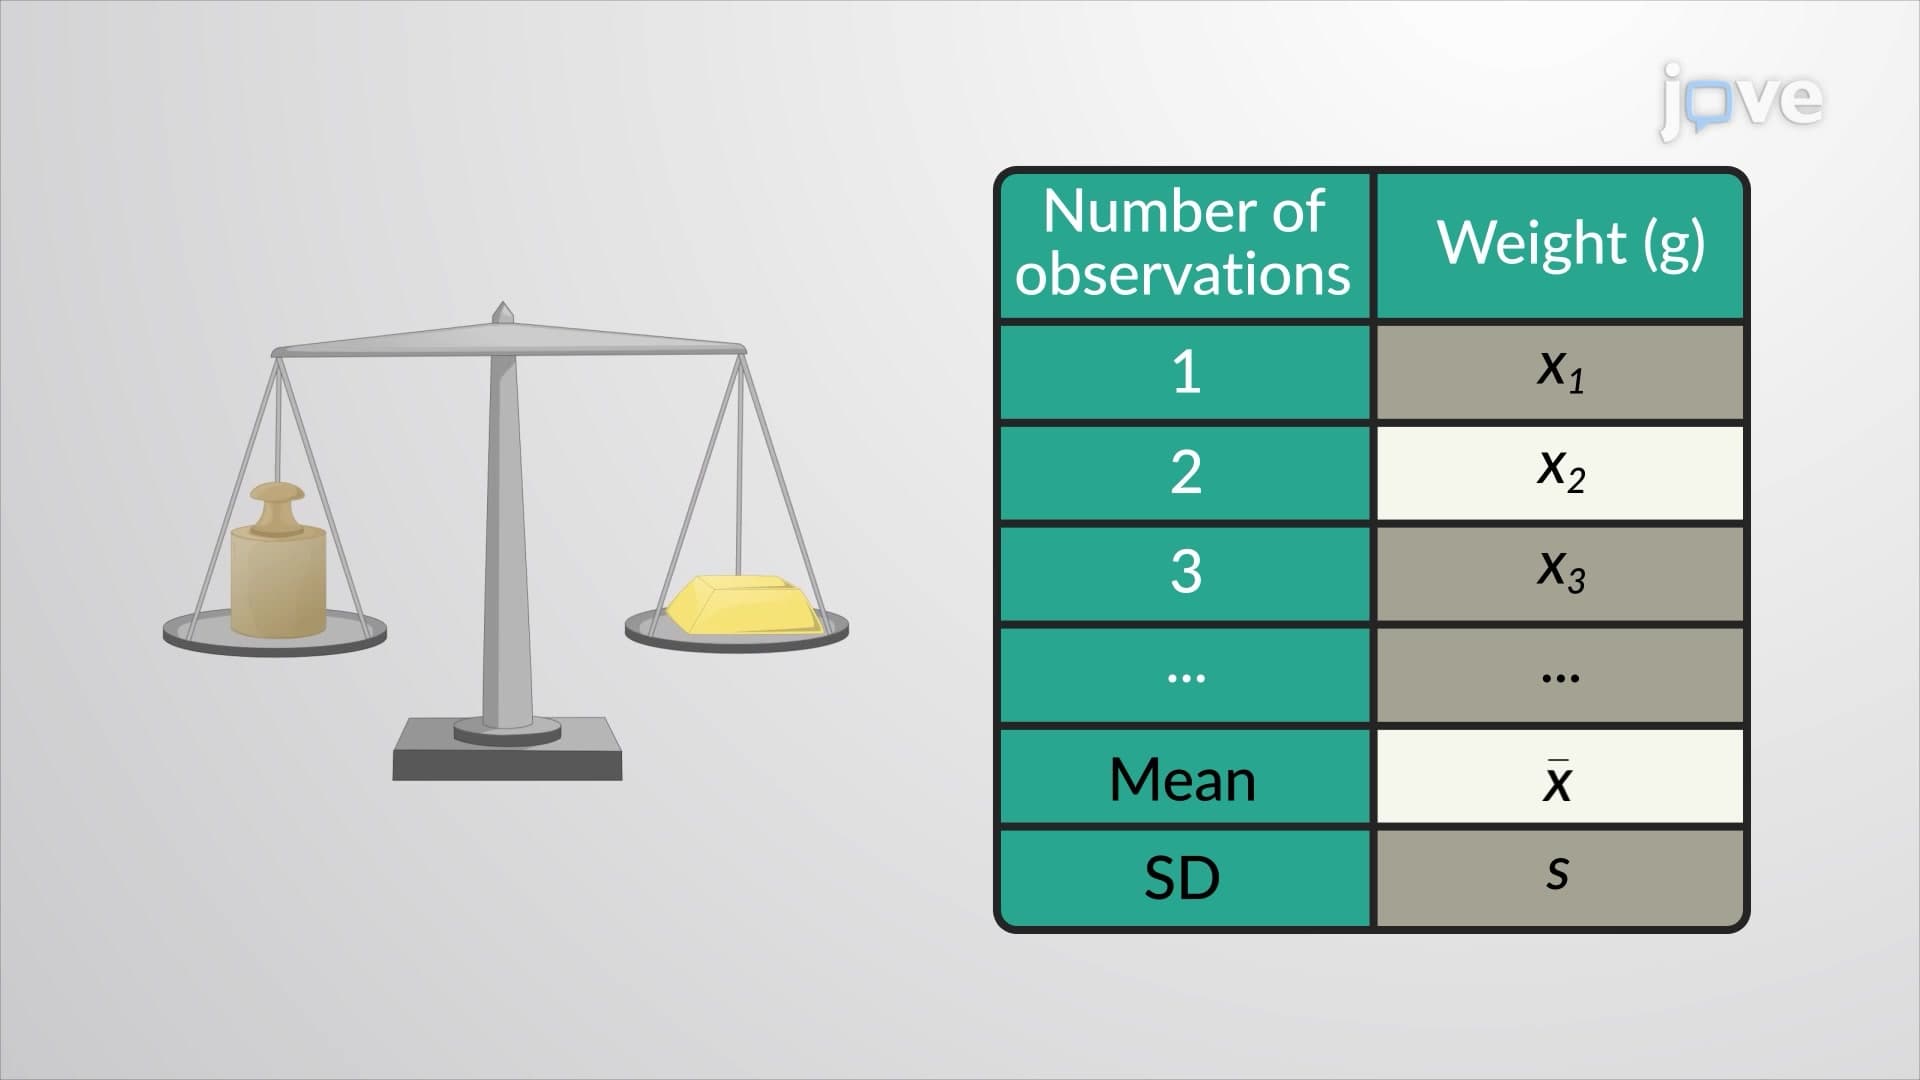

Video Summary: Testing a Claim About Standard Deviation Explained
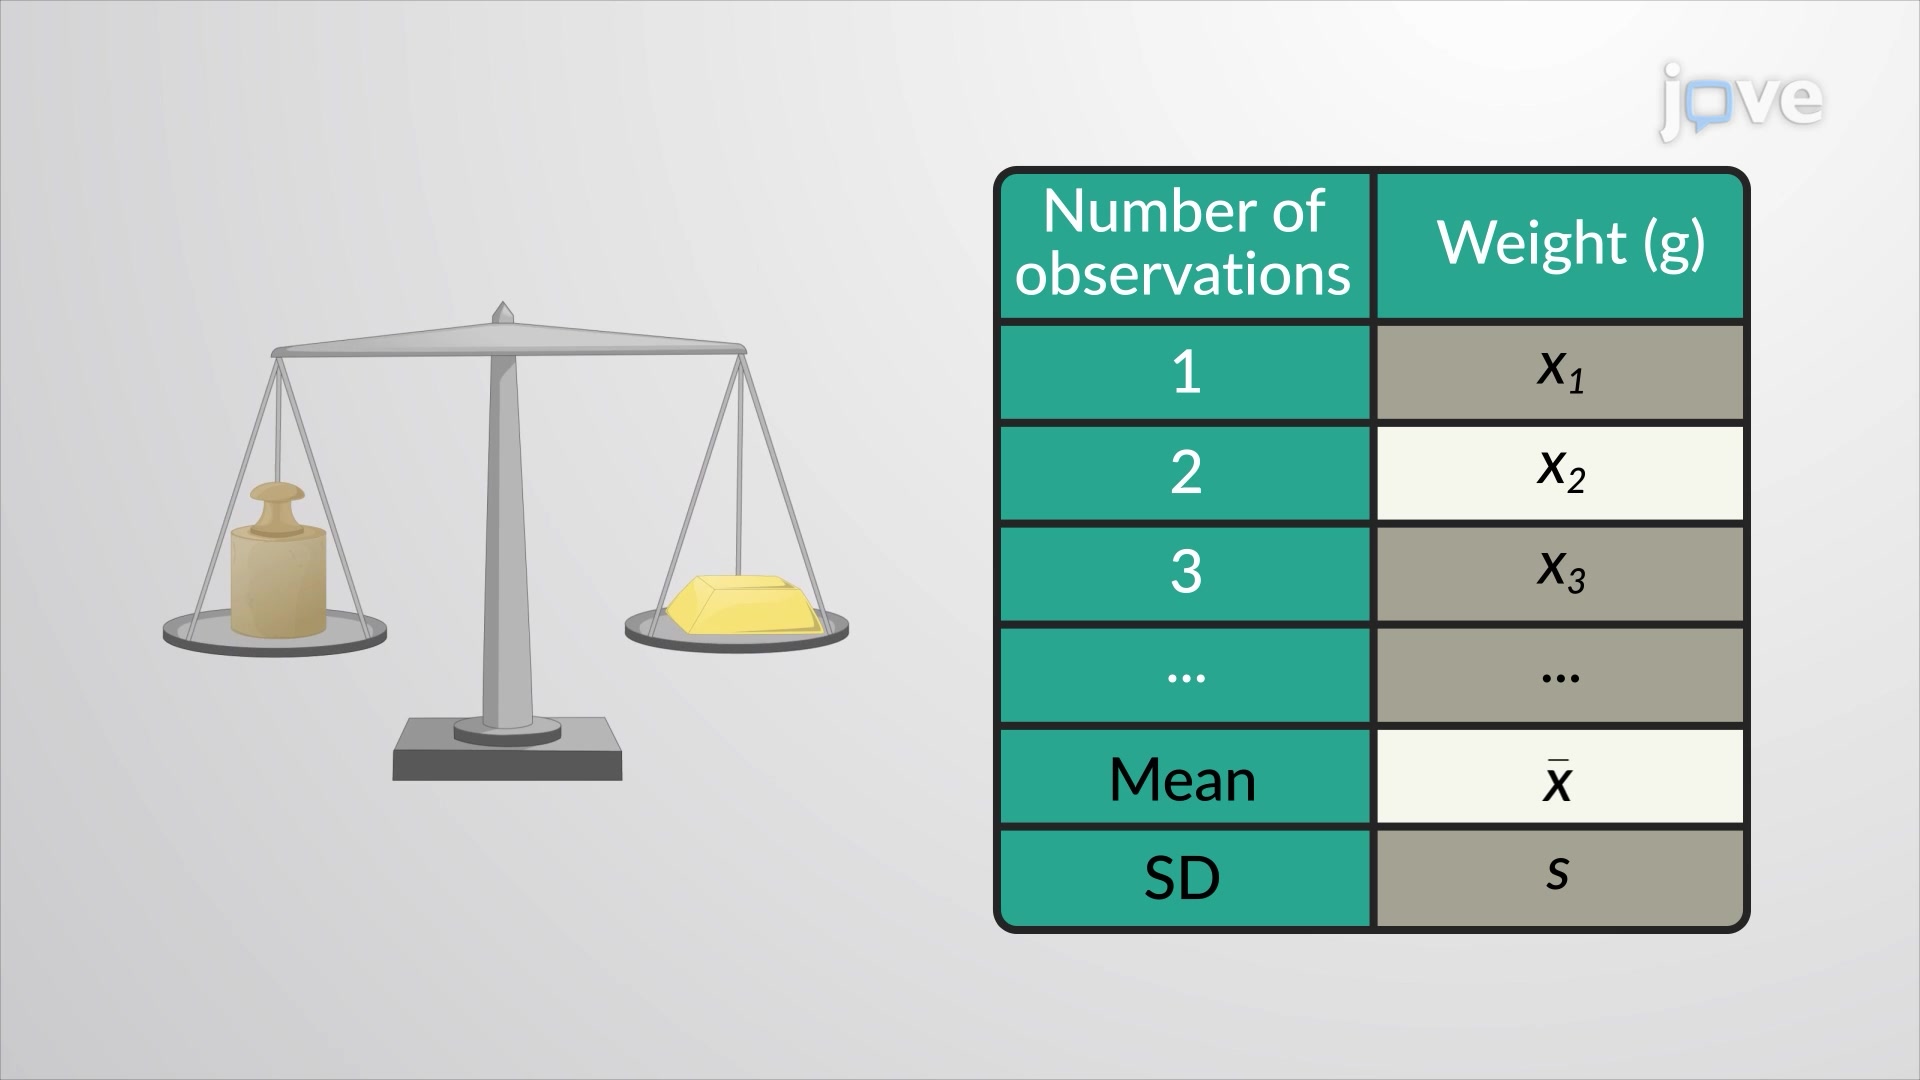
Did you know that weighing gold at jewelry stores requires precision within thousandths of a gram? Testing a claim about standard deviation becomes critical when manufacturers like Ohaus or Mettler Toledo claim their new digital scales are more accurate than previous models. For instance, when a scale company asserts they've reduced measurement variability from 0.005g to 0.003g, hypothesis testing using chi-square statistics determines if this improvement is statistically significant. This process, known as Testing A Claim About Standard Deviation Explained, involves comparing sample data against established benchmarks. Watch the full video on JoVE Coach to master this concept with expert-led visuals and step-by-step explanations.
Testing a claim about standard deviation represents a crucial statistical procedure used to determine whether observed changes in data variability are statistically significant or merely due to random chance. Unlike testing claims about means, which typically employ t-tests or z-tests, standard deviation claims require the chi-square distribution due to the mathematical properties of variance estimation.
When testing a claim about standard deviation, statisticians convert sample variance into a chi-square test statistic using the formula: χ² = (n-1)s²/σ², where n represents sample size, s² is sample variance, and σ² is the claimed population variance. This transformation allows researchers to compare observed variability against theoretical expectations using established probability distributions.
The degrees of freedom equal n-1, reflecting the constraint that sample variance calculations lose one degree of freedom. For the gold scale example, with 30 units tested, degrees of freedom equal 29, determining the appropriate chi-square distribution shape and critical values.
Manufacturing industries extensively use testing a claim about standard deviation for quality control processes. Pharmaceutical companies like Pfizer and Johnson & Johnson employ these methods to ensure medication dosages maintain consistent potency within FDA-approved tolerances. Similarly, automotive manufacturers such as Ford and General Motors test component specifications to verify production improvements actually reduce variability in part dimensions.
In academic settings, this concept appears prominently in AP Statistics curricula, college-level introductory statistics courses, and advanced placement examinations. Students typically encounter these problems in hypothesis testing units, often following normal distribution and t-test topics. The concept bridges theoretical statistical knowledge with practical quality assurance applications.
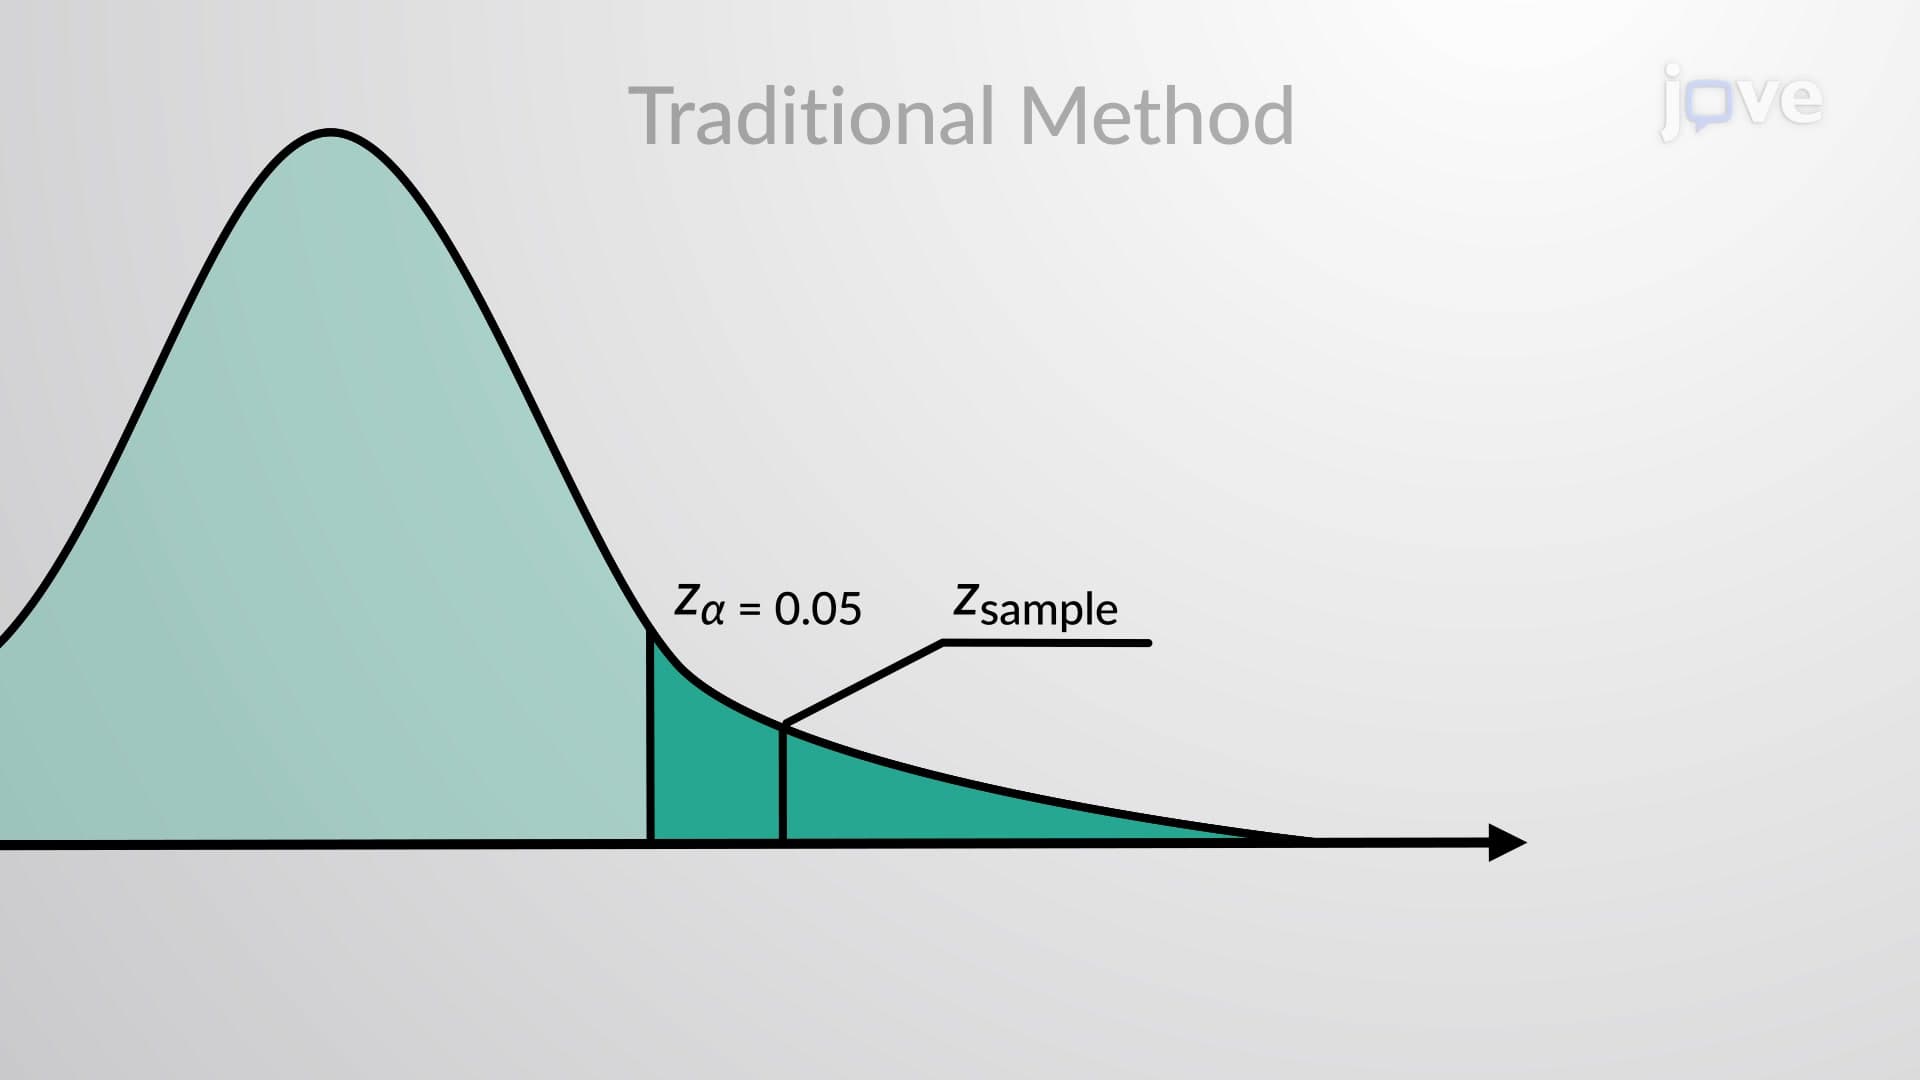
How testing a claim about standard deviation works depends heavily on identifying appropriate critical regions. Left-tailed tests examine claims of reduced variability, right-tailed tests investigate increased variability claims, and two-tailed tests address any significant change in standard deviation. The significance level (commonly α = 0.05) determines critical value boundaries, with calculated test statistics falling within rejection regions indicating statistical significance.
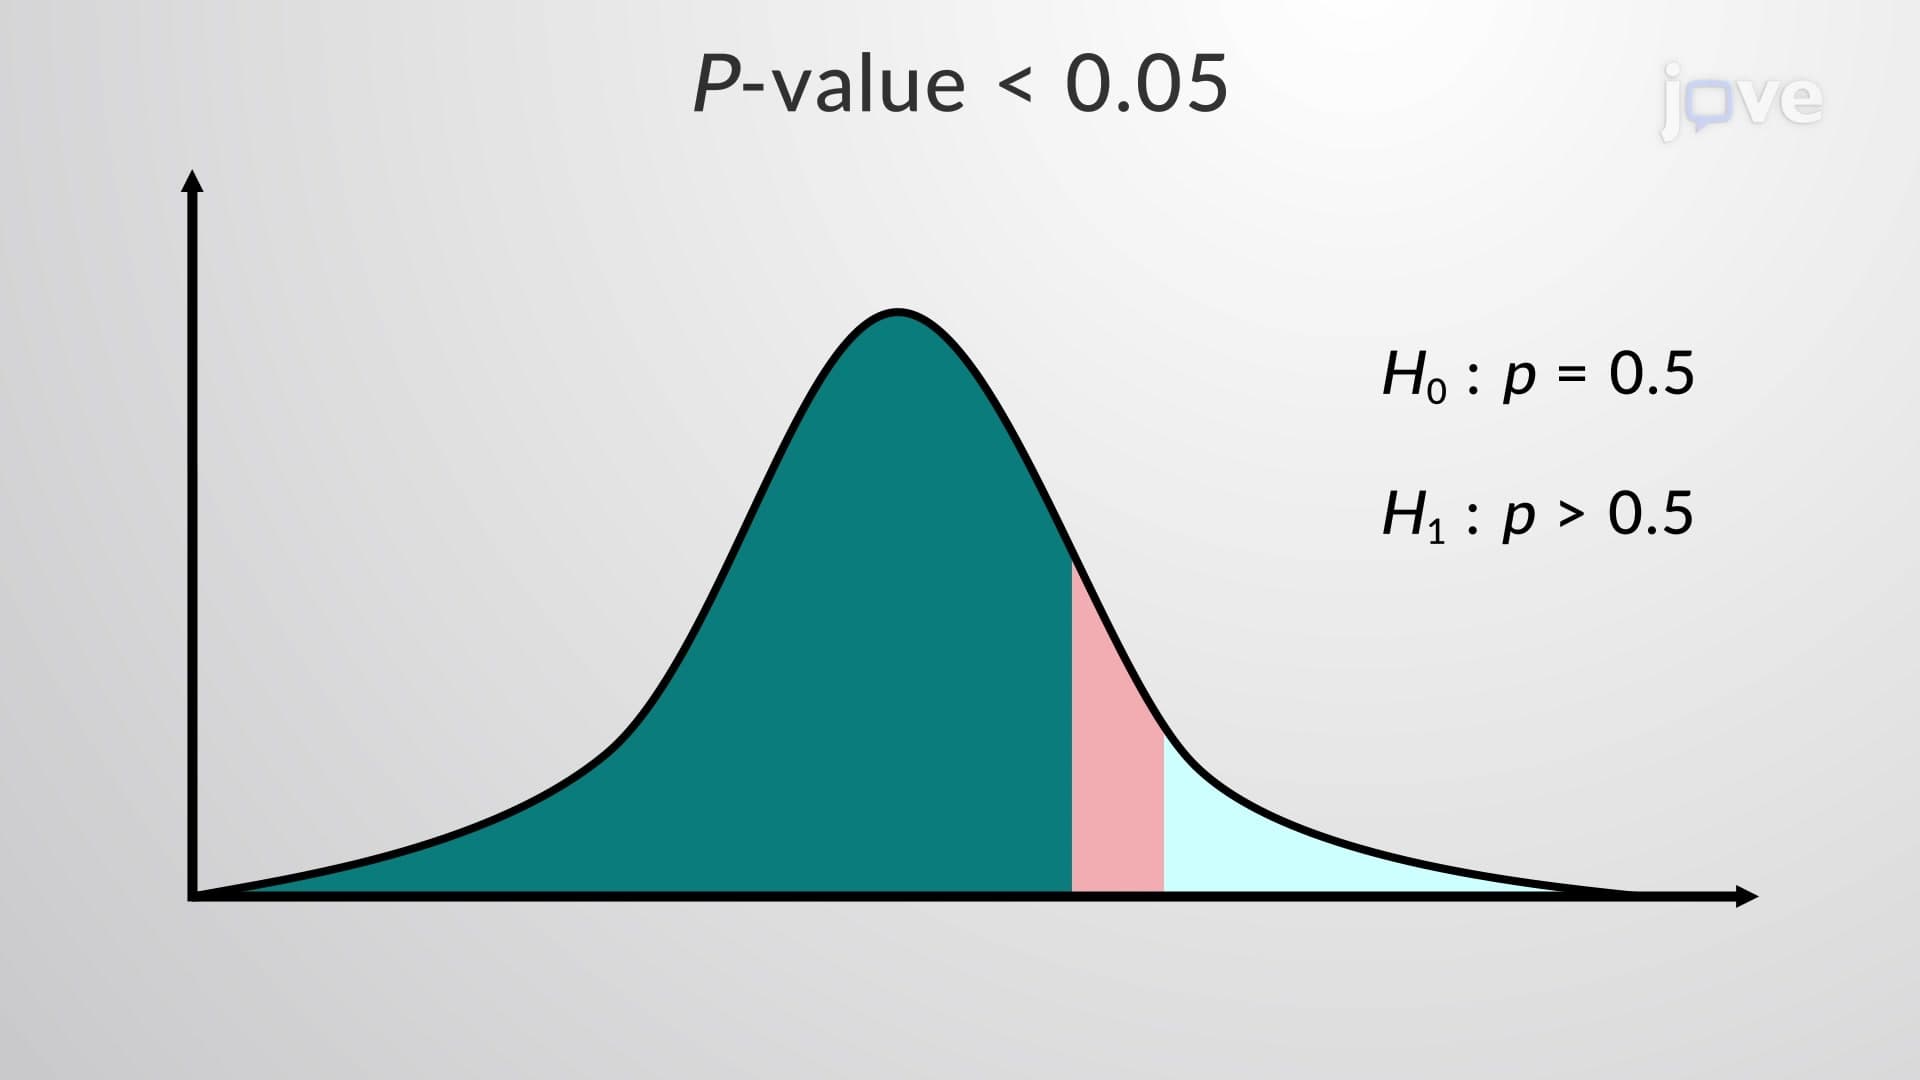
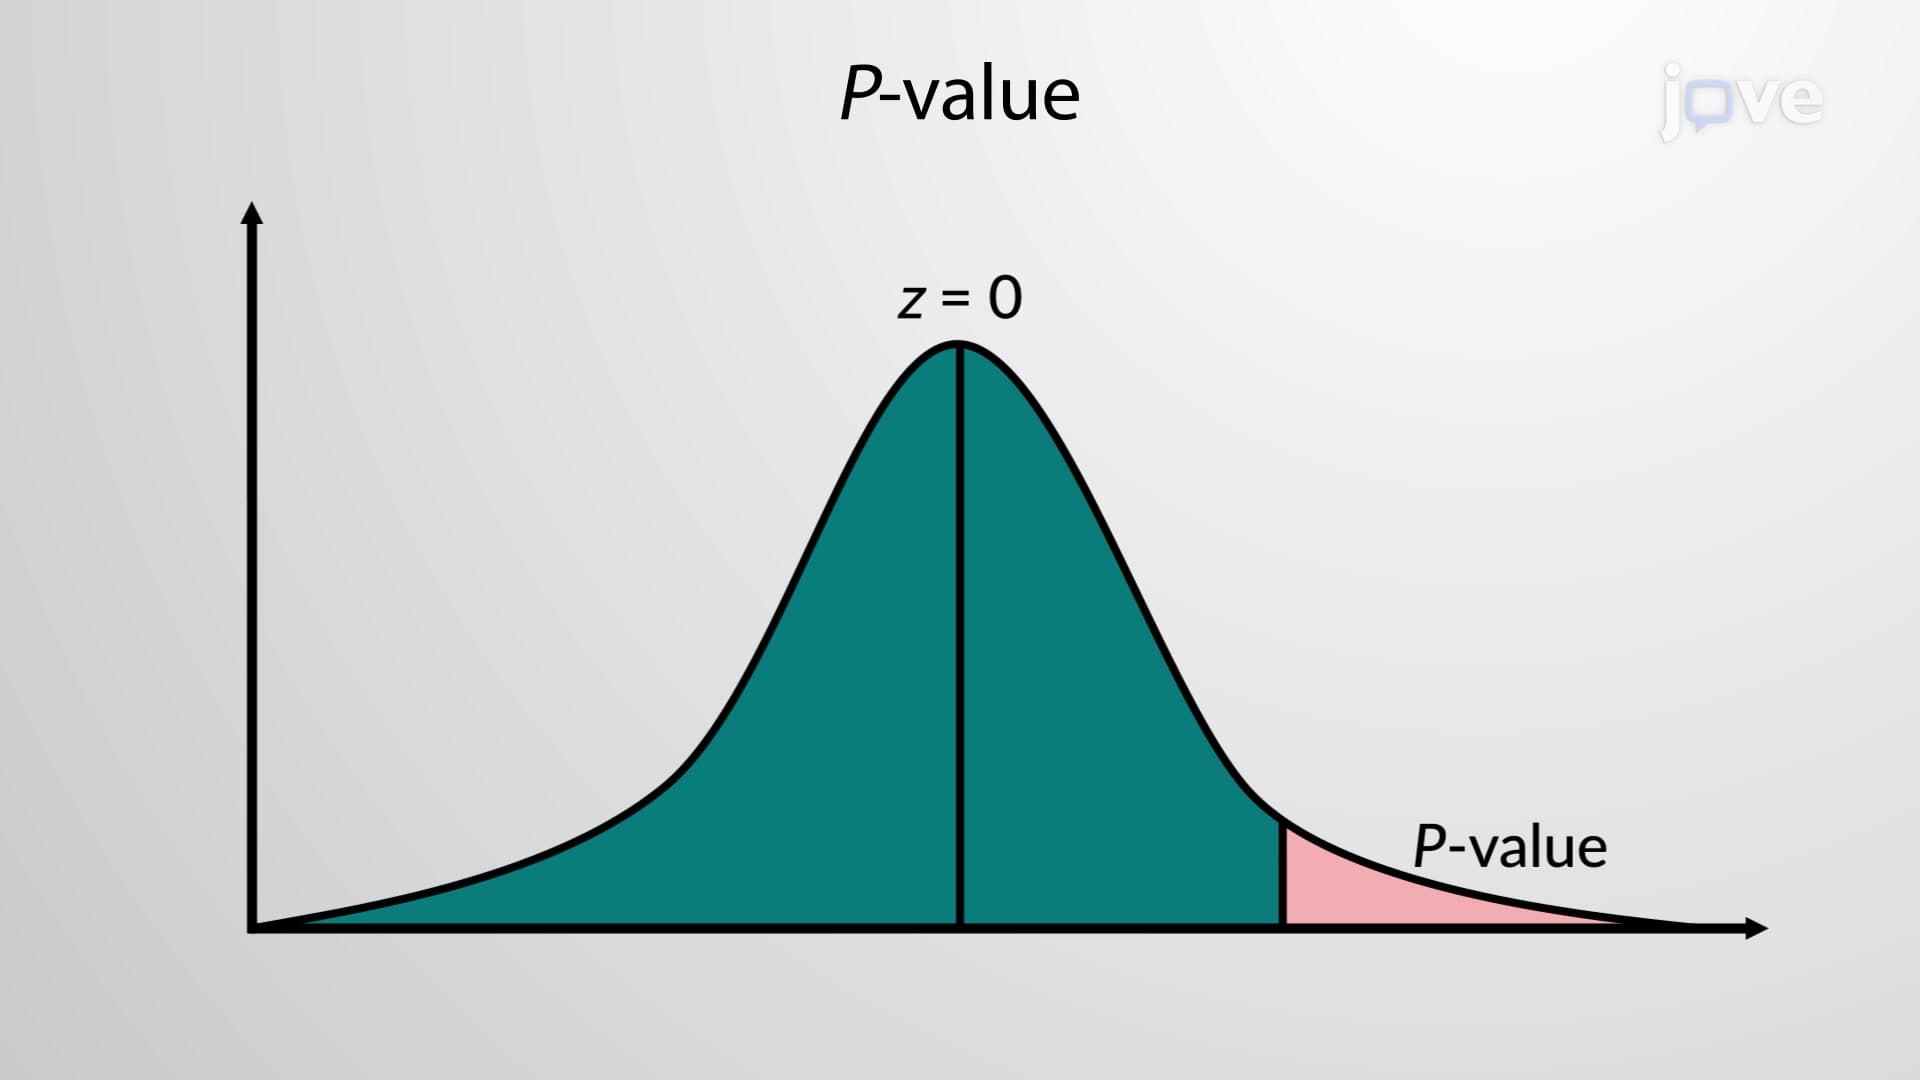
P-value interpretation provides additional decision-making support, offering precise probability measurements for observed test statistics. Values below the chosen significance level support rejecting null hypotheses, confirming claimed standard deviation changes represent genuine improvements rather than sampling variation.
Related Micro-courses