Loading…
Loading video…
118,400 views

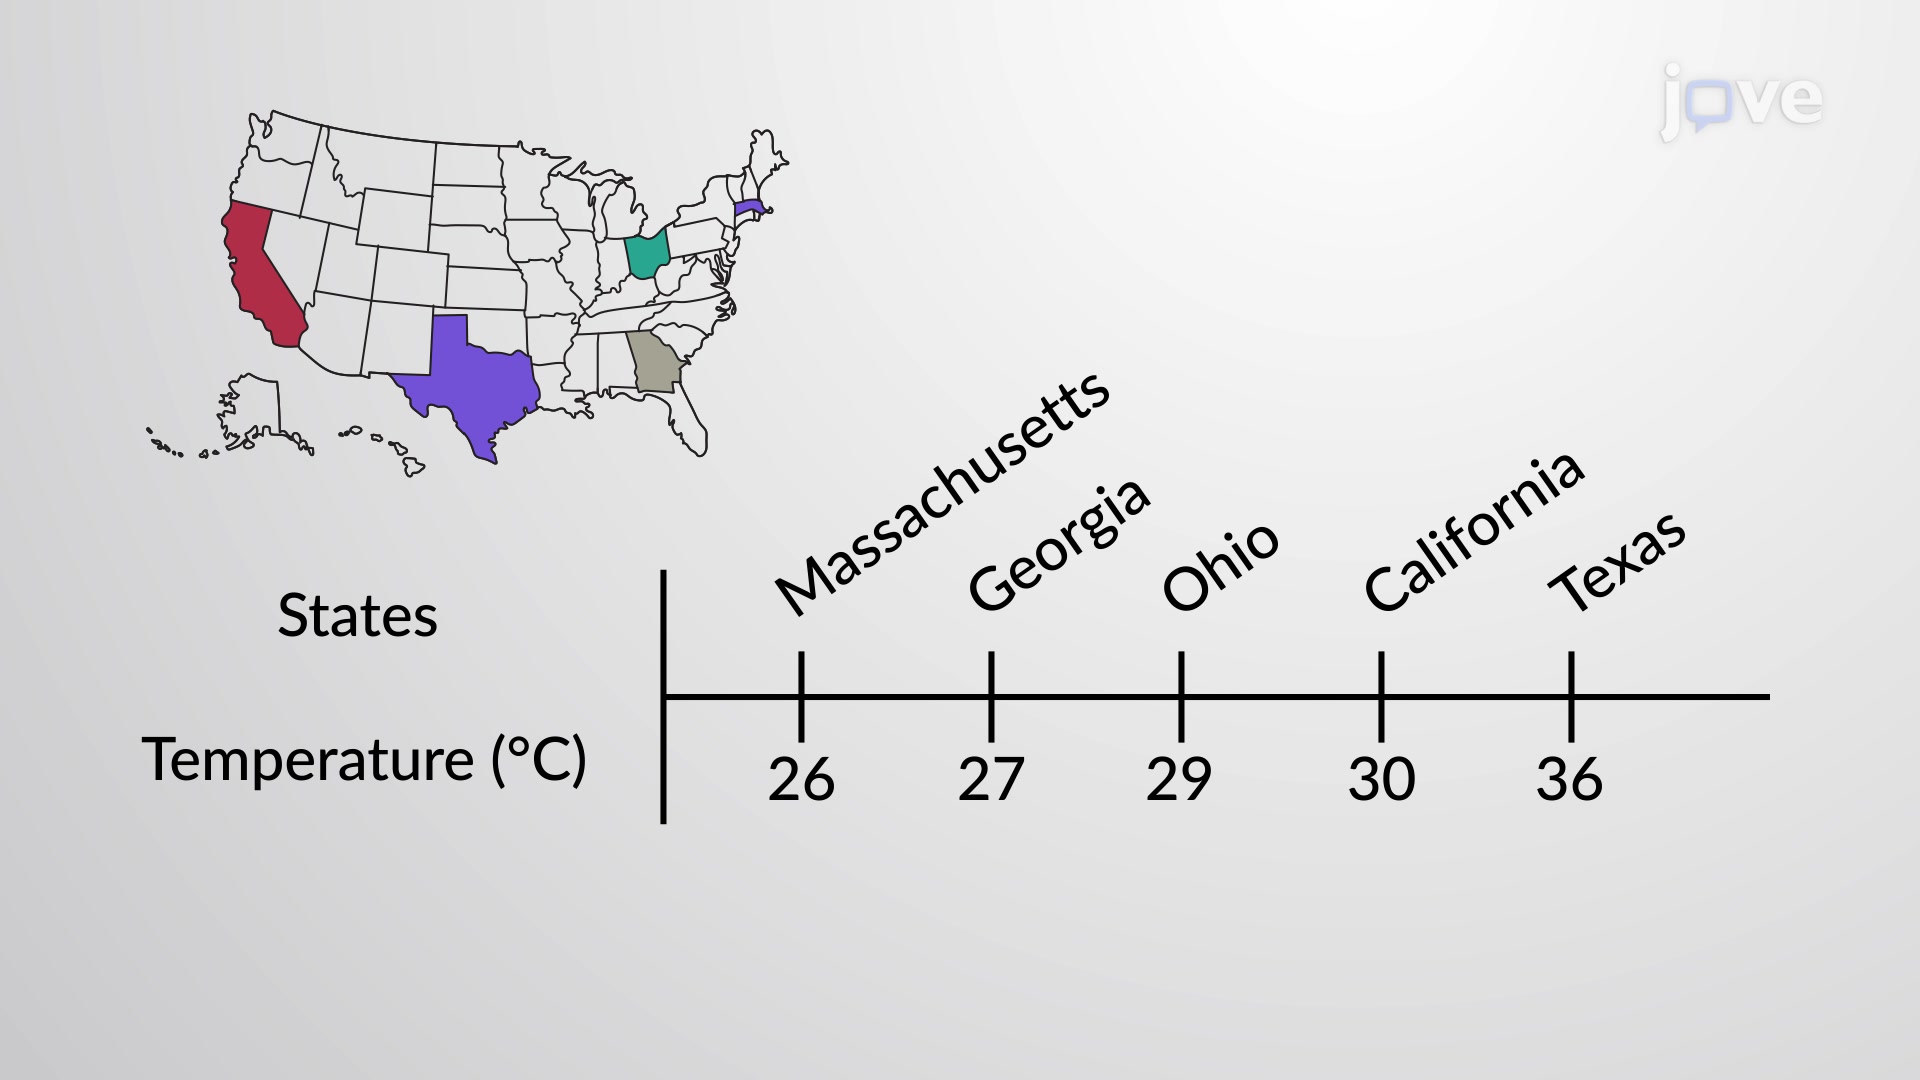
Ever wonder why some NBA players consistently hit their shots while others are unpredictable? Calculating standard deviation reveals the secret behind consistency by measuring how much data points vary from the average. This statistical tool helps us understand whether summertime temperatures across American states like Texas, Maine, and California cluster tightly around the mean or spread widely. Understanding what is calculating standard deviation empowers students to analyze real-world data patterns effectively. Watch the full video on JoVE Coach to master this concept with expert-led visuals and step-by-step explanations.
Calculating standard deviation serves as a fundamental statistical method for quantifying how much individual data points deviate from their group's average. Unlike simple range calculations that only consider extreme values, standard deviation incorporates every data point, providing a comprehensive picture of data variability. This makes it invaluable for students preparing for AP Statistics, college statistics courses, and standardized tests like the SAT Math section.
The sample standard deviation formula involves five distinct steps that build upon each other systematically. First, calculate the arithmetic mean (x̄) by summing all values and dividing by the sample size. Second, subtract this mean from each individual data point to find deviations. Third, square each deviation to eliminate negative values and emphasize larger differences. Fourth, sum these squared deviations and divide by (n-1), where n represents sample size—this adjustment corrects for sample bias. Finally, take the square root to return the result to original units.
Understanding when to use n-1 versus n in the denominator proves crucial for accurate calculations. When analyzing a sample drawn from a larger population—like measuring heights of 30 students to estimate variability for all high school students in California—use the sample formula with (n-1). This Bessel's correction accounts for the fact that samples typically underestimate population variability. However, when working with complete populations, such as analyzing test scores for an entire class, use the population formula with n as the denominator.
Standard deviation appears frequently in AP Statistics free-response questions, college midterm exams, and MCAT data interpretation sections. In quality control, manufacturing companies like Ford Motor Company use standard deviation to ensure consistent part dimensions. Financial analysts employ it to measure investment risk—stocks with higher standard deviations indicate greater price volatility. Weather services calculate standard deviation of historical temperatures to predict seasonal variations accurately. Medical researchers use it in clinical trials to assess treatment consistency across patient groups, making it essential knowledge for pre-med students preparing for the MCAT.
Frequently Asked Questions
Calculating standard deviation measures how spread out data points are from their average, providing crucial insights into data consistency and reliability. It helps distinguish between datasets that appear similar on average but have vastly different variability patterns. This statistical tool appears frequently in AP Statistics exams, college coursework, and standardized tests, making it essential for academic success.
AP Statistics frequently tests standard deviation through multiple-choice questions involving interpretation and free-response problems requiring manual calculations or analysis. Students must demonstrate understanding of when to use sample versus population formulas, interpret standard deviation in context, and explain its relationship to data spread. The exam often combines standard deviation with normal distributions and z-scores in comprehensive problems.
The SAT typically focuses on conceptual understanding rather than complex calculations, testing whether students recognize standard deviation as a measure of spread. Questions might ask students to compare datasets or interpret standard deviation values in real-world contexts. While manual calculation rarely appears, understanding the concept helps with data analysis and interpretation problems.
The MCAT incorporates standard deviation in data interpretation passages, particularly in psychology and biological sciences sections. Test-takers must analyze experimental results, compare treatment groups, and draw conclusions about data reliability. Understanding standard deviation helps interpret research findings and assess statistical significance in clinical studies.
Major US companies like General Electric use standard deviation in Six Sigma quality programs to reduce manufacturing defects, while Wall Street firms employ it to measure investment risk and portfolio volatility. Weather services use it to predict temperature ranges, and sports analytics teams analyze player performance consistency using standard deviation calculations.
Calculating standard deviation requires only basic algebra skills including arithmetic operations, squaring numbers, and square roots. Most students with Algebra I background can successfully learn this concept. The key lies in understanding the logical sequence of steps rather than complex mathematical manipulations, making it accessible for high school students.
Practice with real datasets from familiar contexts like sports statistics, weather data, or class grades to build intuitive understanding. Focus on interpreting standard deviation values rather than just memorizing formulas. Create step-by-step checklists for calculations and practice explaining what results mean in plain English, as many exams test conceptual understanding alongside computational skills.
Build upon standard deviation knowledge by exploring z-scores, normal distributions, and confidence intervals, which directly utilize standard deviation in their formulas. These concepts form the foundation for hypothesis testing and regression analysis, crucial topics for advanced placement courses and college statistics. Understanding variance (standard deviation squared) also opens pathways to ANOVA and more sophisticated statistical analyses.
Related Micro-courses
Related Subjects


