Loading video…


 29 Concepts
 134.6K views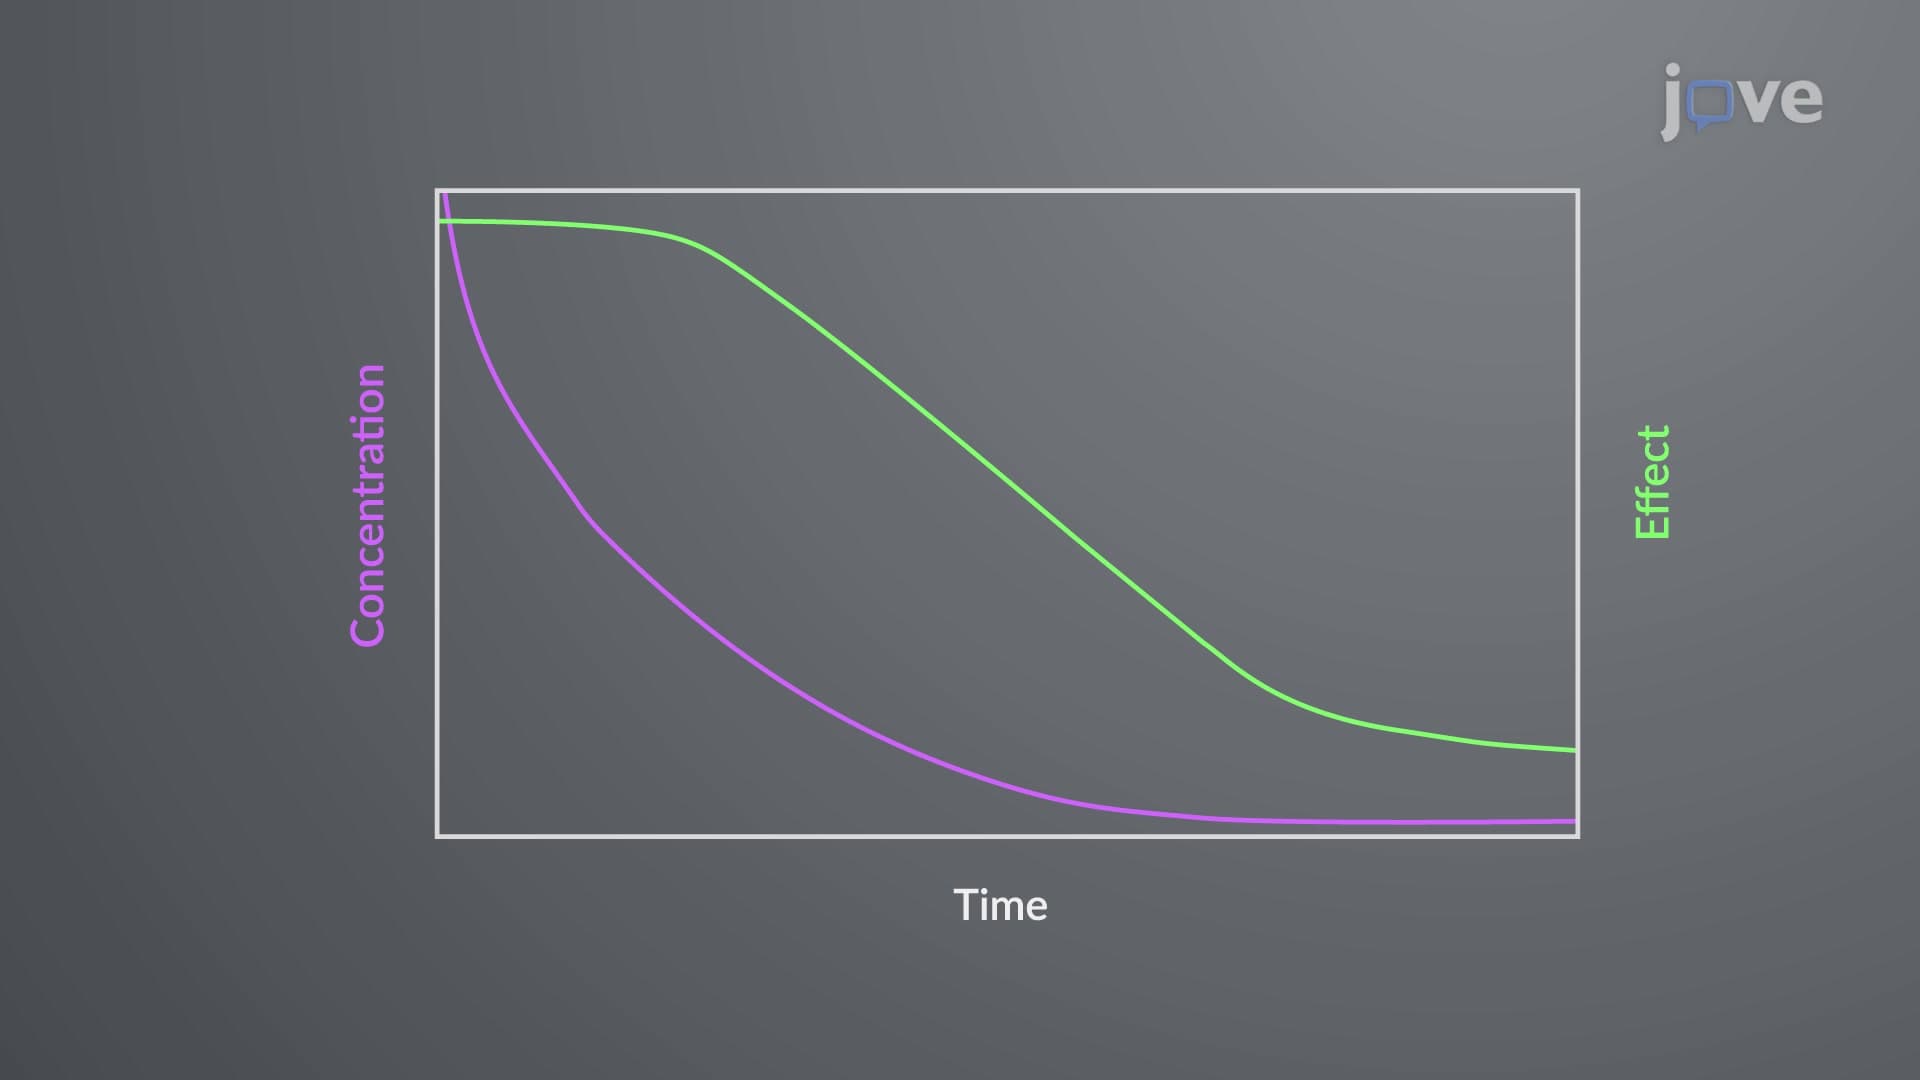

Video Summary: Time Course of Drug Effect Explained
Did you know that when you take a prescription medication like an ACE inhibitor for blood pressure, its effectiveness changes dramatically over just 24 hours? The time course drug effect describes exactly how a drug's impact rises and falls based on its concentration in your bloodstream. For instance, a medication with a 3-hour half-life reaches peak effectiveness at specific plasma concentrations before gradually declining. Time Course of Drug Effect Explained reveals the mathematical relationship between drug concentration and therapeutic response. Watch the full video on JoVE Coach to master this concept with expert-led visuals and step-by-step explanations.
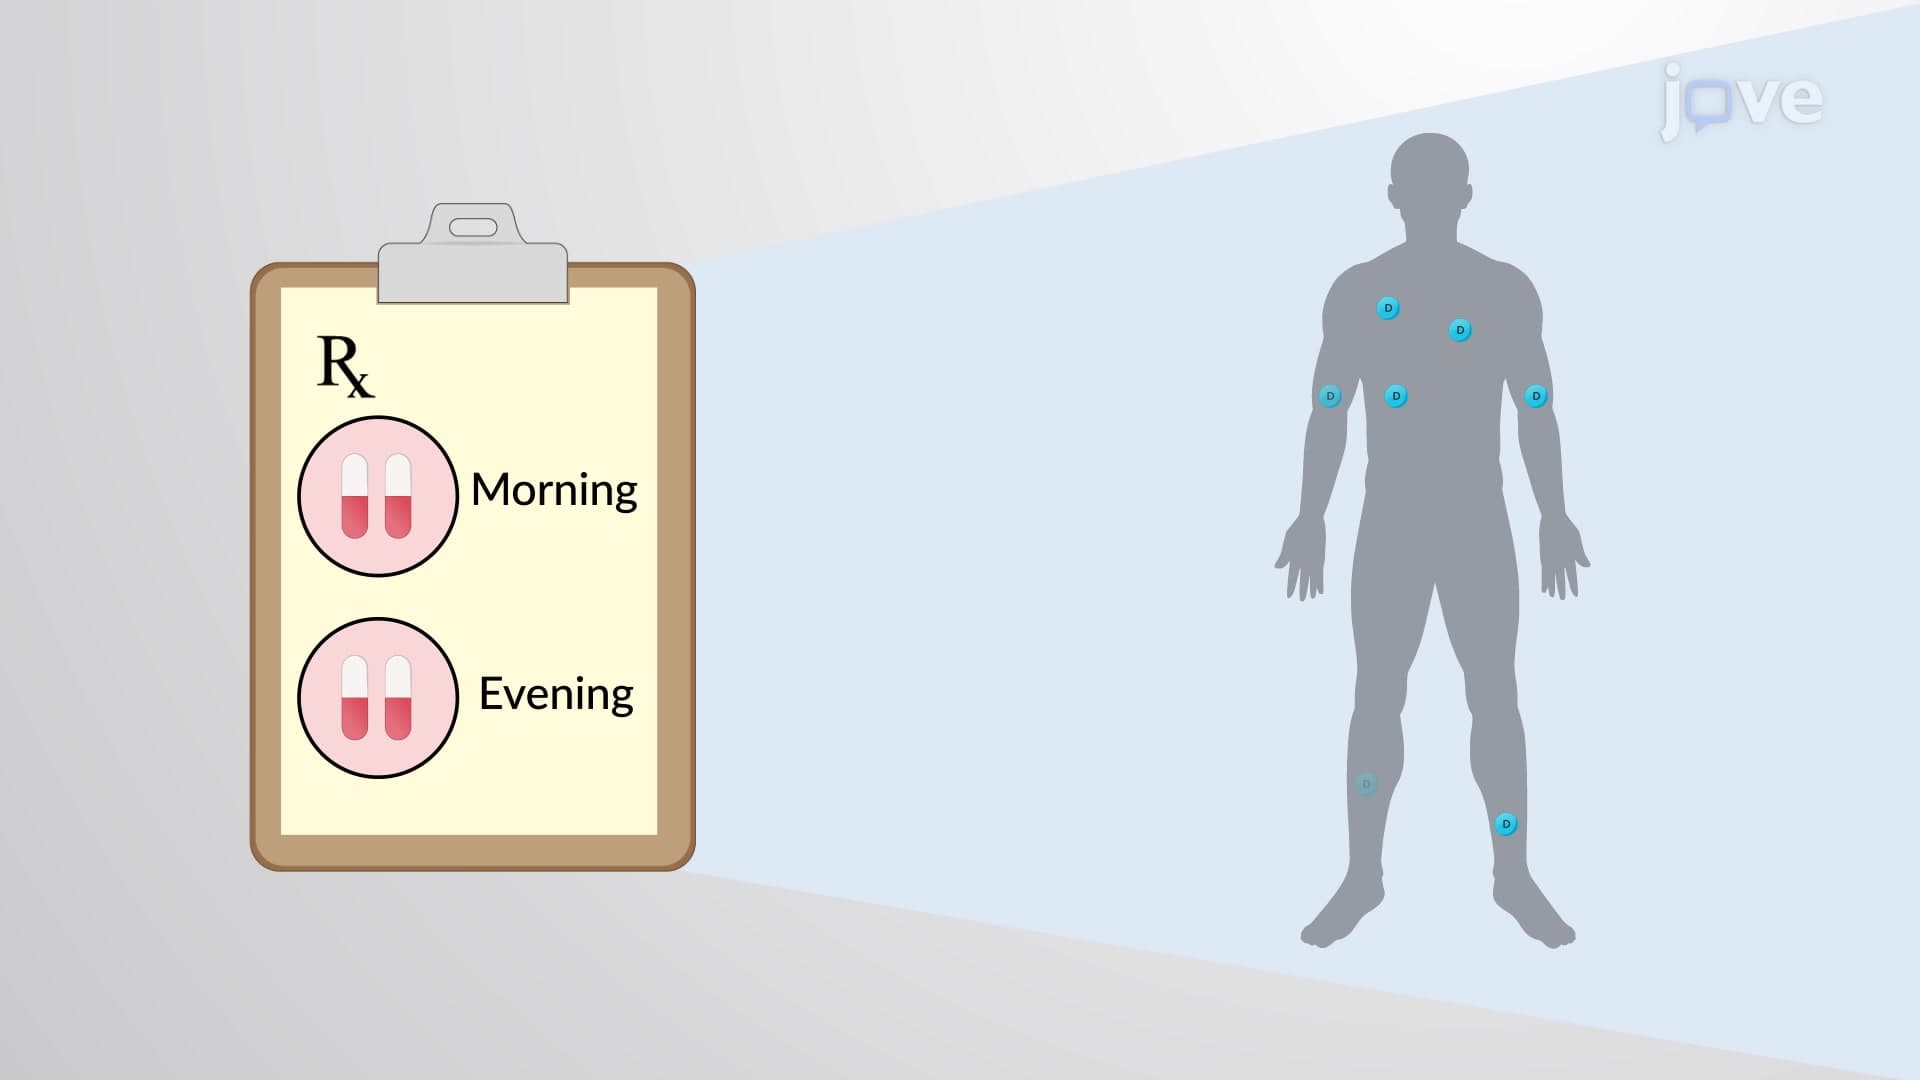
The time course drug effect represents one of pharmacology's most critical concepts, bridging the gap between drug administration and therapeutic outcome. This principle explains why medications don't work instantly and why their effects diminish over time, making it essential for understanding proper dosing intervals and therapeutic windows.
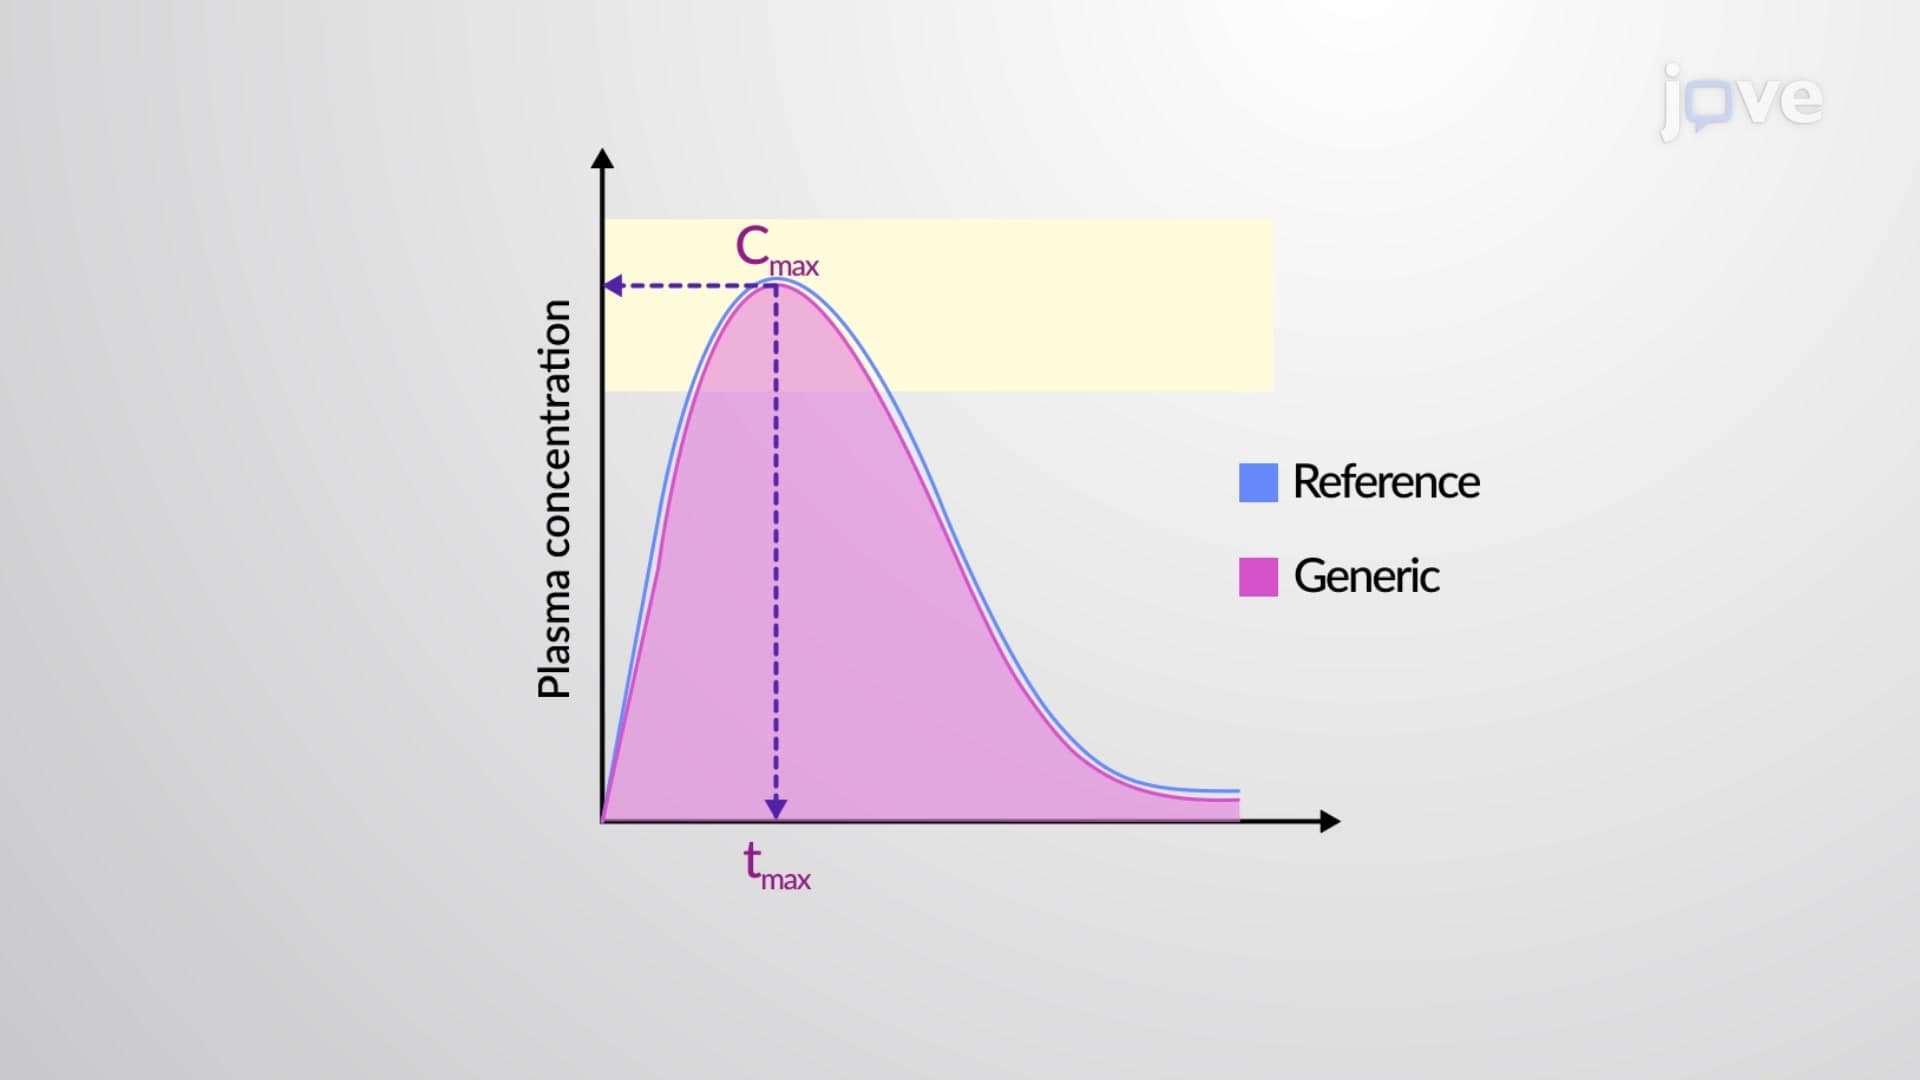
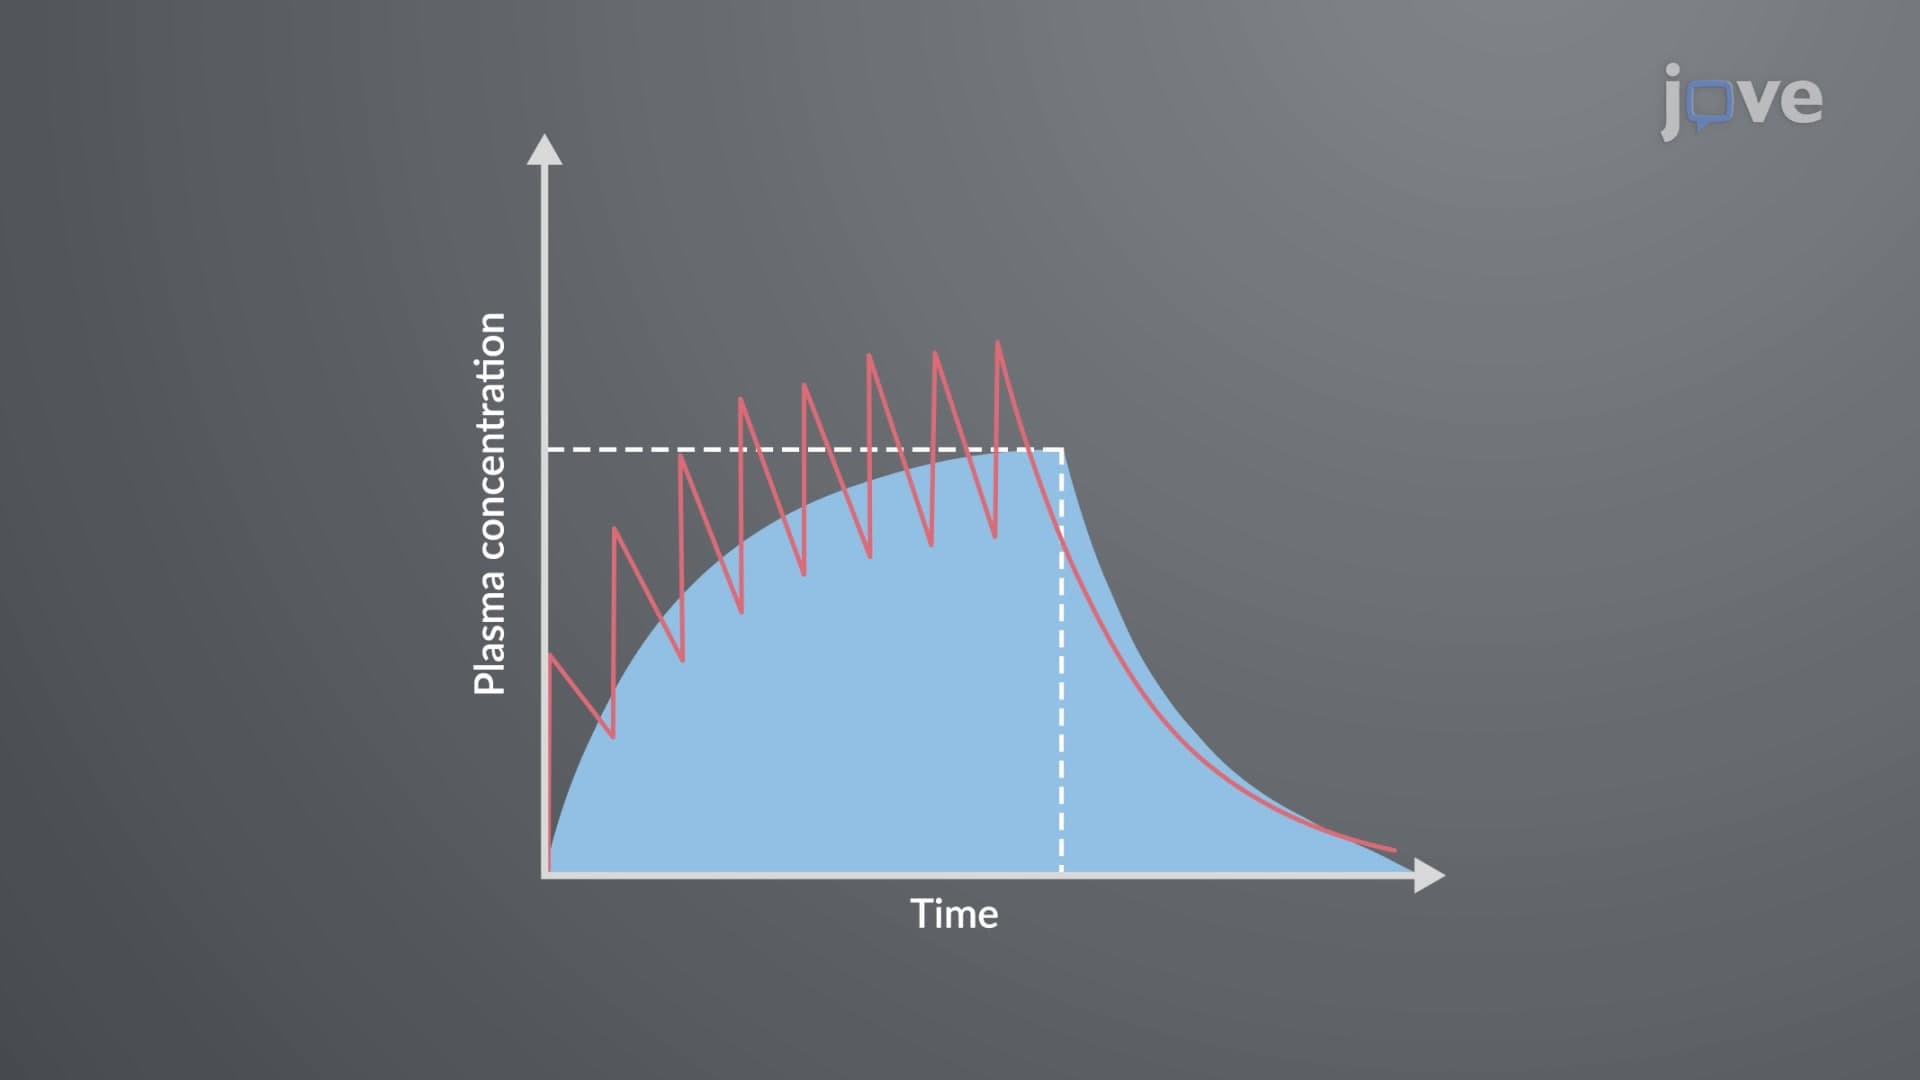
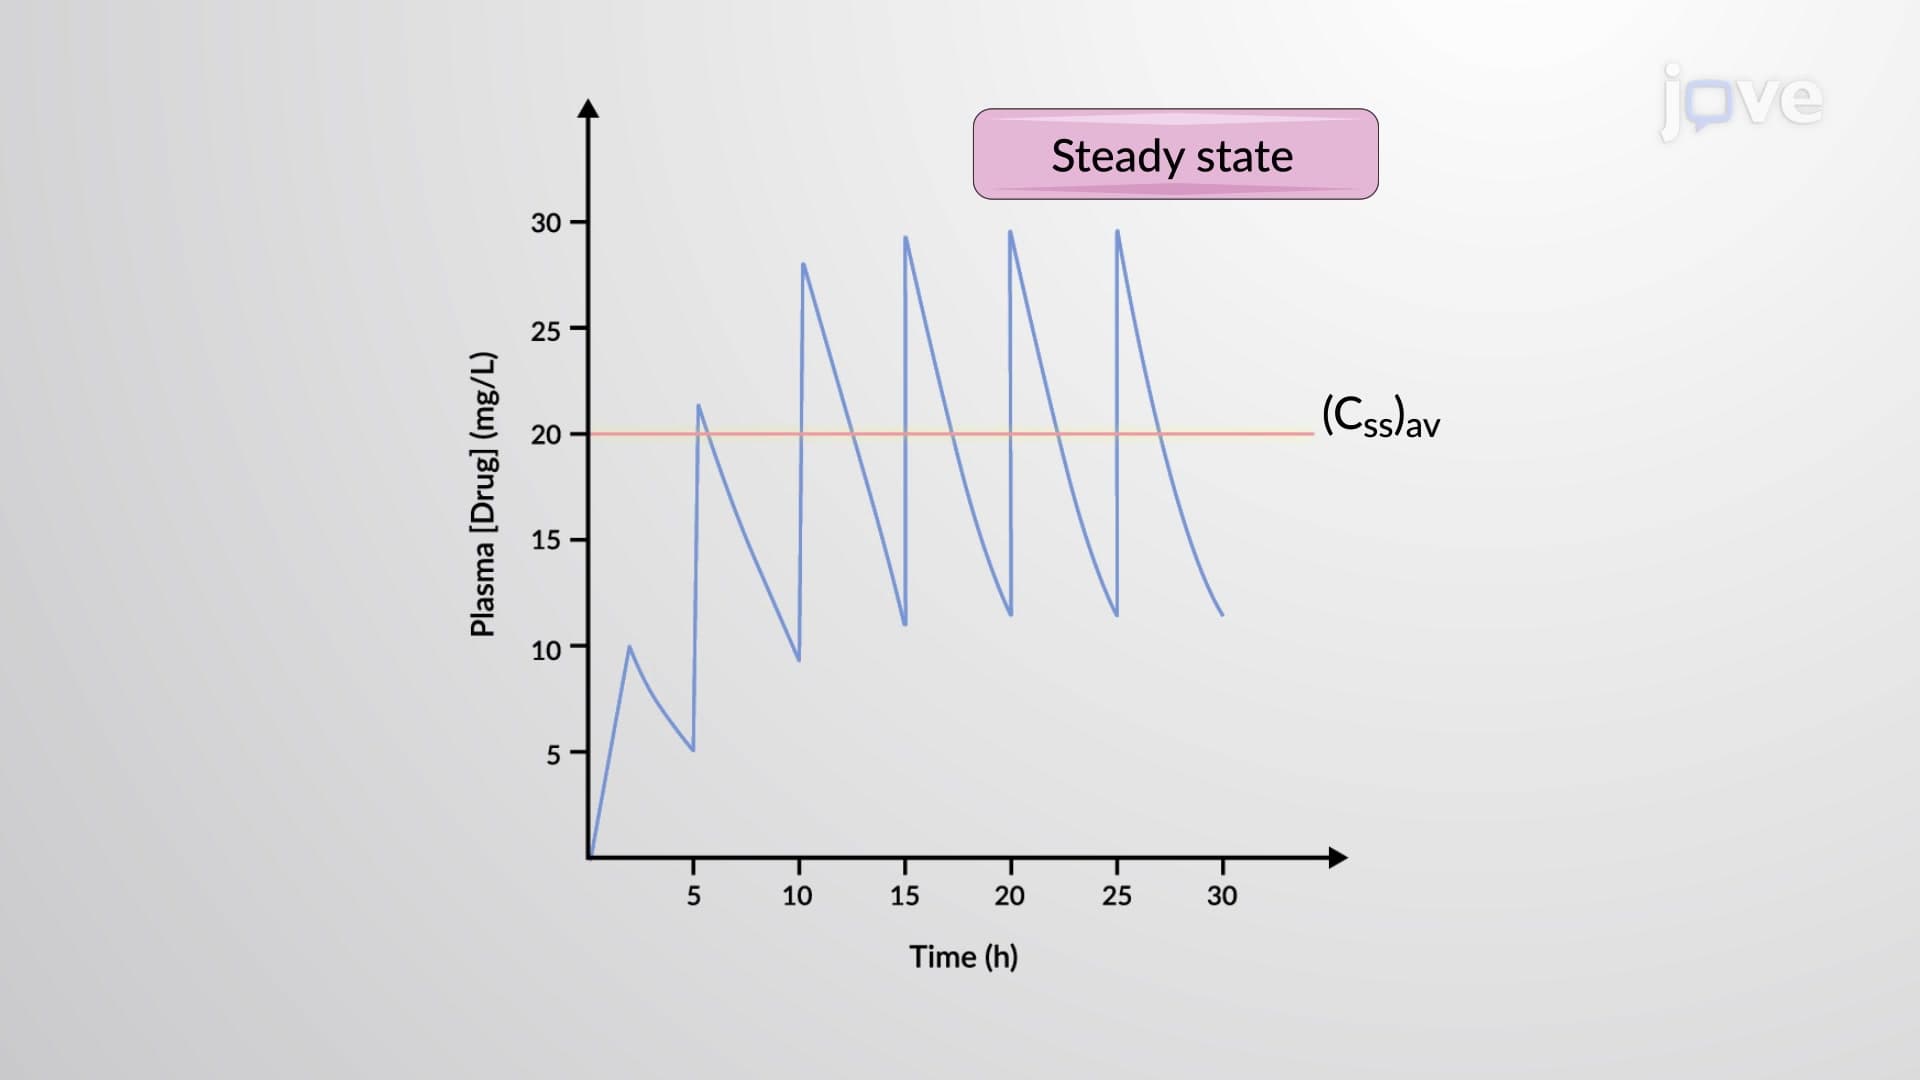
Drug effectiveness directly correlates with plasma concentration, which follows predictable patterns based on half-life. Consider a medication with a 3-hour half-life: after administration, concentration peaks then decreases by 50% every 3 hours. By 24 hours, less than 1% of peak concentration remains in the bloodstream. This mathematical relationship appears frequently on MCAT pharmacology sections and college biochemistry exams, where students must calculate remaining drug concentrations at specific time intervals.
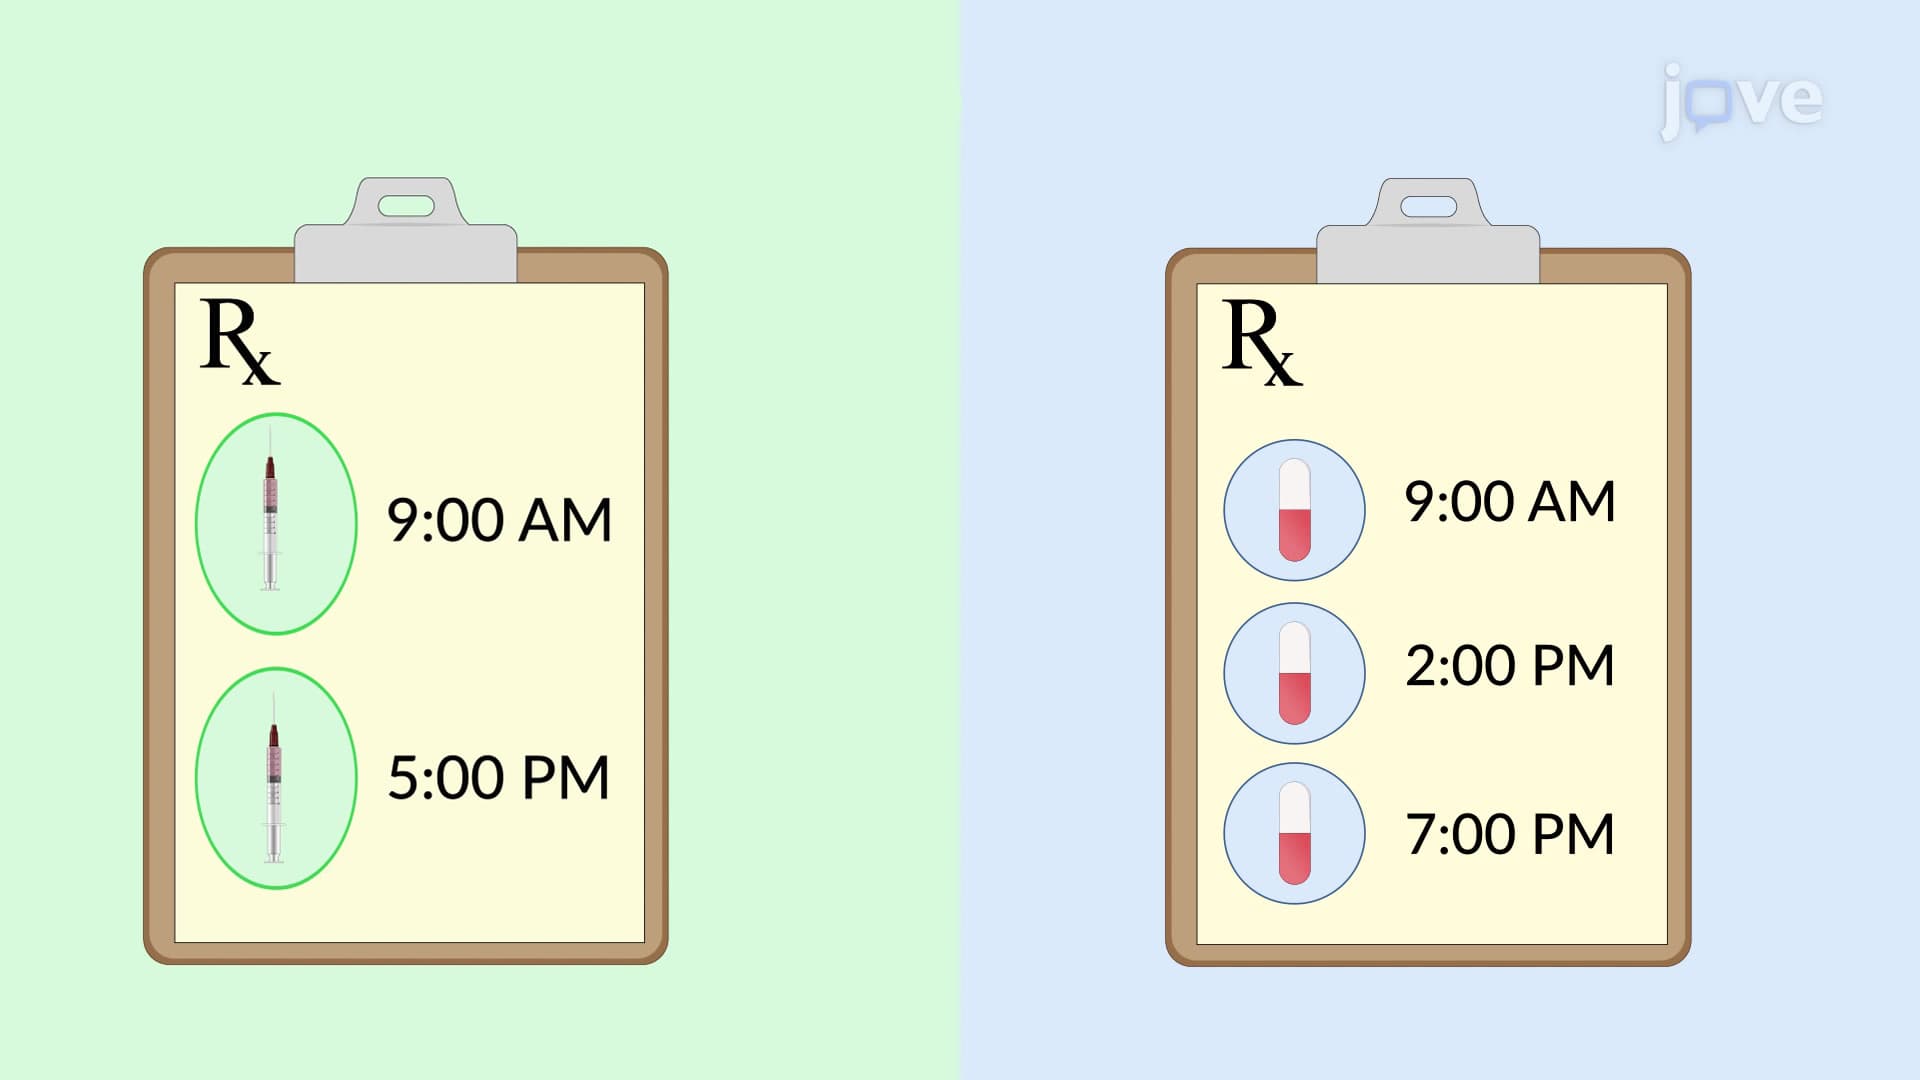
The half-life concept applies to common US medications like acetaminophen (2-4 hour half-life) or digoxin (36-hour half-life), explaining why some drugs require multiple daily doses while others need only weekly administration.
The time course of drug effect becomes clinically meaningful through C50 values - the concentration producing 50% of maximum effect. Using ACE inhibitors as an example, when plasma concentration equals C50 (1 ng/ml), the drug achieves 50% of its blood pressure-lowering potential. At concentrations producing 33% inhibition, patients experience partial therapeutic benefit.
Three distinct curve regions define drug behavior: above C80 (negligible effect changes despite concentration variations), between C80-C20 (linear relationship), and below C20 (parallel curves with minimal effectiveness). Understanding these regions helps predict therapeutic windows and guides dosing strategies.
This concept frequently appears in AP Biology, college pharmacology courses, and pre-med curricula. MCAT questions often present concentration-time graphs requiring students to predict drug effectiveness at specific intervals. USMLE Step 1 examinations test understanding of therapeutic drug monitoring, where clinicians adjust doses based on plasma concentrations to maintain effectiveness while avoiding toxicity.
Real-world applications include insulin dosing for diabetic patients, where understanding onset, peak, and duration prevents dangerous blood sugar fluctuations. Emergency medicine relies on these principles when administering medications like epinephrine, where rapid onset and predictable duration can be life-saving.
Related Micro-courses